NOAA Satellite records second largest 2-month temperature drop in history

Watts Up With That?

NOAA Satellite records second largest 2-month temperature drop in history

Anthony Watts

May 1, 2020

Excerpt:

In April, 2020, the Northern Hemisphere experienced its 2nd largest 2-month drop in temperature in the 497-month satellite record.

The Version 6.0 global average lower tropospheric temperature (LT) anomaly for April, 2020 was +0.38 deg. C, down from the March, 2020 value of +0.48 deg. C.

The Northern Hemisphere temperature anomaly fell from +0.96 deg. C to 0.43 deg. C from February to April, a 0.53 deg. C drop which is the 2nd largest 2-month drop in the 497-month satellite record. The largest 2-month drop was -0.69 deg. C from December 1987 to February 1988.
LINK

=====

CO2 effect doesn't show up on the chart below at all. :D

Here is a chart from HERE, Wood for Trees: Interactive Graphs

View attachment 330556

CO2 reading haven't changed, that's odd
Why is that odd to you?
 
Of course things are getting better. Humans aren't running around and crapping up the planet.

In India, they can again see the Himalaya's. In Venice, the water has cleared and the fish are starting to come back. LA has the best air quality they have ever had.
That was my thought also, that world wide during this shut down, we are putting less particulate into the air to catch/reflect sunlight and trap heat.

Hahaha....OMG.....no.... The Particulate count takes decades to change....lol....please try not to embarrass yourself. The Co2 concentrations have held steady which tells you all you need to know.

JO
OK, I'll be glad to listen to your theory. What ya got?

Do you understand the chart in post 1?
The chart appears to be raising trend of mean change of seawater temperature from 1979 to now. showing between .3 Deg C and a little over .5 Deg C between 1979 and 2020. Typical of trend chart used to make a case for global warming. Wasn't planning to getting sucked into global warming debate, as it is often not productive, time consuming, I am uncomfortable with methodology and data collection, and have no way personally verifyy the measurements used to project the trend lines.
Is that not a basic understanding of the chart?

The chart is from satellite data (Hadley sea surface temperature), the temperature data is also from Satellite data.

There is NO CO2 fingerprint in the water temperature data, but its warming trend runs parallel to temperature data.
 
Of course things are getting better. Humans aren't running around and crapping up the planet.

In India, they can again see the Himalaya's. In Venice, the water has cleared and the fish are starting to come back. LA has the best air quality they have ever had.
That was my thought also, that world wide during this shut down, we are putting less particulate into the air to catch/reflect sunlight and trap heat.

Hahaha....OMG.....no.... The Particulate count takes decades to change....lol....please try not to embarrass yourself. The Co2 concentrations have held steady which tells you all you need to know.

JO
OK, I'll be glad to listen to your theory. What ya got?

Do you understand the chart in post 1?
The chart appears to be raising trend of mean change of seawater temperature from 1979 to now. showing between .3 Deg C and a little over .5 Deg C between 1979 and 2020. Typical of trend chart used to make a case for global warming. Wasn't planning to getting sucked into global warming debate, as it is often not productive, time consuming, I am uncomfortable with methodology and data collection, and have no way personally verifyy the measurements used to project the trend lines.
Is that not a basic understanding of the chart?

The chart is from satellite data, the temperature data is also from Satellite data.

There is NO CO2 fingerprint in the water temperature data, but its warming trend runs parallel to temperature data.
Why do you key simply on CO2? I can assure you there was no appreciable change in CO2 during the 2 month period. to account for the anomaly you brought up. I don't think it is removed that fast.

Read this again,

The chart is from satellite data, the temperature data is also from Satellite data.

There is NO CO2 fingerprint in the water temperature data, but its warming trend runs parallel to temperature data.

CO2 doesn't warm up the ocean waters, the SUN does that....
I read it. I read it again. Your theory is that all warming or cooling, long term or very short (2 month) must be tied to CO2 in some direct way? Did you pitch the tidbit about a 2 month drop in temperatures as an unassociated bit of information (with no link supporting the claum that I saw), in no way relating to the 40 year diagram you posted? You showed nothing to even verify size of area or location of seawater study, some specific area or some extrapolation on all ocean water on the planet. Are you making a point you do not wish to state or are you asking a question?
 
Of course things are getting better. Humans aren't running around and crapping up the planet.

In India, they can again see the Himalaya's. In Venice, the water has cleared and the fish are starting to come back. LA has the best air quality they have ever had.
That was my thought also, that world wide during this shut down, we are putting less particulate into the air to catch/reflect sunlight and trap heat.

Hahaha....OMG.....no.... The Particulate count takes decades to change....lol....please try not to embarrass yourself. The Co2 concentrations have held steady which tells you all you need to know.

JO
OK, I'll be glad to listen to your theory. What ya got?

Do you understand the chart in post 1?
The chart appears to be raising trend of mean change of seawater temperature from 1979 to now. showing between .3 Deg C and a little over .5 Deg C between 1979 and 2020. Typical of trend chart used to make a case for global warming. Wasn't planning to getting sucked into global warming debate, as it is often not productive, time consuming, I am uncomfortable with methodology and data collection, and have no way personally verifyy the measurements used to project the trend lines.
Is that not a basic understanding of the chart?

The chart is from satellite data, the temperature data is also from Satellite data.

There is NO CO2 fingerprint in the water temperature data, but its warming trend runs parallel to temperature data.
Why do you key simply on CO2? I can assure you there was no appreciable change in CO2 during the 2 month period. to account for the anomaly you brought up. I don't think it is removed that fast.

Read this again,

The chart is from satellite data, the temperature data is also from Satellite data.

There is NO CO2 fingerprint in the water temperature data, but its warming trend runs parallel to temperature data.

CO2 doesn't warm up the ocean waters, the SUN does that....
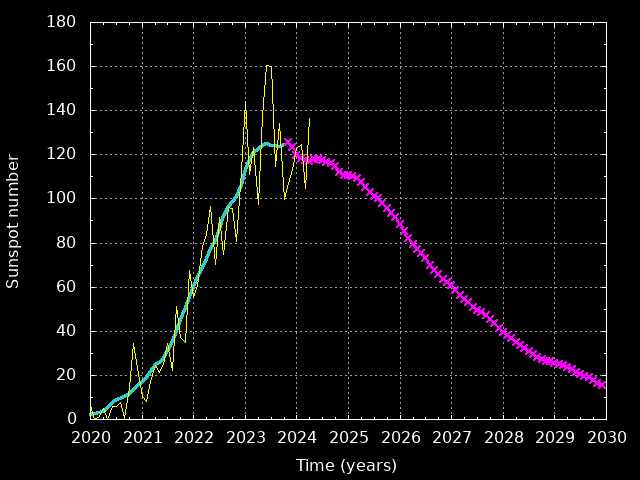
sunspot.png
 
Of course things are getting better. Humans aren't running around and crapping up the planet.

In India, they can again see the Himalaya's. In Venice, the water has cleared and the fish are starting to come back. LA has the best air quality they have ever had.
That was my thought also, that world wide during this shut down, we are putting less particulate into the air to catch/reflect sunlight and trap heat.

Hahaha....OMG.....no.... The Particulate count takes decades to change....lol....please try not to embarrass yourself. The Co2 concentrations have held steady which tells you all you need to know.

JO
OK, I'll be glad to listen to your theory. What ya got?

Do you understand the chart in post 1?
The chart appears to be raising trend of mean change of seawater temperature from 1979 to now. showing between .3 Deg C and a little over .5 Deg C between 1979 and 2020. Typical of trend chart used to make a case for global warming. Wasn't planning to getting sucked into global warming debate, as it is often not productive, time consuming, I am uncomfortable with methodology and data collection, and have no way personally verifyy the measurements used to project the trend lines.
Is that not a basic understanding of the chart?

The chart is from satellite data, the temperature data is also from Satellite data.

There is NO CO2 fingerprint in the water temperature data, but its warming trend runs parallel to temperature data.
Why do you key simply on CO2? I can assure you there was no appreciable change in CO2 during the 2 month period. to account for the anomaly you brought up. I don't think it is removed that fast.

Read this again,

The chart is from satellite data, the temperature data is also from Satellite data.

There is NO CO2 fingerprint in the water temperature data, but its warming trend runs parallel to temperature data.

CO2 doesn't warm up the ocean waters, the SUN does that....
I read it. I read it again. Your theory is that all warming or cooling, long term or very short (2 month) must be tied to CO2 in some direct way? Did you pitch the tidbit about a 2 month drop in temperatures as an unassociated bit of information (with no link supporting the claum that I saw), in no way relating to the 40 year diagram you posted? You showed nothing to even verify size of area or location of seawater study, some specific area or some extrapolation on all ocean water on the planet. Are you making a point you do not wish to state or are you asking a question?

Oh dear I think you are very confused here, I am pointing out that CO2 IS NOT much of a factor since 1979 for warming, but the ocean waters are major factor in warming. The SUN is the dominant factor in warming the ocean waters with covers over 71% of the planets surface.

I didn't make any kind of "theory" (a badly used word) about anything, what I made clear was a near perfect association between ocean warming and subsequent atmosphere warming trends, it was almost parallel, as the chart showed, which doesn't allow much room for a CO2 warm forcing influence.

The Temperature chart are from HADLEY SEA SURFACE TEMPERATURE and from UAHv6 Satellite data. I gave you the links to it, yet you keep saying I didn't provide links to them, you have a problem here...., it is obvious you are being lazy about looking into the links.

This was right above the chart I posted......

Here is a chart from HERE, Wood for Trees: Interactive Graphs

The first link is from the post one article you didn't read, the chart and source is in there, right in the open too.

You are a very lazy reader.
 
Of course things are getting better. Humans aren't running around and crapping up the planet.

In India, they can again see the Himalaya's. In Venice, the water has cleared and the fish are starting to come back. LA has the best air quality they have ever had.
That was my thought also, that world wide during this shut down, we are putting less particulate into the air to catch/reflect sunlight and trap heat.

Hahaha....OMG.....no.... The Particulate count takes decades to change....lol....please try not to embarrass yourself. The Co2 concentrations have held steady which tells you all you need to know.

JO
OK, I'll be glad to listen to your theory. What ya got?

Do you understand the chart in post 1?
The chart appears to be raising trend of mean change of seawater temperature from 1979 to now. showing between .3 Deg C and a little over .5 Deg C between 1979 and 2020. Typical of trend chart used to make a case for global warming. Wasn't planning to getting sucked into global warming debate, as it is often not productive, time consuming, I am uncomfortable with methodology and data collection, and have no way personally verifyy the measurements used to project the trend lines.
Is that not a basic understanding of the chart?

The chart is from satellite data, the temperature data is also from Satellite data.

There is NO CO2 fingerprint in the water temperature data, but its warming trend runs parallel to temperature data.
Why do you key simply on CO2? I can assure you there was no appreciable change in CO2 during the 2 month period. to account for the anomaly you brought up. I don't think it is removed that fast.

Read this again,

The chart is from satellite data, the temperature data is also from Satellite data.

There is NO CO2 fingerprint in the water temperature data, but its warming trend runs parallel to temperature data.

CO2 doesn't warm up the ocean waters, the SUN does that....
sunspot.png

Solar cycle 25 has begun.
 
I posted this because it is an unusual drop in temperature, the second biggest since 1979. Neither the article or myself claimed this was a trend, just pointing out an unusual drop, but the chart in post one has so far eluded every one here, the significance of it has yet to be noticed.

If this has happen twice in the past 40 years ... then we can very precisely state that this has a probability of 5% to occur in any given year ... or "20 year event" ... sounds about as normal as normal can be ...
As indicated last month we suggested that the drop is due in part to the cooling of the central Pacific Ocean. Recall that in the latter months of 2019, a weak, warm El Niño like event occurred which aided in warming up the atmosphere for a few months but that impact is mostly exhausted now. The two-month drop in the Northern Hemisphere temperature of -0.53 °C is rare – exceeded only once in the 497-month history when the hemisphere cooled between the 1987 warm El Niño and the cold 1989 La Niña. The NH temperature dropped -0.69 °C between December 1987 and February 1988.

Yeah ... normal as normal can be ...

There are 8 extreme events that can occur at any weather station ... roughly 6,000 stations giving 48,000 possible extreme events per year ... or 2,400 twenty-year-events in every given year (on average) ... the article in the OP calls this "rare", you call this "unusual" ...

I call this typical weather ...

DR. Spenser himself wrote:

In April, 2020, the Northern Hemisphere experienced its 2nd largest 2-month drop in temperature in the 497-month satellite record.

It has happened more than two times of huge short term drop in temperature since 1979, as the chart itself makes clear, do you know where #3 and #4 largest drops are?

He also wrote:

The two-month drop in the Northern Hemisphere temperature of -0.53 °C is rare – exceeded only once in the 497-month history when the hemisphere cooled between the 1987 warm El Niño and the cold 1989 La Niña. The NH temperature dropped -0.69 °C between December 1987 and February 1988.

He was talking about the depth of the drop as being rare...…., in the Satellite data.

Your semantic nitpicking has been noted and exposed.
 
Oh dear I think you are very confused here, I am pointing out that CO2 IS NOT much of a factor since 1979 for warming, but the ocean waters are major factor in warming. The SUN is the dominant factor in warming the ocean waters with covers over 71% of the planets surface.

Are you suggesting the physical properties of water has change in the past 40 years ... before, liquid water behaved as near as a blackbody radiator as to make no difference ... today, you're claiming this isn't so? ... I'm sorry, whatever amount of solar energy that the oceans retain has been being retained for billions of years ... with everything else being the same, the oceans are at their equilibrium temperature ... any rise will be due to a change in this equilibrium ... a change in something else ...

In the most reasonable worst-case-scenario in the recent IPCC report (RCP4.5) gives the 40 year increase in average global temperatures as being well within the instrumentation error ... the 0.38 ºC number from the chart in the OP's link cannot be measured that accurately, claims that cannot be measured are philosophical, not scientific ...
 
Your semantic nitpicking has been noted and exposed.

I'm calling you out for using weasel words ... is "semantic nitpicking" the New Speak term for this? ...

Scientists use something call "standard deviation" ... anytime we can calculate an average, we can calculate this standard deviation ... the complete and utter failure of your friend Dr. Spencer to add this vital information speaks to a hiding of truth ...

I can just look at the data and tell this 0.5ºC change is within the third deviation ... normal as normal can be ... a value that can be expected and usually occurs ... especially as El Nino changes over to La Nina, and during a period of high Arctic Oscillation index ... "the sum of periodic functions is itself periodic" ...
 
Oh dear I think you are very confused here, I am pointing out that CO2 IS NOT much of a factor since 1979 for warming, but the ocean waters are major factor in warming. The SUN is the dominant factor in warming the ocean waters with covers over 71% of the planets surface.

Are you suggesting the physical properties of water has change in the past 40 years ... before, liquid water behaved as near as a blackbody radiator as to make no difference ... today, you're claiming this isn't so? ... I'm sorry, whatever amount of solar energy that the oceans retain has been being retained for billions of years ... with everything else being the same, the oceans are at their equilibrium temperature ... any rise will be due to a change in this equilibrium ... a change in something else ...

In the most reasonable worst-case-scenario in the recent IPCC report (RCP4.5) gives the 40 year increase in average global temperatures as being well within the instrumentation error ... the 0.38 ºC number from the chart in the OP's link cannot be measured that accurately, claims that cannot be measured are philosophical, not scientific ...

What has gotten in you?

Ocean water temperature is NEVER in equilibrium, thus evidence that something is always changing. El-Nino sucks energy from it, so does Tropical Storms/Hurricanes, so does prevailing winds, changing cloud cover, and so on.

All I talked about was the last 40 years, that was all, not only that I showed using the data that when ocean waters warms, so does the atmosphere in a nearly perfect line, which doesn't leave much room for that much talked about CO2 warm forcing effect.

You have added the IPCC report scenario which is irrelevant here since the two month unusual huge temperature drop was the topic, you seem defensive over something that didn't originate from article or me.

CO2 doesn't warm up the oceans, the SUN does that.
 
Your semantic nitpicking has been noted and exposed.

I'm calling you out for using weasel words ... is "semantic nitpicking" the New Speak term for this? ...

Scientists use something call "standard deviation" ... anytime we can calculate an average, we can calculate this standard deviation ... the complete and utter failure of your friend Dr. Spencer to add this vital information speaks to a hiding of truth ...

I can just look at the data and tell this 0.5ºC change is within the third deviation ... normal as normal can be ... a value that can be expected and usually occurs ... especially as El Nino changes over to La Nina, and during a period of high Arctic Oscillation index ... "the sum of periodic functions is itself periodic" ...

:auiqs.jpg:

Oh my you go bananas, the fact that it is the second largest drop since 1979 triggers you into a babble fest, when you fail to realize that Dr. Spenser himself doesn't discount anything, he simply calls it a rare level of a drop nothing more. He doesn't pontificate on it at all, it is YOU who is trying inject something beyond what Dr. Spenser reported, which is unusually deep two month drop, that was his report, nothing more.

Third deviation level change you whine about is getting to be way out there...…

You need to slow down here......
 
Of course things are getting better. Humans aren't running around and crapping up the planet.

In India, they can again see the Himalaya's. In Venice, the water has cleared and the fish are starting to come back. LA has the best air quality they have ever had.
That was my thought also, that world wide during this shut down, we are putting less particulate into the air to catch/reflect sunlight and trap heat.

Hahaha....OMG.....no.... The Particulate count takes decades to change....lol....please try not to embarrass yourself. The Co2 concentrations have held steady which tells you all you need to know.

JO
OK, I'll be glad to listen to your theory. What ya got?

Do you understand the chart in post 1?
The chart appears to be raising trend of mean change of seawater temperature from 1979 to now. showing between .3 Deg C and a little over .5 Deg C between 1979 and 2020. Typical of trend chart used to make a case for global warming. Wasn't planning to getting sucked into global warming debate, as it is often not productive, time consuming, I am uncomfortable with methodology and data collection, and have no way personally verifyy the measurements used to project the trend lines.
Is that not a basic understanding of the chart?

The chart is from satellite data, the temperature data is also from Satellite data.

There is NO CO2 fingerprint in the water temperature data, but its warming trend runs parallel to temperature data.
Why do you key simply on CO2? I can assure you there was no appreciable change in CO2 during the 2 month period. to account for the anomaly you brought up. I don't think it is removed that fast.

Read this again,

The chart is from satellite data, the temperature data is also from Satellite data.

There is NO CO2 fingerprint in the water temperature data, but its warming trend runs parallel to temperature data.

CO2 doesn't warm up the ocean waters, the SUN does that....
sunspot.png

Solar cycle 25 has begun.
We’re headed for a geomagnetic pole reversal and a micro nova. This will kill most of humankind and most other species on the planet. So, no need to worry about global warming.
 
Ocean water temperature is NEVER in equilibrium, thus evidence that something is always changing. El-Nino sucks energy from it, so does Tropical Storms/Hurricanes, so does prevailing winds, changing cloud cover, and so on.

So ... you agree that temperature is always changing and these changes are as normal as normal can be ...

... since the two month unusual huge temperature drop was the topic ...

[emphasis mine]

Still using weasel words? ... shame on you ... perhaps you've studied the ways of our enemy for too long and have begun to adopt their ways ... where would we be today if Saruman had obtained the Great Ring? ...

It's called "weather" ... and a half degree change over two months is typical ... not "huge" ... temps have changed that much in just the past hour here in North America ...
 
Oh my you go bananas, the fact that it is the second largest drop since 1979 triggers you into a babble fest, when you fail to realize that Dr. Spenser himself doesn't discount anything, he simply calls it a rare level of a drop nothing more. He doesn't pontificate on it at all, it is YOU who is trying inject something beyond what Dr. Spenser reported, which is unusually deep two month drop, that was his report, nothing more.

Third deviation level change you whine about is getting to be way out there...…

You need to slow down here......

Dr Spenser is wrong ... or he wouldn't have had some 14-year-old post this ... he would have had a refereed scientific journal publish this ... oh, except he couldn't call this "rare" in such a journal ... they don't allow weasel words ... they require actual standard deviation numbers ...

Normal as normal can be ... nothing unusual ...

ETA: These are the same standards I hold the Alarmists to ... why shouldn't I also hold my fellow Denialists to the same standard? ...
 
Ocean water temperature is NEVER in equilibrium, thus evidence that something is always changing. El-Nino sucks energy from it, so does Tropical Storms/Hurricanes, so does prevailing winds, changing cloud cover, and so on.

So ... you agree that temperature is always changing and these changes are as normal as normal can be ...

... since the two month unusual huge temperature drop was the topic ...

[emphasis mine]

Still using weasel words? ... shame on you ... perhaps you've studied the ways of our enemy for too long and have begun to adopt their ways ... where would we be today if Saruman had obtained the Great Ring? ...

It's called "weather" ... and a half degree change over two months is typical ... not "huge" ... temps have changed that much in just the past hour here in North America ...
Ha ha, it is clear you didn't read the article, I never originated the word unusual, it was written by Anthony Watts.

No that .53C drop in a two month period is actually unusual, which Dr. Spenser makes clear with his satellite data spanning 40 years, only one larger than that in a TWO month period, that was in 1987-88 time frame.

Here is why you are looking silly here:

The Version 6.0 global average lower tropospheric temperature (LT) anomaly for April, 2020 was +0.38 deg. C, down from the March, 2020 value of +0.48 deg. C.

The Northern Hemisphere temperature anomaly fell from +0.96 deg. C to 0.43 deg. C from February to April, a 0.53 deg. C drop which is the 2nd largest 2-month drop in the 497-month satellite record. The largest 2-month drop was -0.69 deg. C from December 1987 to February 1988
.

bolding mine

Notice the word ANOMALY?

You seem to be at war with Dr. Spenser, you are invited to tell him how wrong he is at his blog.

:D
 

Forum List

Back
Top