Navigation
Install the app
How to install the app on iOS
Follow along with the video below to see how to install our site as a web app on your home screen.
Note: This feature may not be available in some browsers.
More options
Style variation
You are using an out of date browser. It may not display this or other websites correctly.
You should upgrade or use an alternative browser.
You should upgrade or use an alternative browser.
NASA: "Sea levels are FALLING!!"
- Thread starter skookerasbil
- Start date
CrusaderFrank
Diamond Member
- May 20, 2009
- 163,382
- 89,990
- 2,645
When you have consensus, do you really need evidence?
jc456
Diamond Member
- Dec 18, 2013
- 160,742
- 40,275
- 2,180
exactlyWhen you have consensus, do you really need evidence?
CrusaderFrank
Diamond Member
- May 20, 2009
- 163,382
- 89,990
- 2,645
^ Denier!!Funny....
We are visiting the Philippines this summer, and after 10 years I can see absolutely zero difference in the water level.
skookerasbil
Platinum Member
- Thread starter
- #45
noticed that the climate crusaders let this thread fall off the first page REAL fast...........doesn't quite fit the narrative so that makes sense!!
Notice when the climate crusaders get data from NASA and the NOAA that don't fit their established narrative.........zero interest in debate.
ghey
Notice when the climate crusaders get data from NASA and the NOAA that don't fit their established narrative.........zero interest in debate.
ghey
CrusaderFrank
Diamond Member
- May 20, 2009
- 163,382
- 89,990
- 2,645
They have Mann's one tree ring, what more evidence do they need?
Science = settled!
Science = settled!
skookerasbil
Platinum Member
- Thread starter
- #47
Again..........we have to remember when reading the posts of some of the folks in this forum............
There are people in this world who just automatically tend to the hysterical. These are the people who, if they are in public and somebody hits the floor, they lose it. Don't know dick about what to do.........panic. Same with if they see a regular storm that you and I have seen 4 billion times. They tend to the hysterical and freek out!! We all know the types........they over-react to most things that come up in life. Six inch snowstorm coming? They are the first on line at the grocery store with 4 baskets in tow. You see them in day to day life and their stress threshold is laughable..........and we know them........they drive us nuts when we are around them.
This is EXACTLY the type that will write 17 paragraphs in here about the sea rising 1 mm........what can you do?
They are indeed fringe..........exceedingly fringe. Think about it.......in the last 5 years, we have 3 or 4 of the same hysterical-types in this forum who we call "climate crusaders"........nobody else with their sentiments wanders in here with any kind of regularity. The hysterical types are the only ones obsessed with this stoopid science nonsense and this mirrors the sentiment of the public. Nobody is caring about global warming in 2017.........the masses simply don't tend to the hysterical. Why? They have real life shit worrying them................
Last edited:
ScienceRocks
Democrat all the way!
- Banned
- #48
Completely detached from reality I see. lol
Because the sea levels go down slightly as they naturally do after a peak doesn't mean that sea levels over the "means" isn't warming. One year doesn't tell us shit.
This has happened plenty of times

Because the sea levels go down slightly as they naturally do after a peak doesn't mean that sea levels over the "means" isn't warming. One year doesn't tell us shit.
This has happened plenty of times
Billy_Bob
Diamond Member
Now lets remove the added 1.8-2.1mm/year NASA has been adding and tell me what that does to your slope.. 2/3rds of your slope vanishes...Completely detached from reality I see. lol
Because the sea levels go down slightly as they naturally do after a peak doesn't mean that sea levels over the "means" isn't warming. One year doesn't tell us shit.
This has happened plenty of times
Last edited:
skookerasbil
Platinum Member
- Thread starter
- #50
Important thread to keep afloat on this lead page of the ENVIRONMENT forum........for non-religion board members, of course. Sea level rise is one of those major themes coming from the established narrative of the k00ks...they make sea level rise a certainty when nobody knows dick about the certainty of any of this shit.
SSDD
Gold Member
- Nov 6, 2012
- 16,672
- 1,968
- 280
Completely detached from reality I see. lol
Because the sea levels go down slightly as they naturally do after a peak doesn't mean that sea levels over the "means" isn't warming. One year doesn't tell us shit.
This has happened plenty of times
You never stop demonstrating what a complete and clueless dupe you are...do you? Is it a matter of pride for you or something to that effect?
You grab an idiot chart based on a falsehood from 1990 to the present and think you are showing something important? You really are clueless, aren't you.
Here, have a look at some actual science and then tell me why you believe the sky is falling.
I don't expect that you would have the first idea of what the holocene climate optimum was, but it was between 6,000 and 9,000 years ago. Being considerably warmer than the present, the sea levels were also higher...and imagine, this all happened without the benefit of the internal combustion engine. In fact, sea level studies of the past strongly suggest that this period between 6,000 and 9,000 years ago was about 5 degrees warmer than the present.
During the early to mid Holocene, the average sea level was 2 to 4 METERS higher than the present....back when CO2 levels were 260 to 265ppm. So if you can bear looking at some real science, here is a history of sea level for the past 10,000 years.
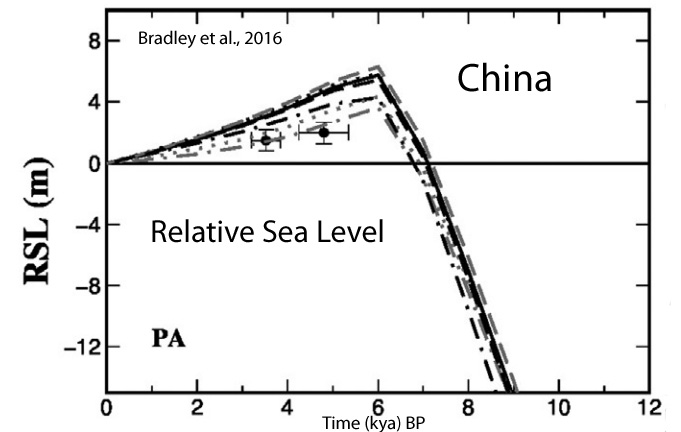
http://journals.sagepub.com/doi/abs/10.1177/0959683617714596?journalCode=hola
“The main conclusion is that the relative sea-level between c. 7000 and 5300 cal. yr BP was in the range of c. 2–4 m a.s.l. [above present mean sea level], with a mean value of c. 3.5 m a.s.l. … Initial glacio-hydro-isostatic models of the Patagonian coast [Argentina] suggested that the shoreline could be characterized by currently raised beaches, which started to form as soon as ice-sheet melting ceased (Clark et al., 1978). A more recent model (Milne and Mitrovica, 2008) predicted that RSLs might have exceeded present by c. 5 m at 6000 cal. yr BP. [T]he altimetric and chronological data of the valleymouth terraces show a highstand between c. 7000 and 6600 cal. yr BP at c. 4 m a.s.l. [4 meters above present mean sea level], followed by a progressive fall to c. 2–2.5 m between 6200 and 5300 cal. yr BP.”
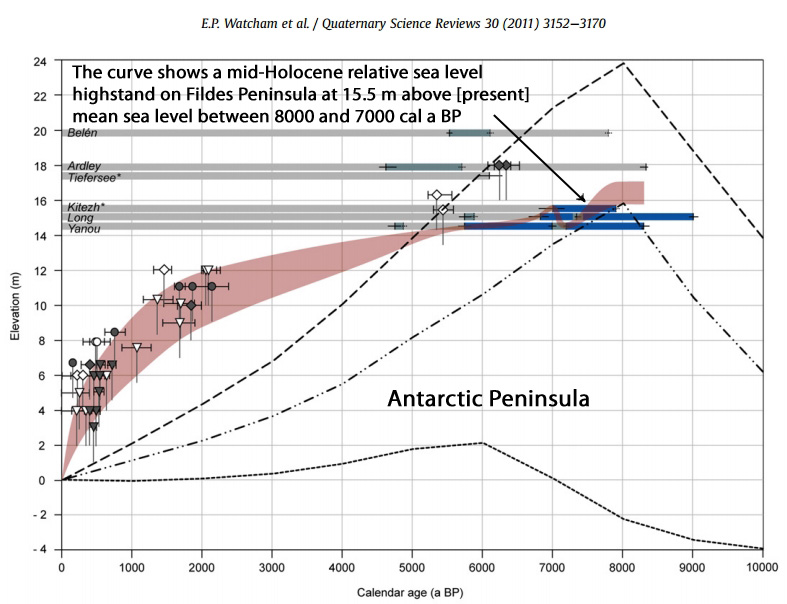
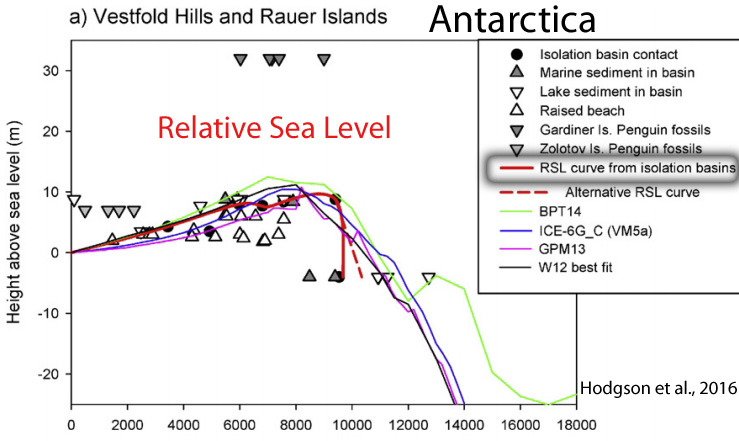
https://www.researchgate.net/public...rve_for_the_South_Shetland_Islands_Antarctica
“The curve shows a mid-Holocene RSL highstand on Fildes Peninsula at 15.5 m above mean sea level between 8000 and 7000 cal a BP.”
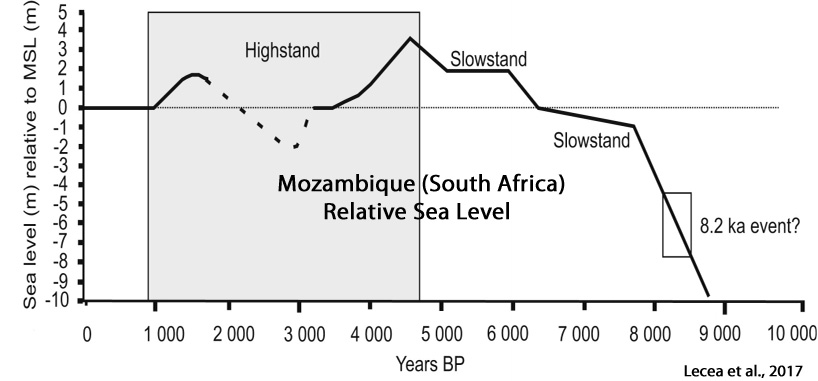
Stepped Holocene sea-level rise and its influence on sedimentation in a large marine embayment: Maputo Bay, Mozambique - ScienceDirect
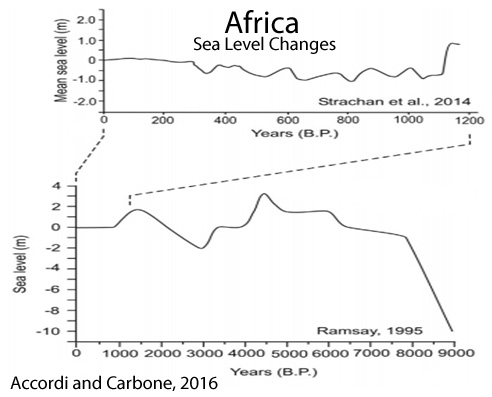
“Ramsay (1995) produced a 9 kyr BP record of sea-level changes from the South African east coast, that showed sea levels reached a high stand of +3.5 m [above present] at 4.65 kyr BP [4,650 years ago]. … In Mozambique, Norström et al., (2012) identified a sea-level highstand ~3 m above present at ~ 6.6 kyr BP.”
Late Pleistocene-Holocene climate and sea level changes inferred based on the tidal terrace sequence, Kachchh, Western India - ScienceDirect
“In the absence of any evidence of land-level changes, the study suggests that at around 6 ka to 3 ka [6,000 to 3,000 years ago], the sea was approximately 2 mhigher than present.”
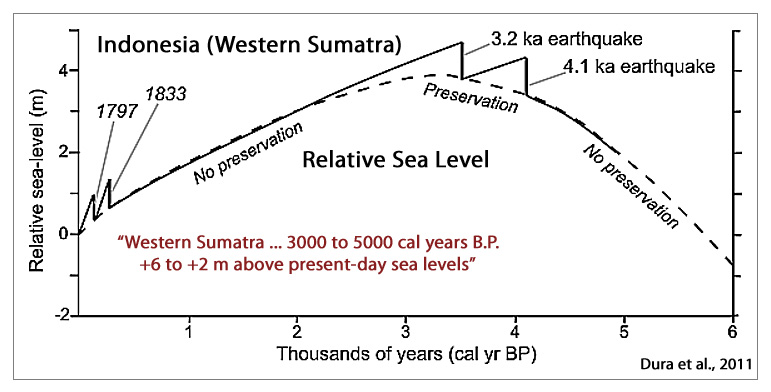
Stratigraphic record of Holocene coseismic subsidence, Padang, West Sumatra
“A prominent feature of southeast Asia Holocene sea level records is the mid-Holocene highstand [Geyh et al., 1979; Tjia, 1996; Scoffin and Le Tissier, 1998; Hanebuth et al., 2000], which in Western Sumatra, varies in timing and magnitude from 3000 to 5000 cal years B.P., and +6 to +2 m above present-day sea levels[Horton et al., 2005].”
Coastal lagoons and beach ridges as complementary sedimentary archives for the reconstruction of Holocene relative sea‐level changes
“The data show a period of RSL [relative sea level] highstand at c. 2.2 m above present MSL [mean sea level] between c. 5.0 and 4.0 ka BP [5,000 to 4,000 years before present].”
Evolution of the siliciclastic-carbonate shelf system of the northern Kenyan coastal belt in response to Late Pleistocene-Holocene relative sea level changes - ScienceDirect
“Then, the skeletal carbonate storage on the shelf reached its maximum 5 to 4 ka BP [5000 to 4000 years before present] (Ramsay, 1995) during a highstand about 3.5 m above the present sea level, when shallow marine accommodation space was greater than at present.”
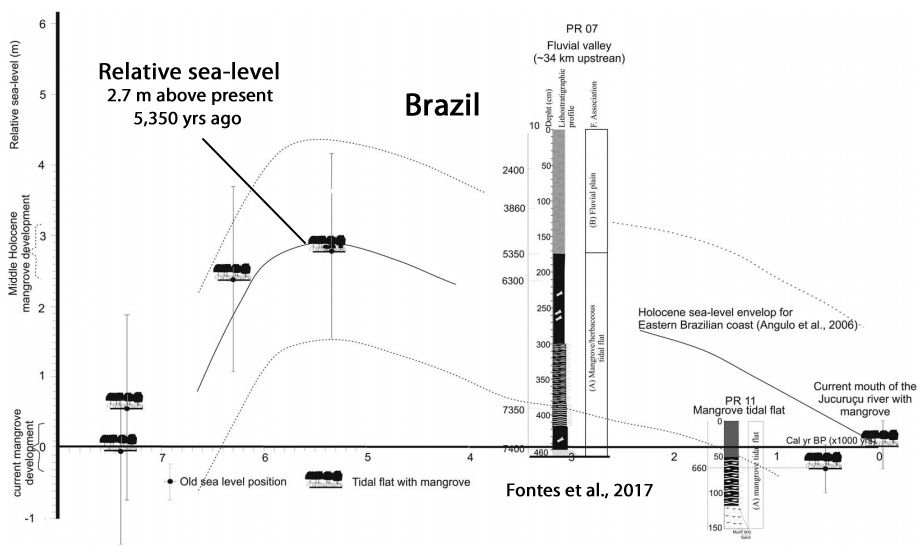
https://www.researchgate.net/public...subtidal_palaeoecosystems_southeastern_Brazil
“The transgressing sea rapidly rose until reaching the ~ +4 m highstand [above present] level around 5000 years BP.”
http://www.sciencedirect.com/science/article/pii/S1367912012005391
“The abundant marine diatoms and mangrove pollens indicate the highest RSL[relative sea level] transgression in Bangladesh at approximately 6000 cal BP, being at least 4.5 to 5 m higher than the modern m.s.l. [mean sea level]. … [T]he present shoreline of Bangladesh was established at approximately 1500 cal BP and has not noticeably migrated inland since.”
https://www.researchgate.net/public...locene_ice-volume_equivalent_sea_level_change
“In general, the data indicate a marked slowdown between 7 and 8 kyr BP, with sea level rising steadily to form a highstand of ~2-4 m [above present sea level] between 6 and 4 kyr BP [6000 and 4000 years before present]. This is followed by a steady fall, reaching present day levels by ~1 kyr BP.”
http://www.sciencedirect.com/science/article/pii/S0921818115301867
“The geological data imply a regional RSL [relative sea level] high stand of c. 8 m [above present levels], which persisted between 9411 cal yr BP and 7564 cal yr BP [calendar years before present].”
https://www.researchgate.net/public...io_de_la_Plata_Argentina_and_Uruguay_A_review
“Analysis of the RSL [relative sea level] database revealed that the RSL [relative sea level] rose to reach the present level at or before c. 7000 cal yr BP, with the peak of the sea-level highstand c. +4 m [above present] between c. 6000 and 5500 cal yr BP [calendar years before present] … This RSL [relative sea level] curve was re-plotted by Gyllencreutz et al. (2010) using the same index points and qualitative approach but using the calibrated ages. It shows rising sea-levels following the Last Glacial Termination (LGT), reaching a RSL [relative sea level] maximum of +6.5 m above present at c. 6500 cal yr BP [calendar years before present], followed by a stepped regressive trend towards the present.”
https://www.cambridge.org/core/jour...rn-brazildiv/715C600616C681F210224F8BB375D047
http://geology.rutgers.edu/images/art3A10.10072Fs40641-016-0041-y.pdf
“RSL [relative sea level] highstand of <1 m (northern Sumatra) and ∼3 m (western Sumatra) between 6 and 3 ka [6,000-3,000 years ago].”
http://www.sciencedirect.com/science/article/pii/S1040618215002165
“The Holocene-high-stand (HHS) inferred from oyster fossils (Saccostrea echinata and Saccostrea malaboensis) is 2.7 m [above present sea level] at ca. 3500 years ago, after which sea level gradually fell to present level.”
http://www.sciencedirect.com/science/article/pii/S0277379115301232
“In North Island locations the early-Holocene sea-level highstand was quite pronounced, with RSL [relative sea level] up to 2.75 m higher than present. In the South Island the onset of highstand conditions was later, with the first attainment of PMSL being between 7000–6400 cal yr BP. In the mid-Holocene the northern North Island experienced the largest sea-level highstand, with RSL up to 3.00 m higher than present.”
And I could go on and on and on...the fact is that most of the past 10,000 years has been considerably warmer than the present and your handwaving hysterics demonstrate nothing more than how thoroughly you have been duped and how unable you are to distinguish between quasi religious pseudoscience and actual science which refutes everything you believe you know about the climate on planet earth.
ScienceRocks
Democrat all the way!
- Banned
- #52
The first mistake you're making is thinking 1 year matters. Look at 2011, 2008 for example.
SSDD
Gold Member
- Nov 6, 2012
- 16,672
- 1,968
- 280
The first mistake you're making is thinking 1 year matters. Look at 2011, 2008 for example.
Your first mistake is not being able to distinguish between what is science, and what is pseudoscience and therefore accepting blatant data manipulation as truth. Again, accepting such bullshit is the hallmark of a top shelf, first class dupe....one who is stupid...a good indication of that is the fact that old rocks thanked you...getting thanks from that old liberal whore is a pretty good indication that you have been a good little useful idiot and passed along blatant bullshit as if it were the truth.
Here goob....I have provided all this data before, but I will gladly do it again....
Luckily, old data is still hanging around to be found to bring the fraud of the climate science modern climate science community into high relief. This is the sea level increase between 1880 and 1980 shown by NASA. The graph shows an increase of just over 3 inches of sea level increase between 1880 and 1980....NOTE the sharp decrease in the rate of increase after 1950.

You can't really scare people with a 3 inch sea level increase over a 100 year period so the frauds in climate science increased the figure to 6 inches per century with nothing more than adjustments.... NOTE the completely FAKE acceleration after 1950.

Here is the original sea level rise chart and the new "improved" chart overlaid on the same time scale...the data manipulation is blatantly obvious...tell me, are you smart enough to detect it?
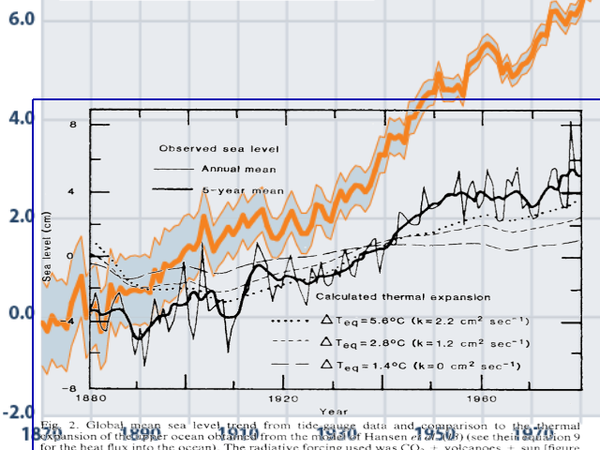
Then in 2004, the University of Colorado showed 2.8 mm per year rate of sea level increase. They used data from Jason and TOPEX satellites.
2.8 mm per year? Not very scary...even to alarmists so again, the data is heavily massaged using inappropriate, and completely fraudulent methods to achieve a 3.3mm per year rate of increase. A global isostatic adjustment was applied which is blatantly fraudulent in the context of sea level increase. Such adjustments are correct in the context of calculating ocean depth as the sea floor sinks and have absolutely no relationship to measuring sea level by satellites. Here is what the adjustments look like...I see you warmers posting this graph as "evidence" of sea level increase all the time...what a laugh....Look familiar?
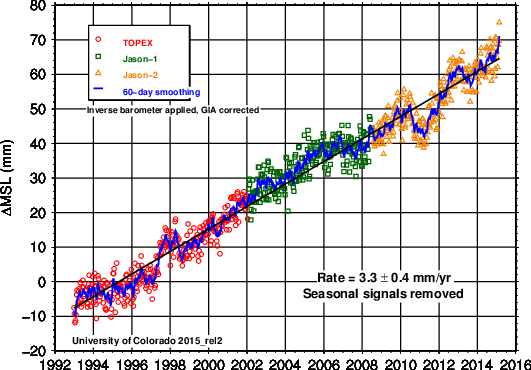
Here is the actual data from the Jason and TOPEX satellites overlaid with the new "improved" heavily and fraudulently manipulated data over the same time scale.
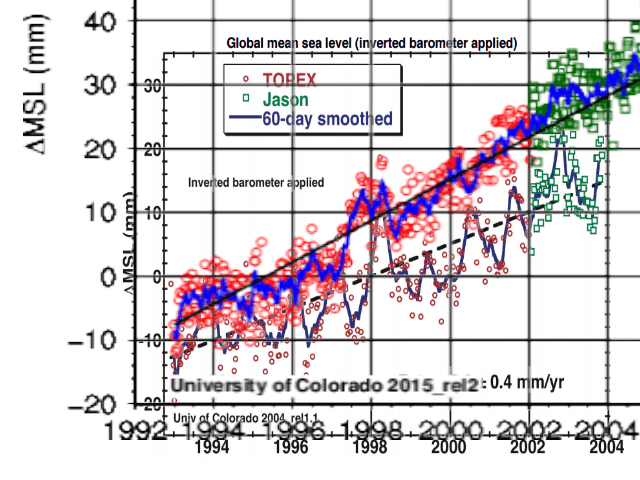
So some numbers got a massage and a picture was painted to give the appearance of imminent disaster. Shit happens...right? But when the "spokes agency" for modern climate science repeats the fraud as truth....we have real evidence of deliberate data corruption with the intent to deceive regarding climate change. In 1990 the IPCC said:
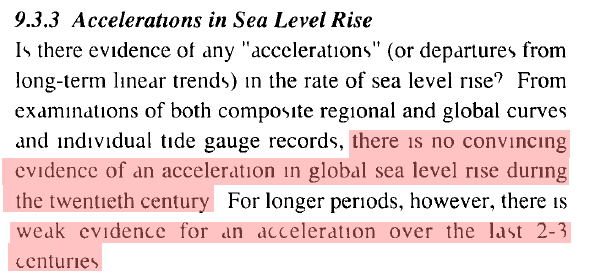
Then in 2013 using blatantly massaged data and obviously fraudulent graphs, the IPCC said exactly the opposite of what they said in 1990. climate science is populated with liars science rocks...to bad you are to stupid to bother to find out...and even more sadly...even after you see the evidence, you are to stupid to alter your position.....the people who altered those graphs are guilty of malfeasance, and deliberate fraud for no other reason than to gain political power. They have damaged the reputation of science so deeply that it will take many many decades after this circus is over to restore the trust in science that you climate wackos have destroyed for political reasons...and people like you simply gobble it up without question and then repeat it every chance you get like good little useful idiots.
Here...since it is clear that despite your screen name, you don't have the first clue when it comes to science, maybe some very simple pictures will penetrate that extremely dense cranium of yours.
Here...the old fort in Saint Augustine florida...note the original sea walls are still there...sea walls that were put in place in between 1692 and 1695...

Here is a photo circa 1950...
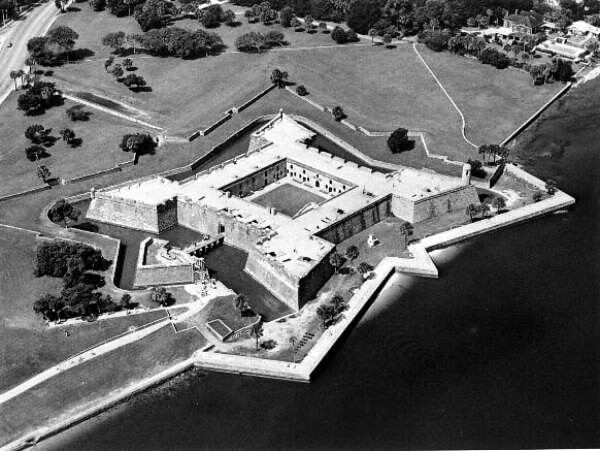
Circa 1933
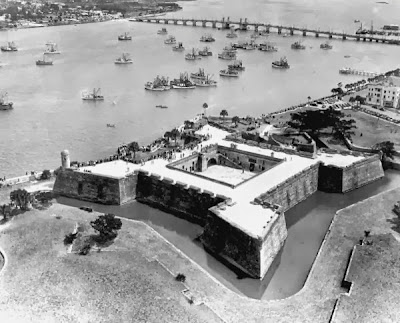
Circa 1902

Such photos exist showing coastal landmarks all over the earth with the same minuscule change over time....so again...where is this catastrophic sea level rise that you and yours claim is happening right now?
skookerasbil
Platinum Member
- Thread starter
- #54
The first mistake you're making is thinking 1 year matters. Look at 2011, 2008 for example.
Your first mistake is not being able to distinguish between what is science, and what is pseudoscience and therefore accepting blatant data manipulation as truth. Again, accepting such bullshit is the hallmark of a top shelf, first class dupe....one who is stupid...a good indication of that is the fact that old rocks thanked you...getting thanks from that old liberal whore is a pretty good indication that you have been a good little useful idiot and passed along blatant bullshit as if it were the truth.
Here goob....I have provided all this data before, but I will gladly do it again....
Luckily, old data is still hanging around to be found to bring the fraud of the climate science modern climate science community into high relief. This is the sea level increase between 1880 and 1980 shown by NASA. The graph shows an increase of just over 3 inches of sea level increase between 1880 and 1980....NOTE the sharp decrease in the rate of increase after 1950.
You can't really scare people with a 3 inch sea level increase over a 100 year period so the frauds in climate science increased the figure to 6 inches per century with nothing more than adjustments.... NOTE the completely FAKE acceleration after 1950.
Here is the original sea level rise chart and the new "improved" chart overlaid on the same time scale...the data manipulation is blatantly obvious...tell me, are you smart enough to detect it?
Then in 2004, the University of Colorado showed 2.8 mm per year rate of sea level increase. They used data from Jason and TOPEX satellites.
2.8 mm per year? Not very scary...even to alarmists so again, the data is heavily massaged using inappropriate, and completely fraudulent methods to achieve a 3.3mm per year rate of increase. A global isostatic adjustment was applied which is blatantly fraudulent in the context of sea level increase. Such adjustments are correct in the context of calculating ocean depth as the sea floor sinks and have absolutely no relationship to measuring sea level by satellites. Here is what the adjustments look like...I see you warmers posting this graph as "evidence" of sea level increase all the time...what a laugh....Look familiar?
Here is the actual data from the Jason and TOPEX satellites overlaid with the new "improved" heavily and fraudulently manipulated data over the same time scale.
So some numbers got a massage and a picture was painted to give the appearance of imminent disaster. Shit happens...right? But when the "spokes agency" for modern climate science repeats the fraud as truth....we have real evidence of deliberate data corruption with the intent to deceive regarding climate change. In 1990 the IPCC said:
Then in 2013 using blatantly massaged data and obviously fraudulent graphs, the IPCC said exactly the opposite of what they said in 1990. climate science is populated with liars science rocks...to bad you are to stupid to bother to find out...and even more sadly...even after you see the evidence, you are to stupid to alter your position.....the people who altered those graphs are guilty of malfeasance, and deliberate fraud for no other reason than to gain political power. They have damaged the reputation of science so deeply that it will take many many decades after this circus is over to restore the trust in science that you climate wackos have destroyed for political reasons...and people like you simply gobble it up without question and then repeat it every chance you get like good little useful idiots.
Here...since it is clear that despite your screen name, you don't have the first clue when it comes to science, maybe some very simple pictures will penetrate that extremely dense cranium of yours.
Here...the old fort in Saint Augustine florida...note the original sea walls are still there...sea walls that were put in place in between 1692 and 1695...
Here is a photo circa 1950...
Circa 1933
Circa 1902
Such photos exist showing coastal landmarks all over the earth with the same minuscule change over time....so again...where is this catastrophic sea level rise that you and yours claim is happening right now?
LMAO SSDD.............the pictures..........I'm laughing..............these alarmists are mental case k00ks. You do a good job here of making them look like total assholes!!

Billy_Bob
Diamond Member
The empirically observed evidence only respects itself... It doesn't care about liars and their agenda...The first mistake you're making is thinking 1 year matters. Look at 2011, 2008 for example.
Your first mistake is not being able to distinguish between what is science, and what is pseudoscience and therefore accepting blatant data manipulation as truth. Again, accepting such bullshit is the hallmark of a top shelf, first class dupe....one who is stupid...a good indication of that is the fact that old rocks thanked you...getting thanks from that old liberal whore is a pretty good indication that you have been a good little useful idiot and passed along blatant bullshit as if it were the truth.
Here goob....I have provided all this data before, but I will gladly do it again....
Luckily, old data is still hanging around to be found to bring the fraud of the climate science modern climate science community into high relief. This is the sea level increase between 1880 and 1980 shown by NASA. The graph shows an increase of just over 3 inches of sea level increase between 1880 and 1980....NOTE the sharp decrease in the rate of increase after 1950.
You can't really scare people with a 3 inch sea level increase over a 100 year period so the frauds in climate science increased the figure to 6 inches per century with nothing more than adjustments.... NOTE the completely FAKE acceleration after 1950.
Here is the original sea level rise chart and the new "improved" chart overlaid on the same time scale...the data manipulation is blatantly obvious...tell me, are you smart enough to detect it?
Then in 2004, the University of Colorado showed 2.8 mm per year rate of sea level increase. They used data from Jason and TOPEX satellites.
2.8 mm per year? Not very scary...even to alarmists so again, the data is heavily massaged using inappropriate, and completely fraudulent methods to achieve a 3.3mm per year rate of increase. A global isostatic adjustment was applied which is blatantly fraudulent in the context of sea level increase. Such adjustments are correct in the context of calculating ocean depth as the sea floor sinks and have absolutely no relationship to measuring sea level by satellites. Here is what the adjustments look like...I see you warmers posting this graph as "evidence" of sea level increase all the time...what a laugh....Look familiar?
Here is the actual data from the Jason and TOPEX satellites overlaid with the new "improved" heavily and fraudulently manipulated data over the same time scale.
So some numbers got a massage and a picture was painted to give the appearance of imminent disaster. Shit happens...right? But when the "spokes agency" for modern climate science repeats the fraud as truth....we have real evidence of deliberate data corruption with the intent to deceive regarding climate change. In 1990 the IPCC said:
Then in 2013 using blatantly massaged data and obviously fraudulent graphs, the IPCC said exactly the opposite of what they said in 1990. climate science is populated with liars science rocks...to bad you are to stupid to bother to find out...and even more sadly...even after you see the evidence, you are to stupid to alter your position.....the people who altered those graphs are guilty of malfeasance, and deliberate fraud for no other reason than to gain political power. They have damaged the reputation of science so deeply that it will take many many decades after this circus is over to restore the trust in science that you climate wackos have destroyed for political reasons...and people like you simply gobble it up without question and then repeat it every chance you get like good little useful idiots.
Here...since it is clear that despite your screen name, you don't have the first clue when it comes to science, maybe some very simple pictures will penetrate that extremely dense cranium of yours.
Here...the old fort in Saint Augustine florida...note the original sea walls are still there...sea walls that were put in place in between 1692 and 1695...
Here is a photo circa 1950...
Circa 1933
Circa 1902
Such photos exist showing coastal landmarks all over the earth with the same minuscule change over time....so again...where is this catastrophic sea level rise that you and yours claim is happening right now?
LMAO SSDD.............the pictures..........I'm laughing..............these alarmists are mental case k00ks. You do a good job here of making them look like total assholes!!
skookerasbil
Platinum Member
- Thread starter
- #56
The empirically observed evidence only respects itself... It doesn't care about liars and their agenda...The first mistake you're making is thinking 1 year matters. Look at 2011, 2008 for example.
Your first mistake is not being able to distinguish between what is science, and what is pseudoscience and therefore accepting blatant data manipulation as truth. Again, accepting such bullshit is the hallmark of a top shelf, first class dupe....one who is stupid...a good indication of that is the fact that old rocks thanked you...getting thanks from that old liberal whore is a pretty good indication that you have been a good little useful idiot and passed along blatant bullshit as if it were the truth.
Here goob....I have provided all this data before, but I will gladly do it again....
Luckily, old data is still hanging around to be found to bring the fraud of the climate science modern climate science community into high relief. This is the sea level increase between 1880 and 1980 shown by NASA. The graph shows an increase of just over 3 inches of sea level increase between 1880 and 1980....NOTE the sharp decrease in the rate of increase after 1950.
You can't really scare people with a 3 inch sea level increase over a 100 year period so the frauds in climate science increased the figure to 6 inches per century with nothing more than adjustments.... NOTE the completely FAKE acceleration after 1950.
Here is the original sea level rise chart and the new "improved" chart overlaid on the same time scale...the data manipulation is blatantly obvious...tell me, are you smart enough to detect it?
Then in 2004, the University of Colorado showed 2.8 mm per year rate of sea level increase. They used data from Jason and TOPEX satellites.
2.8 mm per year? Not very scary...even to alarmists so again, the data is heavily massaged using inappropriate, and completely fraudulent methods to achieve a 3.3mm per year rate of increase. A global isostatic adjustment was applied which is blatantly fraudulent in the context of sea level increase. Such adjustments are correct in the context of calculating ocean depth as the sea floor sinks and have absolutely no relationship to measuring sea level by satellites. Here is what the adjustments look like...I see you warmers posting this graph as "evidence" of sea level increase all the time...what a laugh....Look familiar?
Here is the actual data from the Jason and TOPEX satellites overlaid with the new "improved" heavily and fraudulently manipulated data over the same time scale.
So some numbers got a massage and a picture was painted to give the appearance of imminent disaster. Shit happens...right? But when the "spokes agency" for modern climate science repeats the fraud as truth....we have real evidence of deliberate data corruption with the intent to deceive regarding climate change. In 1990 the IPCC said:
Then in 2013 using blatantly massaged data and obviously fraudulent graphs, the IPCC said exactly the opposite of what they said in 1990. climate science is populated with liars science rocks...to bad you are to stupid to bother to find out...and even more sadly...even after you see the evidence, you are to stupid to alter your position.....the people who altered those graphs are guilty of malfeasance, and deliberate fraud for no other reason than to gain political power. They have damaged the reputation of science so deeply that it will take many many decades after this circus is over to restore the trust in science that you climate wackos have destroyed for political reasons...and people like you simply gobble it up without question and then repeat it every chance you get like good little useful idiots.
Here...since it is clear that despite your screen name, you don't have the first clue when it comes to science, maybe some very simple pictures will penetrate that extremely dense cranium of yours.
Here...the old fort in Saint Augustine florida...note the original sea walls are still there...sea walls that were put in place in between 1692 and 1695...
Here is a photo circa 1950...
Circa 1933
Circa 1902
Such photos exist showing coastal landmarks all over the earth with the same minuscule change over time....so again...where is this catastrophic sea level rise that you and yours claim is happening right now?
LMAO SSDD.............the pictures..........I'm laughing..............these alarmists are mental case k00ks. You do a good job here of making them look like total assholes!!
yep..........always exposes the frauds
/----/ the sea is in constant motion with rip tides, waves and wind. How could anyone pinpoint the sea level with in a fraction of an inch?More bad news for the climate crusader k00ks.........and by the way........are these people the biggest suckers walking the planet or what?
"NASA satellite sea level observations for the past 24 years show that – on average – sea levels have been rising 3.4 millimeters per year. That’s 0.134 inches, about the thickness of a dime and a nickel stacked together, per year."
But when you focus in on 2016 and 2017, you get a different picture..........closeup screen shot of sea levels from Jan 2016 to March 2017. This clearly shows the decline."
https://www.iceagenow.info/sea-levels-are-falling/


They can't. It's pure hokum. You also have to consider the ground is moving as well. Some places rising, some places falling.
mamooth
Diamond Member
Such photos exist showing coastal landmarks all over the earth with the same minuscule change over time
Poor SSDD, not smart enough to understand that his photos are meaningless, due to low resolution, lack of tidal state information, and lack of information on other land changes. But then, that kind of crap is all he has, and he can't be honest, so he has to use the crap.
His graphs? Nobody can ever figure out what he's babbling out. Most of them actually show the accelerating sea level rise. He's just rage-weeping now, tossing out every crazy thing he reads off of some kook website, hoping to bury the issue in a mountain of weepy fraud.
It doesn't work. We just ignore his fraud. The gauges and satellites show accelerating sea level rise. Hence, there is accelerating sea level rise. To deny something that simple and obvious, you have to go full metal conspiracy retard, which is what SSDD is doing.
/----/Such photos exist showing coastal landmarks all over the earth with the same minuscule change over time
Poor SSDD, not smart enough to understand that his photos are meaningless, due to low resolution, lack of tidal state information, and lack of information on other land changes. But then, that kind of crap is all he has, and he can't be honest, so he has to use the crap.
His graphs? Nobody can ever figure out what he's babbling out. Most of them actually show the accelerating sea level rise. He's just rage-weeping now, tossing out every crazy thing he reads off of some kook website, hoping to bury the issue in a mountain of weepy fraud.
It doesn't work. We just ignore his fraud. The gauges and satellites show accelerating sea level rise. Hence, there is accelerating sea level rise. To deny something that simple and obvious, you have to go full metal conspiracy retard, which is what SSDD is doing.
skookerasbil
Platinum Member
- Thread starter
- #60
still falling btw
Similar threads
- Replies
- 42
- Views
- 2K
- Replies
- 37
- Views
- 787
- Replies
- 49
- Views
- 1K
- Replies
- 229
- Views
- 6K
New Topics
-

-
 Zone1 Was Jesus The Long-Awaited Messiah? 9 Subtle Clues
- Started by Votto
- Replies: 2
-

-
Bill Gates Brought Before Congress To Answer For Epstein, Windows Vista
- Started by Votto
- Replies: 2
-
