March was the 349th straight month with global avg temps over 20th century average

Last post was EXCELLENT of the propaganda on this topic.
Actually fecalhead, your posts on this topic are the "excellent examples of propaganda", and complete befuddlement.

Other people post scientific facts from peer reviewed science journals and you post pseudo-scientific drivel and misinformation from denier cult blogs sponsored by the fossil fuel industry.

You're a liar and a fraud and very possibly a paid troll.


It is a FACT, that measured surface temperatures have been relatively flat and stagnant for 15+ years. But there's so much "spin" and dancing on the topic that TinkerBelle can find all that DENIER education up there.
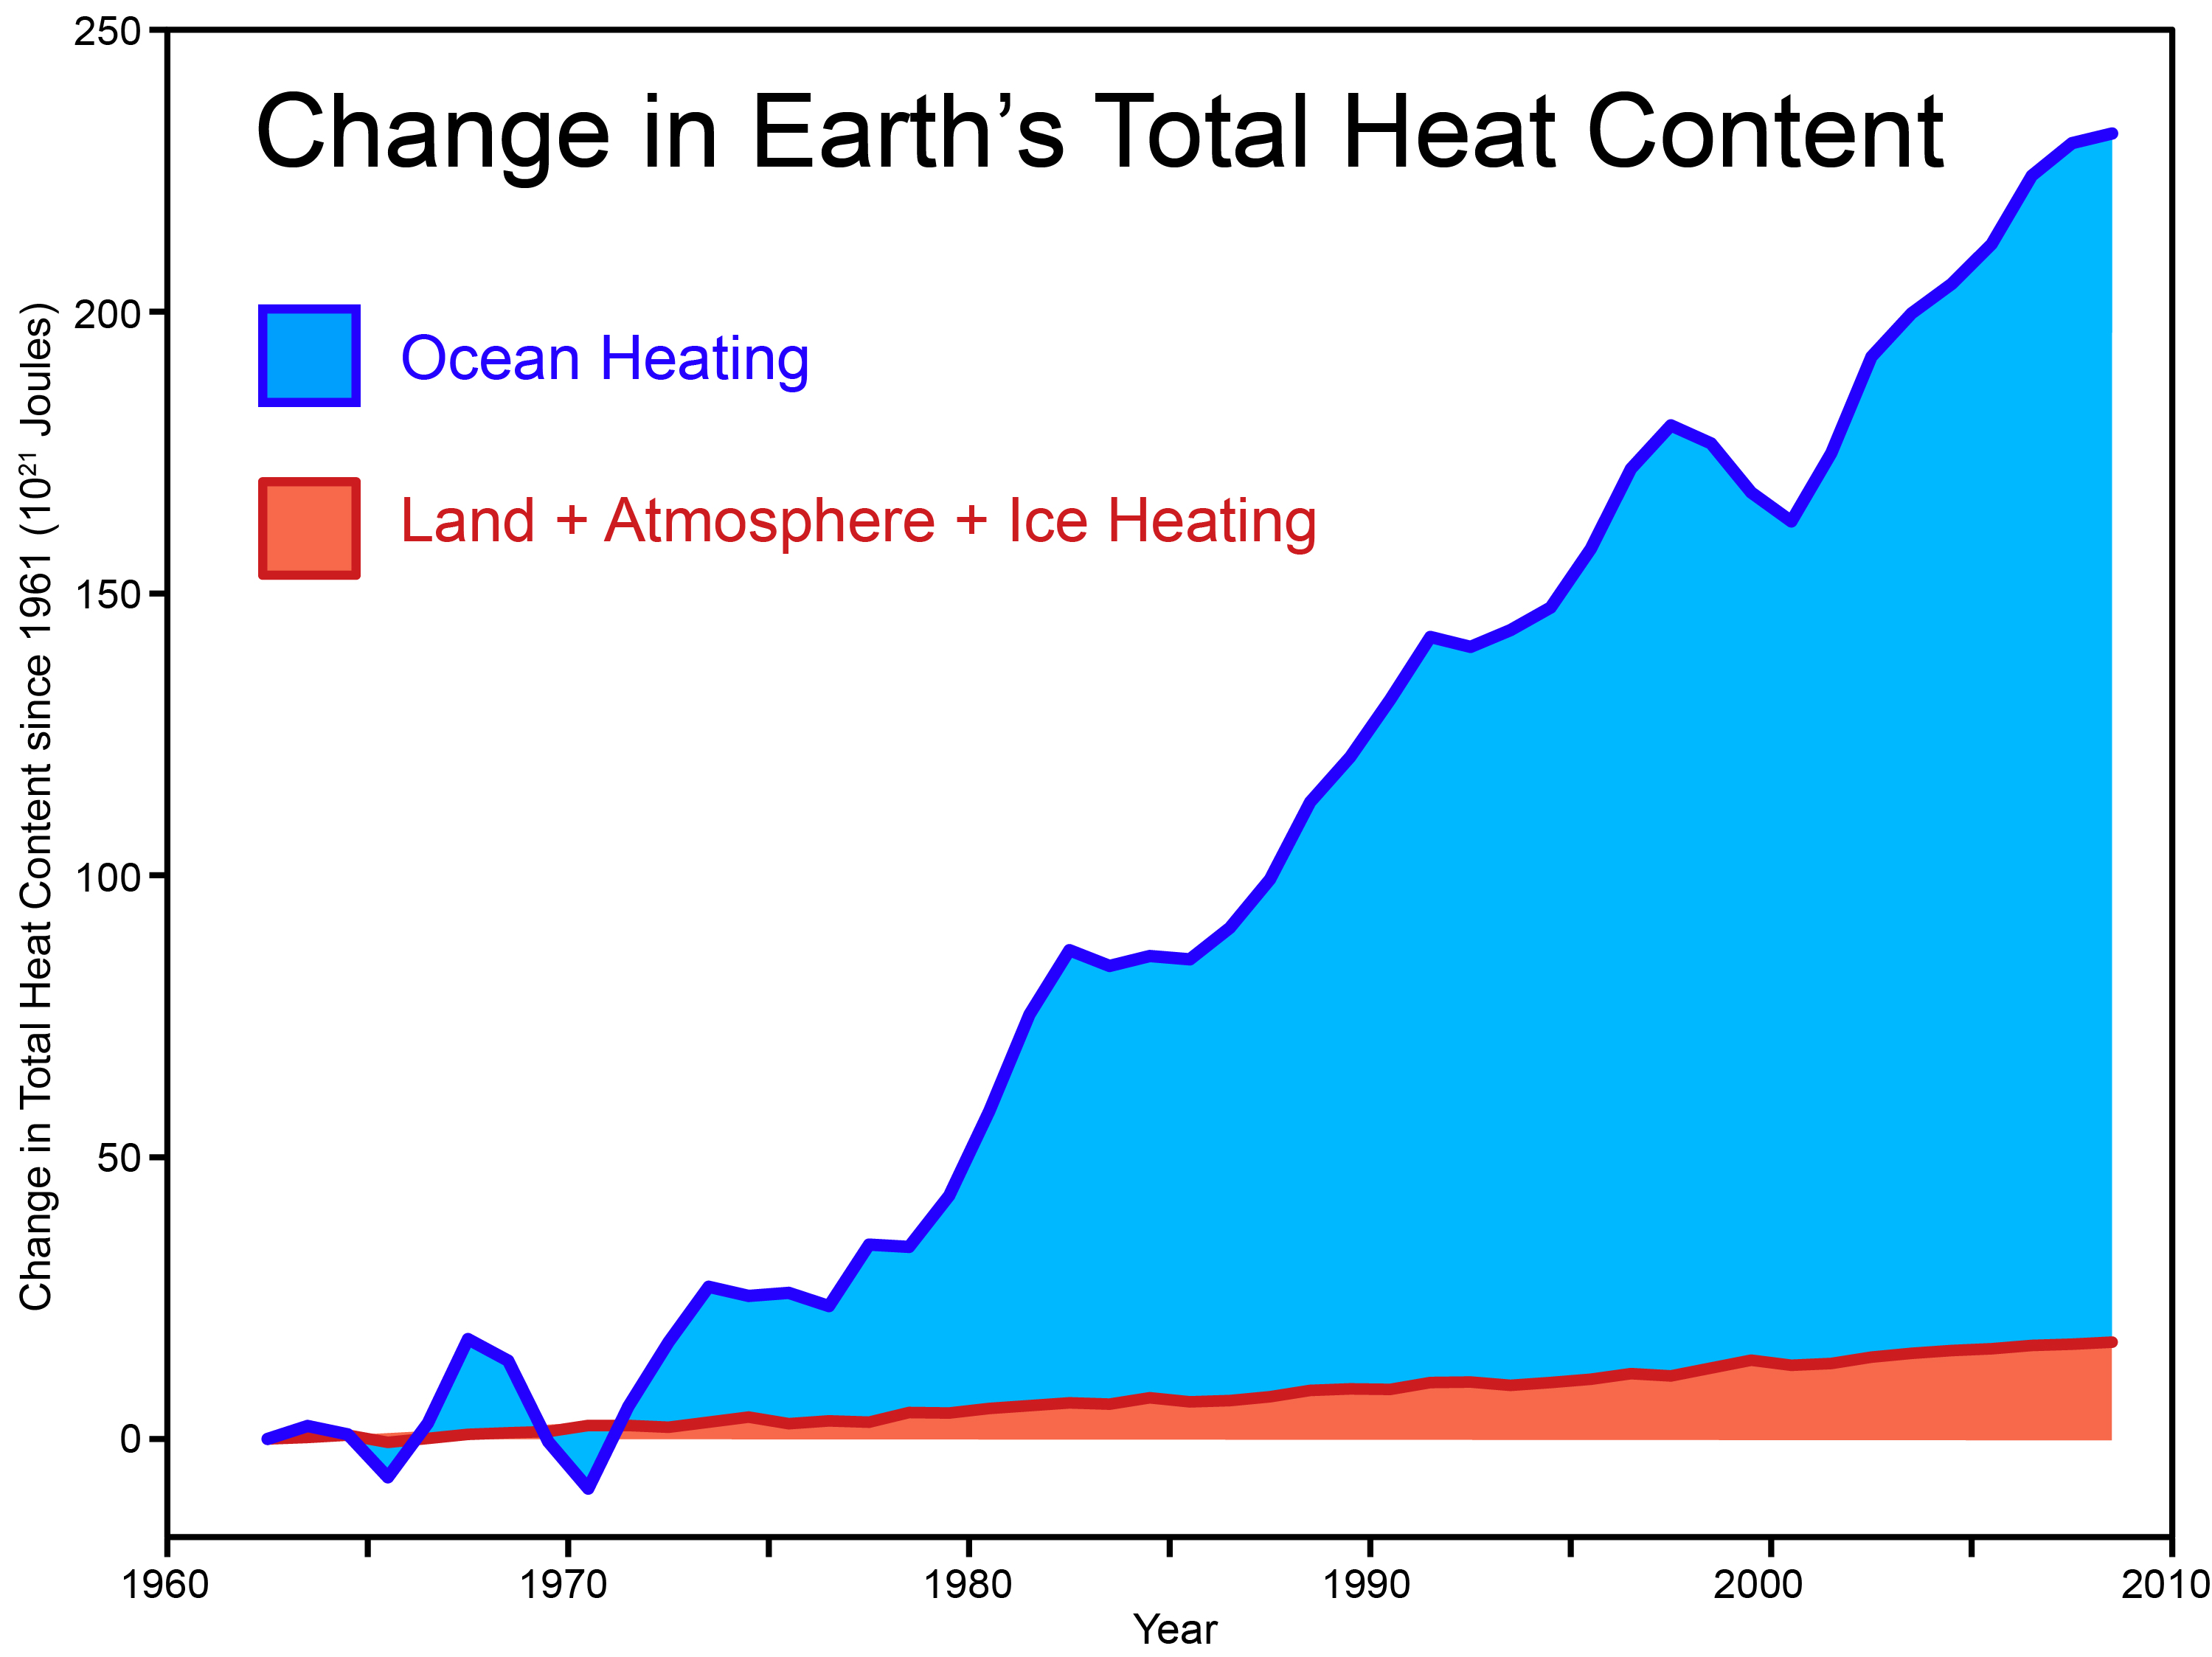
Wrong again! That's not a "FACT", bozo, that's a denier cult myth at this point. The Earth has been steadily warming, as the facts I cited demonstrate. Most of the extra heat energy, over 90%, has been going into the oceans and the warming has now penetrated much deeper into the ocean depths. There was a notion among some scientists, at one point several years ago, that the rapid rise in surface air temperatures observed in the 1980s and 90s had slowed down but that impression turned out to be based on the lack of temperature records for the Arctic in the HadCRUT data set. The Arctic was in fact warming much faster than the rest of the planet so when the satellite temperature records of the changes in Arctic temperatures was integrated into the other ground based temperature records, there turned out to be no real pause at all. At the most you could say, as one of the top climate scientists, Stefan Rahmstorf, commented, “The warming trend is somewhat reduced, but within the usual range of variation”. It may not have been reduced at all, taking into account the new studies of Arctic warming. And of course, he's referring to just the warming trend in surface air temperatures. The warming trend in the oceans has clearly accelerated. The planet as a whole (from about ten feet below the solid surface and several thousand feet below the ocean surface to very high up in the atmosphere) has been warming at an increasing rate.


You are being lied to..
And there's that retarded insanity again.....

You would rather moronically believe that virtually the entire world scientific community, including almost all of the actual climate scientists, are all lying to us about their scientific research and data for unfathomable reasons known only to the denier cult 'masterminds', rather than recognize that the non-scientist propagandists working for the fossil fuel industry are lying to you. The fossil fuel industry has enormous economic motivation to lie and spin and smear honest scientists. When the world gets it together to properly tax carbon emissions, the current trillion dollar a year profit stream from producing, refining, transporting and selling oil, coal, and natural gas will dry up, and the stock prices in the FFI will drop into the toilet when their leases on oil, coal and gas deposits become worthless.


There are no complete and vetted excuses for the lack of significant increases in surface temperatures BECAUSE the models do not include sufficient components of the climate system. OBVIOUSLY, if this was settled, the models would tell you how long this pause will last.. They don't.
Wrong. Just denier cult propaganda and misinformation. There has been no "lack of significant increases in surface temperatures". You tell lies and then base more lies on your first lies. "They don't tell you how long this pause will last" because there was no pause. The Earth has continued to warm up at about the same rate as it was before the turn of the century. 2015 will very probably be the new next hottest year on record, and 2010 will move into second place.


This link for instance --- Global warming since 1997 more than twice as fast as previously estimated, new study shows.. --- is an example of the dishonest methods they will go to in order to get some media to give the public the IMPRESSION that global warming TODAY is greater than it was in the 90s.
The warming today IS greater than it was in the 90s. Your delusional denial of the facts doesn't change them.


The referenced study....
....is sound peer-reviewed published science that blows away some of your precious denier cult myths so of course you have to deny it.
 
The oceans didn't start munching on the warming in the 1990s.. Not according to the data (real or imagined).. So all you have is excuses that haven't gotten traction.. The SURFACE TEMPERATURES have virtually stalled. According to BTK Ocean Warming study, the RATE of heat absorption has been fairly constant for several decades. So --- where is the impact on the surface temperatures in the 60s and 80s?? Doesn't explain the pause.

Just like they did in 70s Matthew.. That's correct.. But rather than GUESS at why those pauses occur, we really should be accepting at this point that CO2 plays a ROLE, but is a cheap and incomplete explanation of the thermal distribution and equilibrium of the planet.. Too much "easy" science and not enough time spent looking at how heat MOVES, and gets STORED, and the delays involved to reach new balance points..
 
The oceans didn't start munching on the warming in the 1990s..

Nope, sure didn't.

Total_Heat_Content_2011.jpg
 
The oceans didn't start munching on the warming in the 1990s..

Nope, sure didn't.

Total_Heat_Content_2011.jpg


Can't help you if you can't read a graph and understand that the STORAGE RATE of the Oceans hasn't substantially changed since the early 70s. Or what that means. I do do Algebra 2 and Calculus tutoring on the side for cheap tho... Biggest DIP in that chart (that isn't real because it's from skepticalscience) occurs RIGHT AFTER the pause began.. WHICH MEANS for those who never made it to Alg 1 -- The ocean GAVE UP HEAT in the early 2000's .... SImple minds love skepticalscience and global warming excuses..

Why don't you THINK before you post that again and claim that the Ocean started to eat the heat around 1998 and that's why the surface temps stalled. IT's been munching the EXACT SAME DIET of heat since that graph took off..

IN FACT --- if you believe all those crayon jobs at skepticalscience (and what warmer zealot doesn't?) -- it APPEARS the ocean SLOWED DOWN and went on a diet about 2009.. Those fakes don't care much for data sets.. The LEAD DUDE there was a CARTOONIST --- that's why their shit looks so colorful and convincing...


here is one of those reconstructions that the warmists love. from last year

rosenthal-2013-figure-2c-annotated.png


so the ocean has been warmer than today for 95% of the interglacial. hmmm.....
 
Research which heaped doubt on the rate of global warming was deliberately suppressed by scientists because it was “less than helpful” to their cause, it was claimed last night.
In an echo of the infamous “Climategate” scandal at the University of East Anglia, one of the world’s top academic journals rejected the work of five experts after a reviewer privately denounced it as “harmful”.
Scientists in cover-up of ?damaging? climate view | The Times
 
The pause is the single most damaging event in science of the past 400 years. egg all over our face.


what a bizarre statement. it sounds like you are blaming the data rather than the small subset of climate scientists who hijacked this area and turned the null hypothesis on its head. if you are going to blame the climate for anything perhaps you should focus on the late 80's til the 98 el nino that accidentally corroborated the doomsday scenario put forth by Hansen.
 
The pause is the single most damaging event in science of the past 400 years. egg all over our face.

Don't know about taking inconvienient measurements in science PERSONALLY.. And viewing data sets as damaging. Scientists have nothing to worry about unless they misrepresented the certainty of their projections on purpose. :eek:
 
Nope, sure didn't.

Total_Heat_Content_2011.jpg


Can't help you if you can't read a graph and understand that the STORAGE RATE of the Oceans hasn't substantially changed since the early 70s. Or what that means. I do do Algebra 2 and Calculus tutoring on the side for cheap tho... Biggest DIP in that chart (that isn't real because it's from skepticalscience) occurs RIGHT AFTER the pause began.. WHICH MEANS for those who never made it to Alg 1 -- The ocean GAVE UP HEAT in the early 2000's .... SImple minds love skepticalscience and global warming excuses..

Why don't you THINK before you post that again and claim that the Ocean started to eat the heat around 1998 and that's why the surface temps stalled. IT's been munching the EXACT SAME DIET of heat since that graph took off..

IN FACT --- if you believe all those crayon jobs at skepticalscience (and what warmer zealot doesn't?) -- it APPEARS the ocean SLOWED DOWN and went on a diet about 2009.. Those fakes don't care much for data sets.. The LEAD DUDE there was a CARTOONIST --- that's why their shit looks so colorful and convincing...


here is one of those reconstructions that the warmists love. from last year

rosenthal-2013-figure-2c-annotated.png


so the ocean has been warmer than today for 95% of the interglacial. hmmm.....

So many individual proxy surveys of ocean sediment confirm that. When a heatsink cools off, it's ability to absorb heat from a relatively stable atmos increases - as the thermal difference. So I imagine that could explain the BTK type graphs that seem to kick in around 1960.. SOMEDAY -- they'll be serious study about vitals like this..
 
The oceans didn't start munching on the warming in the 1990s..

Nope, sure didn't.

Total_Heat_Content_2011.jpg
Can't help you if you can't read a graph and understand that the STORAGE RATE of the Oceans hasn't substantially changed since the early 70s. Or what that means. I do do Algebra 2 and Calculus tutoring on the side for cheap tho... Biggest DIP in that chart (that isn't real because it's from skepticalscience) occurs RIGHT AFTER the pause began.. WHICH MEANS for those who never made it to Alg 1 -- The ocean GAVE UP HEAT in the early 2000's .... SImple minds love skepticalscience and global warming excuses..

Why don't you THINK before you post that again and claim that the Ocean started to eat the heat around 1998 and that's why the surface temps stalled. IT's been munching the EXACT SAME DIET of heat since that graph took off..

IN FACT --- if you believe all those crayon jobs at skepticalscience (and what warmer zealot doesn't?) -- it APPEARS the ocean SLOWED DOWN and went on a diet about 2009.. Those fakes don't care much for data sets.. The LEAD DUDE there was a CARTOONIST --- that's why their shit looks so colorful and convincing...

Nobody can help you, fecalhead, 'cause you are a retard. Also anybody who can look at that chart like you seem to, and not see the enormous growth in ocean heat content, is clearly insane.

That chart is a little crude for any kind of detailed analysis. It was mostly intended to show the large difference between the mount of heat the oceans are absorbing compared to how much heat is going into warming the atmosphere and land surfaces and to melt the ice.

Here's a more detailed graph that shows more clearly the acceleration of ocean warming in the 1970s after a flattening in the 50s and 60s.

ocean-heat-download1-2013.png
 
Nope, sure didn't.
Can't help you if you can't read a graph and understand that the STORAGE RATE of the Oceans hasn't substantially changed since the early 70s. Or what that means. I do do Algebra 2 and Calculus tutoring on the side for cheap tho... Biggest DIP in that chart (that isn't real because it's from skepticalscience) occurs RIGHT AFTER the pause began.. WHICH MEANS for those who never made it to Alg 1 -- The ocean GAVE UP HEAT in the early 2000's .... SImple minds love skepticalscience and global warming excuses..

Why don't you THINK before you post that again and claim that the Ocean started to eat the heat around 1998 and that's why the surface temps stalled. IT's been munching the EXACT SAME DIET of heat since that graph took off..

IN FACT --- if you believe all those crayon jobs at skepticalscience (and what warmer zealot doesn't?) -- it APPEARS the ocean SLOWED DOWN and went on a diet about 2009.. Those fakes don't care much for data sets.. The LEAD DUDE there was a CARTOONIST --- that's why their shit looks so colorful and convincing...

Nobody can help you, fecalhead, 'cause you are a retard. Also anybody who can look at that chart like you seem to, and not see the enormous growth in ocean heat content, is clearly insane.

That chart is a little crude for any kind of detailed analysis. It was mostly intended to show the large difference between the mount of heat the oceans are absorbing compared to how much heat is going into warming the atmosphere and land surfaces and to melt the ice.

Here's a more detailed graph that shows more clearly the acceleration of ocean warming in the 1970s after a flattening in the 50s and 60s.

ocean-heat-download1-2013.png


Let's determine who the retard here is shall we TinkerBelle? One question at a time, so you can primp and sprinkle fairy dust in between..

Q #1 -- On those Ocean Heating charts (lets shitcan that skepticalscience POS and use your new ones) -- has the RATE of storage changed considerably since the early 1970s?

(primp, sprinkle, primp)

Q#2 -- For MOST of the decade from 2000 to 2010, was the ocean storing MORE or LESS heat per year than the avg rate of that chart from 1970 to the end?

(primp, sprinkle, primp)

Q #3 -- If the RATE of storage hasn't appreciably changed over 40 years and ARGUABLY has DECREASED SOMEWHAT during the pause in surface temps -- How in HELL does that chart explain ANYTHING about the pause in surface temps ???

I repeat -- you haven't a clue how that chart relates to explaining a pause in surface temps from 2000 to present.. But take a whack at the questions anyway -- to prove you are not the retard..
 
BTW -- This whole thread is a pile. Feb and Mar temp. anomalies over the satellite era were 0.17degC. April was 0.19degC ((Satellite Globals)) Those are far and away some of the lowest in 20 years. Any convienient Weather Weirding that happens at those anomalies is a figment of the religous faithfuls' imagination..

Far cry from the 0.3 type peaks we saw since the 70s..
 
Poor SSDD's pseudoscience is so loony, even the mainstream deniers don't want anything to do with it. These days, he's usually jabbering the kookery of the Sky Dragons from Principia Scientific International, a splitoff denier group so wacky that they've been banned from WUWT. Given the degree of craziness that WUWT embraces, getting banned there takes supersized insanity, stuff at the level of the "There's no such thing as backradiation!" conspiracy theories.

And yet, every time you try to argue with me, you end up looking like the bitter old idiot that you are.

And feel free to show any observed, measured back radiation at ambient temperature. Want to try and claim that FLIR is looking at back radiation again?
 

Forum List

Back
Top