CO2 is a greenhouse gas that absorbs heat energy that is trying to leave Earth and keeps it inside the atmosphere. That's established physics, CrazyFruitcake, and none of your dimwitted denial will change that.
Actually it isn't. It is a failed hypothesis. Damned near 20 years of no warming in spite of increasing atmospheric CO2
Actually it is. Actually you're an ignorant retard. That CO2 is a heat absorbing greenhouse gas is an established scientific fact, backed by the laws of physics and over a century of observations. The fact that you're in denial about this just highlights your severe retardation.
"
20 years of no warming".....LOLOLOL.....you're not just retarded but 'actually' insane.....
In the real world, here are some examples of the undeniable warming trend that is changing the Earth's climate patterns.
* This last January, 2014, was the 4th warmest January on record and this last March was the 4th warmest March on record.
* April, 2014, was the 2nd warmest April on record.
* Last November, 2013, was THE warmest November on record going back to at least 1880.
* January was the ninth consecutive month (since May 2013) with a global monthly temperature among the 10 highest for its respective month in the entire temperature record. January and March were both among the 5 highest.
* January was the 38th consecutive January with global average temperatures above the entire twentieth century average for January.
* January was the 347th consecutive month (almost 29 years) with average temperatures above the 20th century global average temperature for all Januarys. The most recent month analyzed so far, April, was the 350th straight month with global average temperatures higher than the 20th century average for that month.
* 2013 was the 4th warmest year on record.
* 2010 is tied with 2005 as the warmest years on record.
* 2001 to 2010 was the warmest decade on record.
* All of the warmest years on record, going back to at least 1880, have happened since 1998.
* All of the coldest years since 1998 are still warmer than all of the hottest years before 1998.
* The Arctic ice cap is still rapidly melting away.
* Large areas of the northern permafrost are still rapidly melting.
* Greenland and Antarctica are still losing ice mass at increasing rates.
* The large majority of mountain glaciers are still rapidly melting and disappearing.
* Sea levels are still rising at an accelerating rate.
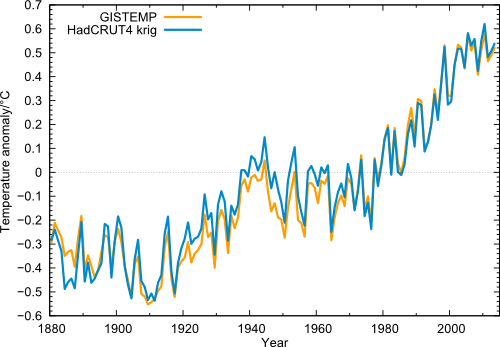
GLOBALLY, this shows the rising surface air temperatures.
Global temperature (annual values) in the data from NASA GISS (orange) and from Cowtan & Way (blue), i.e. HadCRUT4 with interpolated data gaps.
One can clearly see the extreme year 1998, which (thanks to the record-El Niño) stands out above the long-term trend like no other year. But even taking this outlier year as starting point, the linear trend 1998-2013 in all four data sets is positive. Also clearly visible is 2010 as the warmest year since records began, and the minima in the years 2008 and 2011/2012. But just like the peaks are getting higher, these minima are less and less deep. (source:
RealClimate)
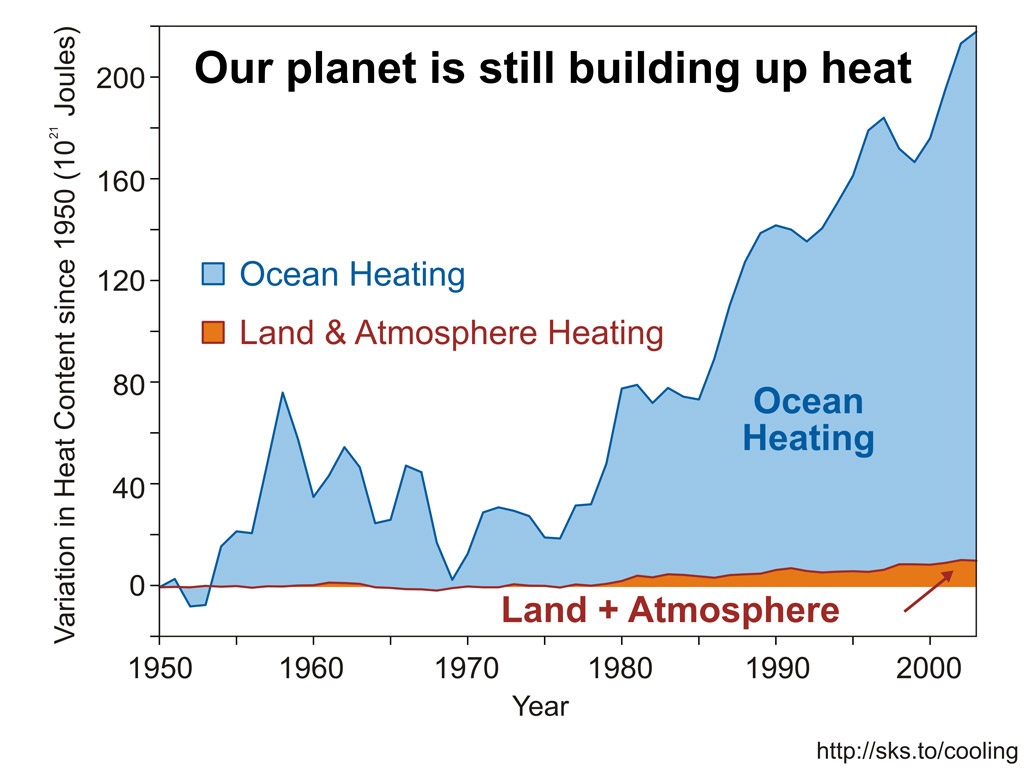
And this shows the even faster rising ocean temperatures.