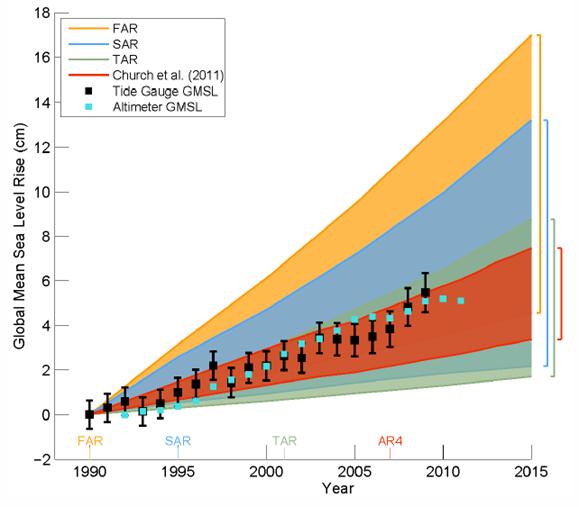
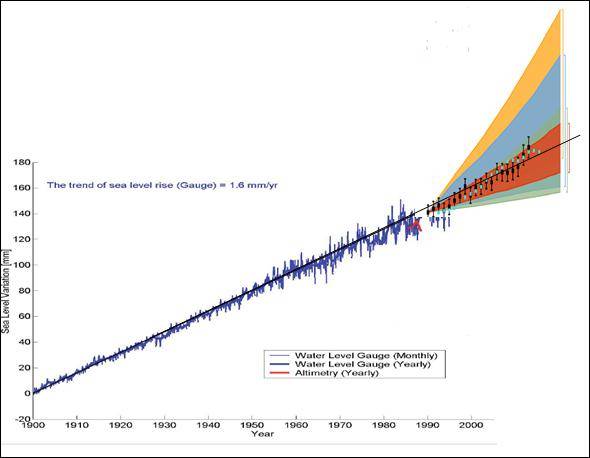
IPCC Sea Level Rise Estimates

PS: there are higher resolution versions of Elektra Records' logo available.

Elektra_Records_logo_2013.jpg

So what, you really are an idiot.

abraHAM ignores the facts yet is obsessed with the tiniest of details.

Okay, abraHAM, I will play with you.

Higher resolution versions of the Elektra Record's logo never appeared on vinyl records. Way before your time abraHAM they used printing presses to make labels, hence what you see as poor resolution is in fact an accurate representation of the historical Elektra Logo.

abraHAM, you lose again, try another cheap shot except this time quit sitting on your brain.

images
 
Last edited:
image004.jpg


image006.jpg


image008.jpg


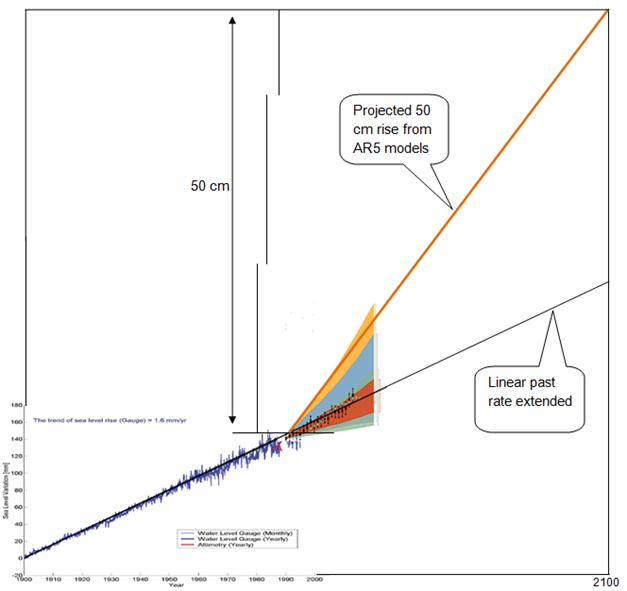
doomsday articles are always talking about a one meter rise by 2100, sometimes two meters or even six. here is the graphic representation of just half a meter. even that seems unlikely doesnt it? can you mentally plot the steepness of the lines for 1, 2 or 6 meter increases?

for crick
 
Thread summary: Deniers say all the data is a socialist conspiracy. And fail hard at understanding something as simple as acceleration.

This thread is a good example of why the whole planet considers deniers to be loopy conspiracy cultists.
 
image004.jpg


image006.jpg


image008.jpg


doomsday articles are always talking about a one meter rise by 2100, sometimes two meters or even six. here is the graphic representation of just half a meter. even that seems unlikely doesnt it? can you mentally plot the steepness of the lines for 1, 2 or 6 meter increases?

for crick


We need to place it in a little better context...(IMHO)

Models vs Reality - The Skeptics Case.JPG
 
Thread summary: Deniers say all the data is a socialist conspiracy. And fail hard at understanding something as simple as acceleration.

This thread is a good example of why the whole planet considers deniers to be loopy conspiracy cultists.
dude, dudette whatever you are, you will never understand your opposition. Give it up already, we laugh everyday at your posts. See to me the definition of acceleration is zero to 60 in four seconds. Now that's fnnn acceleration!!! Too bad you have never proven your use of the word.
 
jc, you're whining too loud for anyone to understand a word you say. Dogs are howling in pain from your high-frequency hysterics. And reposting a debunked fudged graph just makes you look like a pathological liar.
 
jc, you're whining too loud for anyone to understand a word you say. Dogs are howling in pain from your high-frequency hysterics. And reposting a debunked fudged graph just makes you look like a pathological liar.

Idiot....satellite altimetry is accurate to +/- 13mm....your priests are reporting sea level based on satellite altimetry to the nearest 1/100th of a mm....Here is a two part question...what is the margin of error and how stupid do you have to be to believe the reports?
I think calling him stoopid is a compliment!!!

Edit: oh BTW, I really enjoy getting under their skin. The reaction is so uplifting. It makes me want to do it more. hahhaahahhahhahhhahahahaha....
 
Last edited:
jc, you're whining too loud for anyone to understand a word you say. Dogs are howling in pain from your high-frequency hysterics. And reposting a debunked fudged graph just makes you look like a pathological liar.
I think you're referencing the wrong person there fido!!!! I've not posted a graph, so unless you can point to the one you're referencing, you're just again exposing that you are truly moronic.
 
much as I like the new USMB way of dealing with quotes, sometimes the important stuff gets left out

image008.jpg


this is the important graph. it shows how steep the curve is for only a 0.5 metre increase. double that for 1.0 metre increase. plus, we are already 15 years into this century's increase. the accelerating trend need to get us to one metre by 2100 would carry out to 100 or a 1000 metre increase by 2200.

does this seem plausible to anyone? why didnt the SLR jump 1,2 or 10 metres during the medieval or Roman warm periods?
 
Nice job of endpoint selection and scaling, Ian.

Here's the original. Doesn't look so crazy, does it. And this goes to a full meter.

WGI_AR5_Fig13-27.jpg
 
Nice job of endpoint selection and scaling, Ian.

Here's the original. Doesn't look so crazy, does it. And this goes to a full meter.

WGI_AR5_Fig13-27.jpg

Funny you should complain about such things since your graphs seem to be showing smaller and smaller bits of time in your effort to support the hoax.
 
You've already tried that lie before and it doesn't work any better here. Ian's plots show 1900 to 2100. Mine - the IPCC's actual chart - shows 1700. to 2100. Ian's plot's scaling and his elimination of the almost constant sea level in the more distant past made the prediction look steeper. So where the fuck do you get that my charts are "showing smaller and smaller bits of time"?

You are such a stupid ass.


You got nothing but lies...

Holgate_update_fig2.JPG


Decreasing rate of sea level rise....your cartoon is a joke.
 
Now whose the one showing smaller and smaller bits of time? Besides which, your plot is dated. Here's the latest and a link you can use when you actually want to see the latest.

sl_ns_global.png


2014 rel4 Global Mean Sea Level Time Series seasonal signals removed CU Sea Level Research Group


Yours...it doesn't show any time...it only shows computer model projections...mine is of actual measurement and goes to the present...models aren't real and therefore don't really show anything real. That's part of your problem..you are unable to separate reality from model output...
 
And those plots, from what are probably the best sea level experts on the planet, indicate the rate of increase is 3.2 mm/year. Your older one said 3.1 mm/yr. So where the heck did Ian get his 1.4 mm/year? You should chide him on that. Payback for all that cooly reasoned refutation he embarrassed you with over your thermodynamic fantasies.
 
Now whose the one showing smaller and smaller bits of time? Besides which, your plot is dated. Here's the latest and a link you can use when you actually want to see the latest.

sl_ns_global.png


2014 rel4 Global Mean Sea Level Time Series seasonal signals removed CU Sea Level Research Group


Yours...it doesn't show any time...it only shows computer model projections...mine is of actual measurement and goes to the present...models aren't real and therefore don't really show anything real. That's part of your problem..you are unable to separate reality from model output...

So I guess it's you that can't read a plot.
 

Forum List

Back
Top