LeftofLeft
Diamond Member
- Oct 18, 2011
- 29,442
- 20,320
- 1,405
Follow along with the video below to see how to install our site as a web app on your home screen.
Note: This feature may not be available in some browsers.

Most, not All, are wearing masks. Definitely not social distancing. How many pics do you need? Google images is full of them.
View attachment 463951
Most, not All, are wearing masks. Definitely not social distancing. How many pics do you need? Google images is full of them.
If you're going to post pictures of BLM protesters potentially spreading the coronavirus, stick to the USA
BLM protest leader demands talks with UK PM – DW – 06/20/2020
Large crowds have turned out in several British cities to protest against racism and police violence. Activists are demanding the country faces up to its own history of slave trading, colonialism and inequality.www.dw.com
Hundreds of people joined Black Lives Matter protests across Britain on Saturday, marking the fourth weekend of anti-racism demonstrations in a row.
Large rallies were underway in Glasgow, Birmingham, Manchester, Edinburgh and the capital, London, where activists gathered in Hyde Park.
11 people? That qualify as "SUPER SPREADER EVENTS"???????????????Your "study" failed to connect a single person who attended a Trump event to a single case of Covid.
Please try again.Dozens Of Secret Service Agents Get COVID During Trump's Travels - KFF Health News
As Donald Trump and Mike Pence continue to travel for campaign rallies during the pandemic, the Secret Service agents assigned to protect them have been exposed to the coronavirus. The Washington Post reveals previously unreported cases.khn.org
As Donald Trump and Mike Pence continue to travel for campaign rallies during the pandemic, the Secret Service agents assigned to protect them have been exposed to the coronavirus. The Washington Post reveals previously unreported cases.
Five agents helping plan security for the president’s late July rally in Tampa
And in Tulsa in June, six advance staff and two Secret Service agents contracted the virus
Actually many did including Florida.Other States also didn't ship covid patients into retirement homes like New York did.
Well, no one could make that up.
Wait, you just did ..."Also last week, he announced a Jacksonville nursing home that hadn’t opened yet would take COVID-19 patients who can’t be isolated in their current facilities.
State missteps failed frail in Florida’s nursing homes
As coronavirus deaths increased exponentially in elder care centers, Gov. Ron DeSantis took a victory lap. Along with...www.jacksonville.com
DeSantis has trumpeted that he avoided the avalanche of deaths like in New York and New Jersey because he prohibited hospitals from transferring positive cases back to facilities. But he didn’t ban the practice until May 5."
It didn't become an issue because Florida hospitals at that time were not overwhelmed like in NY
You fricking dumbass. Name the last novel virus. Every novel virus is a potential crisis. Who makes them, nature makes them.So you are admitting you do not know the difference between shit and Shinola. Only a double dumbass would do that.Neither do you dumb ass
FYI, in the future do not say "neither do you" which implies we both do not know. Oh my you people are stupid.
uh huh perpetual lock down
because there are always novel corona viruses running around
We do add function research that specifically makes them
Remember your education pleb. I've never met a science assessment i didn't crush
Your post is the post of an extremely stupid person who has no idea how stupid they are. God help you. You are crushing yourself.
many things contribute to that. you're far too stupid to understand.Because people FLOCK to places with high real estate prices to get away from low real estate prices.they all fled here trying to escape cuomo hence Florida's home prices soaring and New Yorks sinking.
Really.
Just STFU
dude, that fk is some kind of stupid huh?Actually many did including Florida.Other States also didn't ship covid patients into retirement homes like New York did.
Well, no one could make that up.
Wait, you just did ..."Also last week, he announced a Jacksonville nursing home that hadn’t opened yet would take COVID-19 patients who can’t be isolated in their current facilities.State missteps failed frail in Florida’s nursing homes
As coronavirus deaths increased exponentially in elder care centers, Gov. Ron DeSantis took a victory lap. Along with...www.jacksonville.com
DeSantis has trumpeted that he avoided the avalanche of deaths like in New York and New Jersey because he prohibited hospitals from transferring positive cases back to facilities. But he didn’t ban the practice until May 5."
It didn't become an issue because Florida hospitals at that time were not overwhelmed like in NY
That doesn't support your claim that Florida sent COVID patients into nursing homes. You accually claimed that several States did and the only one State you just provided an article for didn't support that.
Just FYI, DaSantis isn't a doctor. He didn't identify covid patients fast enough? What does that even mean? You think governors are in nursing homes monitoring for Covid cases? But no way is that in the league of what Cuomo did actually sending covid cases into nursing homes.
Rejected as the stupid shit that it is. Democrats are so low intelligence, you have to be
hoax, is what wuhan was. know that. only you be the fool.How do all these dumbass Trump minions survive. They are so fricking stupid they do not know the difference between shit and Shinola.Neither do you dumb assWhen he admits his ignorance, there is no need to rub it in. He knows he doesn't know shit from shinola, virus from novel virus.So you are admitting you do not know the difference between shit and Shinola. Only a double dumbass would do that.
FYI, in the future do not say "neither do you" which implies we both do not know. Oh my you people are stupid.
He has T-shirts with "ignorance is bliss" on them.
Shirts with "I'm with stupid" and the arrow pointing upward.
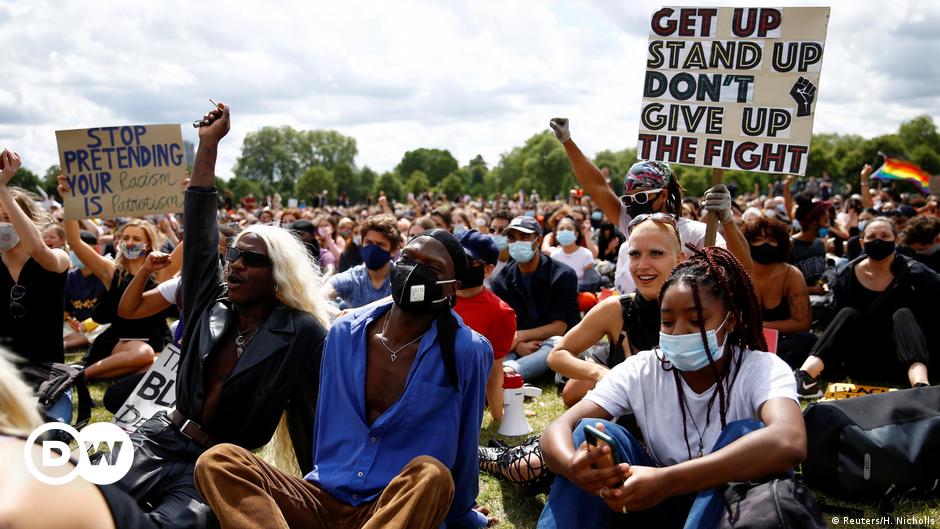
not all wearing masks.View attachment 463922View attachment 463922Most, not All, are wearing masks. Definitely not social distancing. How many pics do you need? Google images is full of them.
look at that social distancing and mask counts. holy crap.View attachment 463951
Most, not All, are wearing masks. Definitely not social distancing. How many pics do you need? Google images is full of them.
If you're going to post pictures of BLM protesters potentially spreading the coronavirus, stick to the USA
BLM protest leader demands talks with UK PM – DW – 06/20/2020
Large crowds have turned out in several British cities to protest against racism and police violence. Activists are demanding the country faces up to its own history of slave trading, colonialism and inequality.
Hundreds of people joined Black Lives Matter protests across Britain on Saturday, marking the fourth weekend of anti-racism demonstrations in a row.
Large rallies were underway in Glasgow, Birmingham, Manchester, Edinburgh and the capital, London, where activists gathered in Hyde Park.
Hey, thanks for the tip. I should have been more specific in my search. Here is a BLM protest from Washington DC. It’s worse than the UK when it comes to the Democrat COVID criteria. Again, not too much concern over lack of social distancing and not a 100 percent mask covered event. But, hey, it was a BLM event so COVID restrictions took a backseat.
View attachment 464025
dude, I was listening to Sirius Radio yesterday and one of the DJ's in Connecticut was crying to the TX people to reconsider their mask wearing and keep doing it even though the state government lifted it. I'm talking to the radio for the ***** to shut the fk up and live her life.
no one could ever prove where anyone was infected with a virus. it takes days to infest.11 people? That qualify as "SUPER SPREADER EVENTS"???????????????Your "study" failed to connect a single person who attended a Trump event to a single case of Covid.
Please try again.Dozens Of Secret Service Agents Get COVID During Trump's Travels - KFF Health News
As Donald Trump and Mike Pence continue to travel for campaign rallies during the pandemic, the Secret Service agents assigned to protect them have been exposed to the coronavirus. The Washington Post reveals previously unreported cases.
As Donald Trump and Mike Pence continue to travel for campaign rallies during the pandemic, the Secret Service agents assigned to protect them have been exposed to the coronavirus. The Washington Post reveals previously unreported cases.
Five agents helping plan security for the president’s late July rally in Tampa
And in Tulsa in June, six advance staff and two Secret Service agents contracted the virus
And they didn't confirm the rallies is where they were infected. In fact, it indicates they didn't get infected at the rallies since they were ADVANCE PLANNING agents.
You really are stupid.
no you didn't read the post you fking idiot. Here was the line in the Post I responded to " Colonelanus does not know the difference between a novel virus and a virus "I read the post. Tell me what I am missing.Read the fking post you idiotWHAT DID NEITHER REFER TO?It depends on what the neither referred toSo you are admitting you do not know the difference between shit and Shinola. Only a double dumbass would do that.Neither do you dumb assPopulation density
Go figureI count four red states in your top ten here. Texas and Florida are #2 and #3 respectively.
U.S. State Population by Rank (Update for 2023!)
Discover the U.S. States ranked by population, population density, and growth.www.infoplease.com
The states with the largest populations tended to have the most COVID deaths. Some were actually red states...I'm guessing that's too complicated an answer.Population density
Go figureDems claim rightwingers refuse to wear masks. Then explain why more people died in lefty states.
Bring some science, not "ORANGE MAN BAD"!
State Deaths /
1M popTotal
CasesConfirmed
CasesConfirmed Case
Fatality RateTotal Case
Fatality RateTests Tests /
1M popConfirmed Cases /
1M popNew
DeathsDeaths California 1,336 - 3,563,618 1.48% - 48,897,190 1,237,521 90,190 - 52,782 New York 2,470 - 1,693,580 2.84% - 38,409,107 1,974,400 87,058 - 48,042 Texas 1,533 - 2,672,266 1.66% - 23,204,166 800,257 92,160 - 44,453 Florida 1,450 - 1,918,100 1.62% - 21,901,603 1,019,735 89,306 - 31,142 Pennsylvania 1,890 - 940,831 2.57% - 10,476,323 818,336 73,491 - 24,193 New Jersey 2,626 - 795,785 2.93% - 10,690,625 1,203,602 89,593 - 23,321 Illinois 1,800 - 1,189,416 1.92% - 18,234,668 1,438,993 93,863 - 22,803 Georgia 1,646 - 1,011,807 1.73% - 7,712,024 726,356 95,297 - 17,480 Ohio 1,484 - 970,583 1.79% - 10,084,481 862,725 83,033 - 17,346 Michigan 1,657 - 649,057 2.55% - 10,985,614 1,100,007 64,991 - 16,544 Massachusetts 2,329 - 582,844 2.78% - 16,317,937 2,348,073 83,868 - 16,182 Arizona 2,206 - 818,670 1.96% - 4,210,980 578,533 112,474 - 16,060 Indiana 1,875 - 662,750 1.90% - 8,056,112 1,196,650 98,445 - 12,623 Tennessee 1,674 - 776,337 1.47% - 6,797,475 994,776 113,613 - 11,436 North Carolina 1,076 - 863,409 1.31% - 10,311,881 983,200 82,323 - 11,288 Alabama 2,045 - 497,154 2.02% - 2,423,471 494,265 101,394 +38 10,029 Louisiana 2,075 - 431,271 2.24% - 6,004,999 1,291,733 92,771 - 9,647 Virginia 1,048 - 578,559 1.55% - 7,547,695 884,269 67,783 - 8,943 South Carolina 1,666 - 518,823 1.65% - 5,999,533 1,165,249 100,767 - 8,576 Missouri 1,394 - 522,581 1.64% - 5,490,487 894,591 85,147 - 8,555 Maryland 1,310 - 383,956 2.06% - 7,948,627 1,314,761 63,509 +14 7,919 Connecticut 2,148 - 283,128 2.70% - 6,804,929 1,908,662 79,412 - 7,658 Mississippi 2,266 - 295,675 2.28% - 2,472,673 830,830 99,348 +19 6,743 Minnesota 1,163 - 485,655 1.35% - 7,376,464 1,307,969 86,115 - 6,558 Wisconsin 1,106 - 564,592 1.14% - 3,196,304 548,964 96,968 - 6,440 Colorado 1,035 - 430,615 1.38% - 2,585,390 448,951 74,776 - 5,959 Iowa 1,743 - 364,892 1.51% - 4,088,220 1,295,762 115,653 - 5,498 Arkansas 1,741 - 322,949 1.63% - 3,169,449 1,050,243 107,014 - 5,254 Washington 664 - 344,660 1.47% - 5,301,508 696,203 45,261 - 5,059 Nevada 1,613 - 294,289 1.69% - 2,729,627 886,198 95,544 - 4,967 Kansas 1,630 - 296,954 1.60% - 1,259,105 432,190 101,930 - 4,750 Kentucky 1,046 - 406,201 1.15% - 4,521,249 1,011,992 90,920 - 4,671 Oklahoma 1,146 - 424,999 1.07% - 3,516,251 888,622 107,405 - 4,534 New Mexico 1,784 - 185,542 2.02% - 2,710,151 1,292,500 88,487 - 3,740 Rhode Island 2,384 - 126,849 1.99% - 3,022,306 2,852,952 119,741 - 2,525 West Virginia 1,292 - 132,416 1.74% - 2,198,226 1,230,020 74,094 +8 2,309 Oregon 528 - 156,037 1.43% - 3,760,400 891,568 36,995 - 2,225 Nebraska 1,077 - 201,346 1.04% - 967,551 500,179 104,087 - 2,084 Puerto Rico 641 - 183,432 1.12% - 464,073 145,309 57,436 +8 2,048 Utah 608 - 371,979 0.52% - 3,828,322 1,194,127 116,027 - 1,949 South Dakota 2,134 - 112,652 1.68% - 423,463 478,674 127,339 - 1,888 Idaho 1,044 - 171,836 1.09% - 1,092,871 609,839 95,887 - 1,871 North Dakota 1,899 - 99,957 1.45% - 405,387 531,961 131,166 - 1,447 Delaware 1,464 - 87,193 1.64% - 627,084 643,979 89,542 - 1,426 Montana 1,284 - 100,158 1.37% - 1,081,562 1,011,961 93,713 - 1,372 New Hampshire 860 - 75,803 1.54% - 1,662,742 1,222,864 55,749 - 1,170 District of Columbia 1,450 - 40,818 2.51% - 1,233,983 1,748,473 57,836 +4 1,023 Maine 524 - 45,091 1.56% - 1,871,610 1,392,347 33,545 +2 705 Wyoming 1,178 - 54,527 1.25% - 641,380 1,108,199 94,214 - 682 Hawaii 310 - 27,623 1.59% - 1,120,660 791,498 19,510 - 439 Alaska 409 - 56,428 0.53% - 1,704,660 2,330,219 77,135 - 299 Vermont 330 - 15,372 1.34% - 1,078,840 1,728,941 24,635 - 20 
Coronavirus Updates (COVID-19) Deaths & Cases per 1M Population | RealClearPolitics
Coronavirus Updates (COVID-19) Deaths & Cases per Population | RealClearPoliticswww.realclearpolitics.com
Population density for one thing. You're pretty dense but even you can figure it out (probably not but there is always hope).
That and your blob's DHS forced everyone returning from overseas--tens of thousands of passengers who were unscreened and untested through 13 major airports. Almost all were in Blue States and every county that had one of these airports was a Covid-19 Hotspot and had an infection spike.U.S. State Population by Rank (Update for 2023!)
Discover the U.S. States ranked by population, population density, and growth.
The states with the largest populations tended to have the most COVID deaths. Some were actually red states...
The other factor affecting death rates is when states first got socked with Covid. Early on we didn't know how to treat it or detect early.Not trueThe people most vocal about lockdowns and social distancing were silent during BLM protests
Yes...and masks...and out doorsDid anyone see social distancing there?
I actually attended several BLM marches and yes...masks and social distancing...unlike the Trump rallies. And I called out those cases where people were sloppy about masks and SD on this very forum.It's the Dems fault nobody wants to live in third world shithole red states (-:Democratic Governors took the hard decisions to shut down when the pandemic hit.Wow good one. How about lack of population density in the skulls of Dim governors?Population density
Go figure
It was Republican Governors who had three months to prepare and left their states vulnerable.Flu is way down because people are wearing masks following safety measures & more people getting flu shots.You dumb son of a *****. The more population a state has, it is logical the more deaths they will have. To compare apples to apples you need to rank by deaths' per capita. You cannot be this stupid.Dems claim rightwingers refuse to wear masks. Then explain why more people died in lefty states.
Bring some science, not "ORANGE MAN BAD"!
State Deaths /
1M popTotal
CasesConfirmed
CasesConfirmed Case
Fatality RateTotal Case
Fatality RateTests Tests /
1M popConfirmed Cases /
1M popNew
DeathsDeaths California 1,336 - 3,563,618 1.48% - 48,897,190 1,237,521 90,190 - 52,782 New York 2,470 - 1,693,580 2.84% - 38,409,107 1,974,400 87,058 - 48,042 Texas 1,533 - 2,672,266 1.66% - 23,204,166 800,257 92,160 - 44,453 Florida 1,450 - 1,918,100 1.62% - 21,901,603 1,019,735 89,306 - 31,142 Pennsylvania 1,890 - 940,831 2.57% - 10,476,323 818,336 73,491 - 24,193 New Jersey 2,626 - 795,785 2.93% - 10,690,625 1,203,602 89,593 - 23,321 Illinois 1,800 - 1,189,416 1.92% - 18,234,668 1,438,993 93,863 - 22,803 Georgia 1,646 - 1,011,807 1.73% - 7,712,024 726,356 95,297 - 17,480 Ohio 1,484 - 970,583 1.79% - 10,084,481 862,725 83,033 - 17,346 Michigan 1,657 - 649,057 2.55% - 10,985,614 1,100,007 64,991 - 16,544 Massachusetts 2,329 - 582,844 2.78% - 16,317,937 2,348,073 83,868 - 16,182 Arizona 2,206 - 818,670 1.96% - 4,210,980 578,533 112,474 - 16,060 Indiana 1,875 - 662,750 1.90% - 8,056,112 1,196,650 98,445 - 12,623 Tennessee 1,674 - 776,337 1.47% - 6,797,475 994,776 113,613 - 11,436 North Carolina 1,076 - 863,409 1.31% - 10,311,881 983,200 82,323 - 11,288 Alabama 2,045 - 497,154 2.02% - 2,423,471 494,265 101,394 +38 10,029 Louisiana 2,075 - 431,271 2.24% - 6,004,999 1,291,733 92,771 - 9,647 Virginia 1,048 - 578,559 1.55% - 7,547,695 884,269 67,783 - 8,943 South Carolina 1,666 - 518,823 1.65% - 5,999,533 1,165,249 100,767 - 8,576 Missouri 1,394 - 522,581 1.64% - 5,490,487 894,591 85,147 - 8,555 Maryland 1,310 - 383,956 2.06% - 7,948,627 1,314,761 63,509 +14 7,919 Connecticut 2,148 - 283,128 2.70% - 6,804,929 1,908,662 79,412 - 7,658 Mississippi 2,266 - 295,675 2.28% - 2,472,673 830,830 99,348 +19 6,743 Minnesota 1,163 - 485,655 1.35% - 7,376,464 1,307,969 86,115 - 6,558 Wisconsin 1,106 - 564,592 1.14% - 3,196,304 548,964 96,968 - 6,440 Colorado 1,035 - 430,615 1.38% - 2,585,390 448,951 74,776 - 5,959 Iowa 1,743 - 364,892 1.51% - 4,088,220 1,295,762 115,653 - 5,498 Arkansas 1,741 - 322,949 1.63% - 3,169,449 1,050,243 107,014 - 5,254 Washington 664 - 344,660 1.47% - 5,301,508 696,203 45,261 - 5,059 Nevada 1,613 - 294,289 1.69% - 2,729,627 886,198 95,544 - 4,967 Kansas 1,630 - 296,954 1.60% - 1,259,105 432,190 101,930 - 4,750 Kentucky 1,046 - 406,201 1.15% - 4,521,249 1,011,992 90,920 - 4,671 Oklahoma 1,146 - 424,999 1.07% - 3,516,251 888,622 107,405 - 4,534 New Mexico 1,784 - 185,542 2.02% - 2,710,151 1,292,500 88,487 - 3,740 Rhode Island 2,384 - 126,849 1.99% - 3,022,306 2,852,952 119,741 - 2,525 West Virginia 1,292 - 132,416 1.74% - 2,198,226 1,230,020 74,094 +8 2,309 Oregon 528 - 156,037 1.43% - 3,760,400 891,568 36,995 - 2,225 Nebraska 1,077 - 201,346 1.04% - 967,551 500,179 104,087 - 2,084 Puerto Rico 641 - 183,432 1.12% - 464,073 145,309 57,436 +8 2,048 Utah 608 - 371,979 0.52% - 3,828,322 1,194,127 116,027 - 1,949 South Dakota 2,134 - 112,652 1.68% - 423,463 478,674 127,339 - 1,888 Idaho 1,044 - 171,836 1.09% - 1,092,871 609,839 95,887 - 1,871 North Dakota 1,899 - 99,957 1.45% - 405,387 531,961 131,166 - 1,447 Delaware 1,464 - 87,193 1.64% - 627,084 643,979 89,542 - 1,426 Montana 1,284 - 100,158 1.37% - 1,081,562 1,011,961 93,713 - 1,372 New Hampshire 860 - 75,803 1.54% - 1,662,742 1,222,864 55,749 - 1,170 District of Columbia 1,450 - 40,818 2.51% - 1,233,983 1,748,473 57,836 +4 1,023 Maine 524 - 45,091 1.56% - 1,871,610 1,392,347 33,545 +2 705 Wyoming 1,178 - 54,527 1.25% - 641,380 1,108,199 94,214 - 682 Hawaii 310 - 27,623 1.59% - 1,120,660 791,498 19,510 - 439 Alaska 409 - 56,428 0.53% - 1,704,660 2,330,219 77,135 - 299 Vermont 330 - 15,372 1.34% - 1,078,840 1,728,941 24,635 - 20 Coronavirus Updates (COVID-19) Deaths & Cases per 1M Population | RealClearPolitics
Coronavirus Updates (COVID-19) Deaths & Cases per Population | RealClearPolitics
Guess who is on top for deaths per capita, Trump country.
You people are liars, you are stupid and you are disgusting. Other than that you are good people.

Total Deaths and Death Rates per 100,000 Population | KFF State Health Facts
State level data on Total Deaths and Death Rates per 100,000 Population from KFF, the leading health policy organization in the U.S.www.kff.org
View attachment 463728Population density
Go figure
You're full of shit. Texas and Florida are larger than New York and have major population centers.
Fake news is your life
United States COVID - Coronavirus Statistics - Worldometer
United States Coronavirus update with statistics and graphs: total and new cases, deaths per day, mortality and recovery rates, current active cases, recoveries, trends and timeline.www.worldometers.info
Yesterday 275 people died of coronavirus in Texas.
That's more than New York, New Jersey and Connecticut combined.
(watch the loons piss their pink panties)
Do the populations of illiterate, ignorant, careless dark people have anything to do with it?
Community, Work, and School
Actions that communities can take to slow the spread of COVID-19.www.cdc.gov
weird how it's only in white countries this is a problem....?
*looks at the third world*
haha the projection
let the chinese lead you around by the nose then blame the darkies? What teh **** are you smoking ******? This is your people's fault
Argue the data with the CDC raghead.
Community, Work, and School
Actions that communities can take to slow the spread of COVID-19.
What data?
I'm an Asian we get better results on everything than whites
Have like an 80% acceptance rate for the vaccine. We are the model minority you ******* dolt. And not very fat

While white trash like you are busying cookin meth and suckin pecker for oxyColonelanus does not know the difference between a novel virus and a virus. I will not waste my time explaining. Not only the difference but the implications.Actually the argument that masks don't work, is the same as claimning seatbelts don't work.Covid is more contagiousSo explain why the masks and social distancing have not worked on COVID.
Is it though? 28 total influenza cases? Florida has been wide open since May.
Are you contending there should not be any influenza cases where everything is open and there is no mask mandates?
Well neither works if you don't wear them right or don't wear them at all.
DUH !!!
If we have eradicated influenza by wearing masks and social distancing and closing all businesses, we need to do it every flu season.
How do all these dumbass Trump minions survive. They are so fricking stupid they do not know the difference between shit and Shinola.
FYI, in the future do not say "neither do you" which implies we both do not know. Oh my you people are stupid.
no you didn't read the post you fking idiot. Here was the line in the Post I responded to " Colonelanus does not know the difference between a novel virus and a virus "I read the post. Tell me what I am missing.Read the fking post you idiotWHAT DID NEITHER REFER TO?It depends on what the neither referred toSo you are admitting you do not know the difference between shit and Shinola. Only a double dumbass would do that.Neither do you dumb assPopulation density
Go figureI count four red states in your top ten here. Texas and Florida are #2 and #3 respectively.U.S. State Population by Rank (Update for 2023!)
Discover the U.S. States ranked by population, population density, and growth.
The states with the largest populations tended to have the most COVID deaths. Some were actually red states...I'm guessing that's too complicated an answer.Population density
Go figureDems claim rightwingers refuse to wear masks. Then explain why more people died in lefty states.
Bring some science, not "ORANGE MAN BAD"!
State Deaths /
1M popTotal
CasesConfirmed
CasesConfirmed Case
Fatality RateTotal Case
Fatality RateTests Tests /
1M popConfirmed Cases /
1M popNew
DeathsDeaths California 1,336 - 3,563,618 1.48% - 48,897,190 1,237,521 90,190 - 52,782 New York 2,470 - 1,693,580 2.84% - 38,409,107 1,974,400 87,058 - 48,042 Texas 1,533 - 2,672,266 1.66% - 23,204,166 800,257 92,160 - 44,453 Florida 1,450 - 1,918,100 1.62% - 21,901,603 1,019,735 89,306 - 31,142 Pennsylvania 1,890 - 940,831 2.57% - 10,476,323 818,336 73,491 - 24,193 New Jersey 2,626 - 795,785 2.93% - 10,690,625 1,203,602 89,593 - 23,321 Illinois 1,800 - 1,189,416 1.92% - 18,234,668 1,438,993 93,863 - 22,803 Georgia 1,646 - 1,011,807 1.73% - 7,712,024 726,356 95,297 - 17,480 Ohio 1,484 - 970,583 1.79% - 10,084,481 862,725 83,033 - 17,346 Michigan 1,657 - 649,057 2.55% - 10,985,614 1,100,007 64,991 - 16,544 Massachusetts 2,329 - 582,844 2.78% - 16,317,937 2,348,073 83,868 - 16,182 Arizona 2,206 - 818,670 1.96% - 4,210,980 578,533 112,474 - 16,060 Indiana 1,875 - 662,750 1.90% - 8,056,112 1,196,650 98,445 - 12,623 Tennessee 1,674 - 776,337 1.47% - 6,797,475 994,776 113,613 - 11,436 North Carolina 1,076 - 863,409 1.31% - 10,311,881 983,200 82,323 - 11,288 Alabama 2,045 - 497,154 2.02% - 2,423,471 494,265 101,394 +38 10,029 Louisiana 2,075 - 431,271 2.24% - 6,004,999 1,291,733 92,771 - 9,647 Virginia 1,048 - 578,559 1.55% - 7,547,695 884,269 67,783 - 8,943 South Carolina 1,666 - 518,823 1.65% - 5,999,533 1,165,249 100,767 - 8,576 Missouri 1,394 - 522,581 1.64% - 5,490,487 894,591 85,147 - 8,555 Maryland 1,310 - 383,956 2.06% - 7,948,627 1,314,761 63,509 +14 7,919 Connecticut 2,148 - 283,128 2.70% - 6,804,929 1,908,662 79,412 - 7,658 Mississippi 2,266 - 295,675 2.28% - 2,472,673 830,830 99,348 +19 6,743 Minnesota 1,163 - 485,655 1.35% - 7,376,464 1,307,969 86,115 - 6,558 Wisconsin 1,106 - 564,592 1.14% - 3,196,304 548,964 96,968 - 6,440 Colorado 1,035 - 430,615 1.38% - 2,585,390 448,951 74,776 - 5,959 Iowa 1,743 - 364,892 1.51% - 4,088,220 1,295,762 115,653 - 5,498 Arkansas 1,741 - 322,949 1.63% - 3,169,449 1,050,243 107,014 - 5,254 Washington 664 - 344,660 1.47% - 5,301,508 696,203 45,261 - 5,059 Nevada 1,613 - 294,289 1.69% - 2,729,627 886,198 95,544 - 4,967 Kansas 1,630 - 296,954 1.60% - 1,259,105 432,190 101,930 - 4,750 Kentucky 1,046 - 406,201 1.15% - 4,521,249 1,011,992 90,920 - 4,671 Oklahoma 1,146 - 424,999 1.07% - 3,516,251 888,622 107,405 - 4,534 New Mexico 1,784 - 185,542 2.02% - 2,710,151 1,292,500 88,487 - 3,740 Rhode Island 2,384 - 126,849 1.99% - 3,022,306 2,852,952 119,741 - 2,525 West Virginia 1,292 - 132,416 1.74% - 2,198,226 1,230,020 74,094 +8 2,309 Oregon 528 - 156,037 1.43% - 3,760,400 891,568 36,995 - 2,225 Nebraska 1,077 - 201,346 1.04% - 967,551 500,179 104,087 - 2,084 Puerto Rico 641 - 183,432 1.12% - 464,073 145,309 57,436 +8 2,048 Utah 608 - 371,979 0.52% - 3,828,322 1,194,127 116,027 - 1,949 South Dakota 2,134 - 112,652 1.68% - 423,463 478,674 127,339 - 1,888 Idaho 1,044 - 171,836 1.09% - 1,092,871 609,839 95,887 - 1,871 North Dakota 1,899 - 99,957 1.45% - 405,387 531,961 131,166 - 1,447 Delaware 1,464 - 87,193 1.64% - 627,084 643,979 89,542 - 1,426 Montana 1,284 - 100,158 1.37% - 1,081,562 1,011,961 93,713 - 1,372 New Hampshire 860 - 75,803 1.54% - 1,662,742 1,222,864 55,749 - 1,170 District of Columbia 1,450 - 40,818 2.51% - 1,233,983 1,748,473 57,836 +4 1,023 Maine 524 - 45,091 1.56% - 1,871,610 1,392,347 33,545 +2 705 Wyoming 1,178 - 54,527 1.25% - 641,380 1,108,199 94,214 - 682 Hawaii 310 - 27,623 1.59% - 1,120,660 791,498 19,510 - 439 Alaska 409 - 56,428 0.53% - 1,704,660 2,330,219 77,135 - 299 Vermont 330 - 15,372 1.34% - 1,078,840 1,728,941 24,635 - 20 Coronavirus Updates (COVID-19) Deaths & Cases per 1M Population | RealClearPolitics
Coronavirus Updates (COVID-19) Deaths & Cases per Population | RealClearPolitics
Population density for one thing. You're pretty dense but even you can figure it out (probably not but there is always hope).
That and your blob's DHS forced everyone returning from overseas--tens of thousands of passengers who were unscreened and untested through 13 major airports. Almost all were in Blue States and every county that had one of these airports was a Covid-19 Hotspot and had an infection spike.U.S. State Population by Rank (Update for 2023!)
Discover the U.S. States ranked by population, population density, and growth.
The states with the largest populations tended to have the most COVID deaths. Some were actually red states...
The other factor affecting death rates is when states first got socked with Covid. Early on we didn't know how to treat it or detect early.Not trueThe people most vocal about lockdowns and social distancing were silent during BLM protests
Yes...and masks...and out doorsDid anyone see social distancing there?
I actually attended several BLM marches and yes...masks and social distancing...unlike the Trump rallies. And I called out those cases where people were sloppy about masks and SD on this very forum.It's the Dems fault nobody wants to live in third world shithole red states (-:Democratic Governors took the hard decisions to shut down when the pandemic hit.Wow good one. How about lack of population density in the skulls of Dim governors?Population density
Go figure
It was Republican Governors who had three months to prepare and left their states vulnerable.Flu is way down because people are wearing masks following safety measures & more people getting flu shots.You dumb son of a *****. The more population a state has, it is logical the more deaths they will have. To compare apples to apples you need to rank by deaths' per capita. You cannot be this stupid.Dems claim rightwingers refuse to wear masks. Then explain why more people died in lefty states.
Bring some science, not "ORANGE MAN BAD"!
State Deaths /
1M popTotal
CasesConfirmed
CasesConfirmed Case
Fatality RateTotal Case
Fatality RateTests Tests /
1M popConfirmed Cases /
1M popNew
DeathsDeaths California 1,336 - 3,563,618 1.48% - 48,897,190 1,237,521 90,190 - 52,782 New York 2,470 - 1,693,580 2.84% - 38,409,107 1,974,400 87,058 - 48,042 Texas 1,533 - 2,672,266 1.66% - 23,204,166 800,257 92,160 - 44,453 Florida 1,450 - 1,918,100 1.62% - 21,901,603 1,019,735 89,306 - 31,142 Pennsylvania 1,890 - 940,831 2.57% - 10,476,323 818,336 73,491 - 24,193 New Jersey 2,626 - 795,785 2.93% - 10,690,625 1,203,602 89,593 - 23,321 Illinois 1,800 - 1,189,416 1.92% - 18,234,668 1,438,993 93,863 - 22,803 Georgia 1,646 - 1,011,807 1.73% - 7,712,024 726,356 95,297 - 17,480 Ohio 1,484 - 970,583 1.79% - 10,084,481 862,725 83,033 - 17,346 Michigan 1,657 - 649,057 2.55% - 10,985,614 1,100,007 64,991 - 16,544 Massachusetts 2,329 - 582,844 2.78% - 16,317,937 2,348,073 83,868 - 16,182 Arizona 2,206 - 818,670 1.96% - 4,210,980 578,533 112,474 - 16,060 Indiana 1,875 - 662,750 1.90% - 8,056,112 1,196,650 98,445 - 12,623 Tennessee 1,674 - 776,337 1.47% - 6,797,475 994,776 113,613 - 11,436 North Carolina 1,076 - 863,409 1.31% - 10,311,881 983,200 82,323 - 11,288 Alabama 2,045 - 497,154 2.02% - 2,423,471 494,265 101,394 +38 10,029 Louisiana 2,075 - 431,271 2.24% - 6,004,999 1,291,733 92,771 - 9,647 Virginia 1,048 - 578,559 1.55% - 7,547,695 884,269 67,783 - 8,943 South Carolina 1,666 - 518,823 1.65% - 5,999,533 1,165,249 100,767 - 8,576 Missouri 1,394 - 522,581 1.64% - 5,490,487 894,591 85,147 - 8,555 Maryland 1,310 - 383,956 2.06% - 7,948,627 1,314,761 63,509 +14 7,919 Connecticut 2,148 - 283,128 2.70% - 6,804,929 1,908,662 79,412 - 7,658 Mississippi 2,266 - 295,675 2.28% - 2,472,673 830,830 99,348 +19 6,743 Minnesota 1,163 - 485,655 1.35% - 7,376,464 1,307,969 86,115 - 6,558 Wisconsin 1,106 - 564,592 1.14% - 3,196,304 548,964 96,968 - 6,440 Colorado 1,035 - 430,615 1.38% - 2,585,390 448,951 74,776 - 5,959 Iowa 1,743 - 364,892 1.51% - 4,088,220 1,295,762 115,653 - 5,498 Arkansas 1,741 - 322,949 1.63% - 3,169,449 1,050,243 107,014 - 5,254 Washington 664 - 344,660 1.47% - 5,301,508 696,203 45,261 - 5,059 Nevada 1,613 - 294,289 1.69% - 2,729,627 886,198 95,544 - 4,967 Kansas 1,630 - 296,954 1.60% - 1,259,105 432,190 101,930 - 4,750 Kentucky 1,046 - 406,201 1.15% - 4,521,249 1,011,992 90,920 - 4,671 Oklahoma 1,146 - 424,999 1.07% - 3,516,251 888,622 107,405 - 4,534 New Mexico 1,784 - 185,542 2.02% - 2,710,151 1,292,500 88,487 - 3,740 Rhode Island 2,384 - 126,849 1.99% - 3,022,306 2,852,952 119,741 - 2,525 West Virginia 1,292 - 132,416 1.74% - 2,198,226 1,230,020 74,094 +8 2,309 Oregon 528 - 156,037 1.43% - 3,760,400 891,568 36,995 - 2,225 Nebraska 1,077 - 201,346 1.04% - 967,551 500,179 104,087 - 2,084 Puerto Rico 641 - 183,432 1.12% - 464,073 145,309 57,436 +8 2,048 Utah 608 - 371,979 0.52% - 3,828,322 1,194,127 116,027 - 1,949 South Dakota 2,134 - 112,652 1.68% - 423,463 478,674 127,339 - 1,888 Idaho 1,044 - 171,836 1.09% - 1,092,871 609,839 95,887 - 1,871 North Dakota 1,899 - 99,957 1.45% - 405,387 531,961 131,166 - 1,447 Delaware 1,464 - 87,193 1.64% - 627,084 643,979 89,542 - 1,426 Montana 1,284 - 100,158 1.37% - 1,081,562 1,011,961 93,713 - 1,372 New Hampshire 860 - 75,803 1.54% - 1,662,742 1,222,864 55,749 - 1,170 District of Columbia 1,450 - 40,818 2.51% - 1,233,983 1,748,473 57,836 +4 1,023 Maine 524 - 45,091 1.56% - 1,871,610 1,392,347 33,545 +2 705 Wyoming 1,178 - 54,527 1.25% - 641,380 1,108,199 94,214 - 682 Hawaii 310 - 27,623 1.59% - 1,120,660 791,498 19,510 - 439 Alaska 409 - 56,428 0.53% - 1,704,660 2,330,219 77,135 - 299 Vermont 330 - 15,372 1.34% - 1,078,840 1,728,941 24,635 - 20 Coronavirus Updates (COVID-19) Deaths & Cases per 1M Population | RealClearPolitics
Coronavirus Updates (COVID-19) Deaths & Cases per Population | RealClearPolitics
Guess who is on top for deaths per capita, Trump country.
You people are liars, you are stupid and you are disgusting. Other than that you are good people.
Total Deaths and Death Rates per 100,000 Population | KFF State Health Facts
State level data on Total Deaths and Death Rates per 100,000 Population from KFF, the leading health policy organization in the U.S.
View attachment 463728Population density
Go figure
You're full of shit. Texas and Florida are larger than New York and have major population centers.
Fake news is your lifeUnited States COVID - Coronavirus Statistics - Worldometer
United States Coronavirus update with statistics and graphs: total and new cases, deaths per day, mortality and recovery rates, current active cases, recoveries, trends and timeline.
Yesterday 275 people died of coronavirus in Texas.
That's more than New York, New Jersey and Connecticut combined.
(watch the loons piss their pink panties)
Do the populations of illiterate, ignorant, careless dark people have anything to do with it?
Community, Work, and School
Actions that communities can take to slow the spread of COVID-19.
weird how it's only in white countries this is a problem....?
*looks at the third world*
haha the projection
let the chinese lead you around by the nose then blame the darkies? What teh **** are you smoking ******? This is your people's fault
Argue the data with the CDC raghead.
Community, Work, and School
Actions that communities can take to slow the spread of COVID-19.
What data?
I'm an Asian we get better results on everything than whites
Have like an 80% acceptance rate for the vaccine. We are the model minority you ******* dolt. And not very fat
While white trash like you are busying cookin meth and suckin pecker for oxyColonelanus does not know the difference between a novel virus and a virus. I will not waste my time explaining. Not only the difference but the implications.Actually the argument that masks don't work, is the same as claimning seatbelts don't work.Covid is more contagiousSo explain why the masks and social distancing have not worked on COVID.
Is it though? 28 total influenza cases? Florida has been wide open since May.
Are you contending there should not be any influenza cases where everything is open and there is no mask mandates?
Well neither works if you don't wear them right or don't wear them at all.
DUH !!!
If we have eradicated influenza by wearing masks and social distancing and closing all businesses, we need to do it every flu season.
How do all these dumbass Trump minions survive. They are so fricking stupid they do not know the difference between shit and Shinola.
FYI, in the future do not say "neither do you" which implies we both do not know. Oh my you people are stupid.
I said, neither do you.
Now tell me where I was included in any of that. you're such a fkwad. You must have to wipe yourself hourly.
You weren’t talking to me right?no you didn't read the post you fking idiot. Here was the line in the Post I responded to " Colonelanus does not know the difference between a novel virus and a virus "I read the post. Tell me what I am missing.Read the fking post you idiotWHAT DID NEITHER REFER TO?It depends on what the neither referred toSo you are admitting you do not know the difference between shit and Shinola. Only a double dumbass would do that.Neither do you dumb assPopulation density
Go figureI count four red states in your top ten here. Texas and Florida are #2 and #3 respectively.U.S. State Population by Rank (Update for 2023!)
Discover the U.S. States ranked by population, population density, and growth.
The states with the largest populations tended to have the most COVID deaths. Some were actually red states...I'm guessing that's too complicated an answer.Population density
Go figureDems claim rightwingers refuse to wear masks. Then explain why more people died in lefty states.
Bring some science, not "ORANGE MAN BAD"!
State Deaths /
1M popTotal
CasesConfirmed
CasesConfirmed Case
Fatality RateTotal Case
Fatality RateTests Tests /
1M popConfirmed Cases /
1M popNew
DeathsDeaths California 1,336 - 3,563,618 1.48% - 48,897,190 1,237,521 90,190 - 52,782 New York 2,470 - 1,693,580 2.84% - 38,409,107 1,974,400 87,058 - 48,042 Texas 1,533 - 2,672,266 1.66% - 23,204,166 800,257 92,160 - 44,453 Florida 1,450 - 1,918,100 1.62% - 21,901,603 1,019,735 89,306 - 31,142 Pennsylvania 1,890 - 940,831 2.57% - 10,476,323 818,336 73,491 - 24,193 New Jersey 2,626 - 795,785 2.93% - 10,690,625 1,203,602 89,593 - 23,321 Illinois 1,800 - 1,189,416 1.92% - 18,234,668 1,438,993 93,863 - 22,803 Georgia 1,646 - 1,011,807 1.73% - 7,712,024 726,356 95,297 - 17,480 Ohio 1,484 - 970,583 1.79% - 10,084,481 862,725 83,033 - 17,346 Michigan 1,657 - 649,057 2.55% - 10,985,614 1,100,007 64,991 - 16,544 Massachusetts 2,329 - 582,844 2.78% - 16,317,937 2,348,073 83,868 - 16,182 Arizona 2,206 - 818,670 1.96% - 4,210,980 578,533 112,474 - 16,060 Indiana 1,875 - 662,750 1.90% - 8,056,112 1,196,650 98,445 - 12,623 Tennessee 1,674 - 776,337 1.47% - 6,797,475 994,776 113,613 - 11,436 North Carolina 1,076 - 863,409 1.31% - 10,311,881 983,200 82,323 - 11,288 Alabama 2,045 - 497,154 2.02% - 2,423,471 494,265 101,394 +38 10,029 Louisiana 2,075 - 431,271 2.24% - 6,004,999 1,291,733 92,771 - 9,647 Virginia 1,048 - 578,559 1.55% - 7,547,695 884,269 67,783 - 8,943 South Carolina 1,666 - 518,823 1.65% - 5,999,533 1,165,249 100,767 - 8,576 Missouri 1,394 - 522,581 1.64% - 5,490,487 894,591 85,147 - 8,555 Maryland 1,310 - 383,956 2.06% - 7,948,627 1,314,761 63,509 +14 7,919 Connecticut 2,148 - 283,128 2.70% - 6,804,929 1,908,662 79,412 - 7,658 Mississippi 2,266 - 295,675 2.28% - 2,472,673 830,830 99,348 +19 6,743 Minnesota 1,163 - 485,655 1.35% - 7,376,464 1,307,969 86,115 - 6,558 Wisconsin 1,106 - 564,592 1.14% - 3,196,304 548,964 96,968 - 6,440 Colorado 1,035 - 430,615 1.38% - 2,585,390 448,951 74,776 - 5,959 Iowa 1,743 - 364,892 1.51% - 4,088,220 1,295,762 115,653 - 5,498 Arkansas 1,741 - 322,949 1.63% - 3,169,449 1,050,243 107,014 - 5,254 Washington 664 - 344,660 1.47% - 5,301,508 696,203 45,261 - 5,059 Nevada 1,613 - 294,289 1.69% - 2,729,627 886,198 95,544 - 4,967 Kansas 1,630 - 296,954 1.60% - 1,259,105 432,190 101,930 - 4,750 Kentucky 1,046 - 406,201 1.15% - 4,521,249 1,011,992 90,920 - 4,671 Oklahoma 1,146 - 424,999 1.07% - 3,516,251 888,622 107,405 - 4,534 New Mexico 1,784 - 185,542 2.02% - 2,710,151 1,292,500 88,487 - 3,740 Rhode Island 2,384 - 126,849 1.99% - 3,022,306 2,852,952 119,741 - 2,525 West Virginia 1,292 - 132,416 1.74% - 2,198,226 1,230,020 74,094 +8 2,309 Oregon 528 - 156,037 1.43% - 3,760,400 891,568 36,995 - 2,225 Nebraska 1,077 - 201,346 1.04% - 967,551 500,179 104,087 - 2,084 Puerto Rico 641 - 183,432 1.12% - 464,073 145,309 57,436 +8 2,048 Utah 608 - 371,979 0.52% - 3,828,322 1,194,127 116,027 - 1,949 South Dakota 2,134 - 112,652 1.68% - 423,463 478,674 127,339 - 1,888 Idaho 1,044 - 171,836 1.09% - 1,092,871 609,839 95,887 - 1,871 North Dakota 1,899 - 99,957 1.45% - 405,387 531,961 131,166 - 1,447 Delaware 1,464 - 87,193 1.64% - 627,084 643,979 89,542 - 1,426 Montana 1,284 - 100,158 1.37% - 1,081,562 1,011,961 93,713 - 1,372 New Hampshire 860 - 75,803 1.54% - 1,662,742 1,222,864 55,749 - 1,170 District of Columbia 1,450 - 40,818 2.51% - 1,233,983 1,748,473 57,836 +4 1,023 Maine 524 - 45,091 1.56% - 1,871,610 1,392,347 33,545 +2 705 Wyoming 1,178 - 54,527 1.25% - 641,380 1,108,199 94,214 - 682 Hawaii 310 - 27,623 1.59% - 1,120,660 791,498 19,510 - 439 Alaska 409 - 56,428 0.53% - 1,704,660 2,330,219 77,135 - 299 Vermont 330 - 15,372 1.34% - 1,078,840 1,728,941 24,635 - 20 Coronavirus Updates (COVID-19) Deaths & Cases per 1M Population | RealClearPolitics
Coronavirus Updates (COVID-19) Deaths & Cases per Population | RealClearPolitics
Population density for one thing. You're pretty dense but even you can figure it out (probably not but there is always hope).
That and your blob's DHS forced everyone returning from overseas--tens of thousands of passengers who were unscreened and untested through 13 major airports. Almost all were in Blue States and every county that had one of these airports was a Covid-19 Hotspot and had an infection spike.U.S. State Population by Rank (Update for 2023!)
Discover the U.S. States ranked by population, population density, and growth.
The states with the largest populations tended to have the most COVID deaths. Some were actually red states...
The other factor affecting death rates is when states first got socked with Covid. Early on we didn't know how to treat it or detect early.Not trueThe people most vocal about lockdowns and social distancing were silent during BLM protests
Yes...and masks...and out doorsDid anyone see social distancing there?
I actually attended several BLM marches and yes...masks and social distancing...unlike the Trump rallies. And I called out those cases where people were sloppy about masks and SD on this very forum.It's the Dems fault nobody wants to live in third world shithole red states (-:Democratic Governors took the hard decisions to shut down when the pandemic hit.Wow good one. How about lack of population density in the skulls of Dim governors?Population density
Go figure
It was Republican Governors who had three months to prepare and left their states vulnerable.Flu is way down because people are wearing masks following safety measures & more people getting flu shots.You dumb son of a *****. The more population a state has, it is logical the more deaths they will have. To compare apples to apples you need to rank by deaths' per capita. You cannot be this stupid.Dems claim rightwingers refuse to wear masks. Then explain why more people died in lefty states.
Bring some science, not "ORANGE MAN BAD"!
State Deaths /
1M popTotal
CasesConfirmed
CasesConfirmed Case
Fatality RateTotal Case
Fatality RateTests Tests /
1M popConfirmed Cases /
1M popNew
DeathsDeaths California 1,336 - 3,563,618 1.48% - 48,897,190 1,237,521 90,190 - 52,782 New York 2,470 - 1,693,580 2.84% - 38,409,107 1,974,400 87,058 - 48,042 Texas 1,533 - 2,672,266 1.66% - 23,204,166 800,257 92,160 - 44,453 Florida 1,450 - 1,918,100 1.62% - 21,901,603 1,019,735 89,306 - 31,142 Pennsylvania 1,890 - 940,831 2.57% - 10,476,323 818,336 73,491 - 24,193 New Jersey 2,626 - 795,785 2.93% - 10,690,625 1,203,602 89,593 - 23,321 Illinois 1,800 - 1,189,416 1.92% - 18,234,668 1,438,993 93,863 - 22,803 Georgia 1,646 - 1,011,807 1.73% - 7,712,024 726,356 95,297 - 17,480 Ohio 1,484 - 970,583 1.79% - 10,084,481 862,725 83,033 - 17,346 Michigan 1,657 - 649,057 2.55% - 10,985,614 1,100,007 64,991 - 16,544 Massachusetts 2,329 - 582,844 2.78% - 16,317,937 2,348,073 83,868 - 16,182 Arizona 2,206 - 818,670 1.96% - 4,210,980 578,533 112,474 - 16,060 Indiana 1,875 - 662,750 1.90% - 8,056,112 1,196,650 98,445 - 12,623 Tennessee 1,674 - 776,337 1.47% - 6,797,475 994,776 113,613 - 11,436 North Carolina 1,076 - 863,409 1.31% - 10,311,881 983,200 82,323 - 11,288 Alabama 2,045 - 497,154 2.02% - 2,423,471 494,265 101,394 +38 10,029 Louisiana 2,075 - 431,271 2.24% - 6,004,999 1,291,733 92,771 - 9,647 Virginia 1,048 - 578,559 1.55% - 7,547,695 884,269 67,783 - 8,943 South Carolina 1,666 - 518,823 1.65% - 5,999,533 1,165,249 100,767 - 8,576 Missouri 1,394 - 522,581 1.64% - 5,490,487 894,591 85,147 - 8,555 Maryland 1,310 - 383,956 2.06% - 7,948,627 1,314,761 63,509 +14 7,919 Connecticut 2,148 - 283,128 2.70% - 6,804,929 1,908,662 79,412 - 7,658 Mississippi 2,266 - 295,675 2.28% - 2,472,673 830,830 99,348 +19 6,743 Minnesota 1,163 - 485,655 1.35% - 7,376,464 1,307,969 86,115 - 6,558 Wisconsin 1,106 - 564,592 1.14% - 3,196,304 548,964 96,968 - 6,440 Colorado 1,035 - 430,615 1.38% - 2,585,390 448,951 74,776 - 5,959 Iowa 1,743 - 364,892 1.51% - 4,088,220 1,295,762 115,653 - 5,498 Arkansas 1,741 - 322,949 1.63% - 3,169,449 1,050,243 107,014 - 5,254 Washington 664 - 344,660 1.47% - 5,301,508 696,203 45,261 - 5,059 Nevada 1,613 - 294,289 1.69% - 2,729,627 886,198 95,544 - 4,967 Kansas 1,630 - 296,954 1.60% - 1,259,105 432,190 101,930 - 4,750 Kentucky 1,046 - 406,201 1.15% - 4,521,249 1,011,992 90,920 - 4,671 Oklahoma 1,146 - 424,999 1.07% - 3,516,251 888,622 107,405 - 4,534 New Mexico 1,784 - 185,542 2.02% - 2,710,151 1,292,500 88,487 - 3,740 Rhode Island 2,384 - 126,849 1.99% - 3,022,306 2,852,952 119,741 - 2,525 West Virginia 1,292 - 132,416 1.74% - 2,198,226 1,230,020 74,094 +8 2,309 Oregon 528 - 156,037 1.43% - 3,760,400 891,568 36,995 - 2,225 Nebraska 1,077 - 201,346 1.04% - 967,551 500,179 104,087 - 2,084 Puerto Rico 641 - 183,432 1.12% - 464,073 145,309 57,436 +8 2,048 Utah 608 - 371,979 0.52% - 3,828,322 1,194,127 116,027 - 1,949 South Dakota 2,134 - 112,652 1.68% - 423,463 478,674 127,339 - 1,888 Idaho 1,044 - 171,836 1.09% - 1,092,871 609,839 95,887 - 1,871 North Dakota 1,899 - 99,957 1.45% - 405,387 531,961 131,166 - 1,447 Delaware 1,464 - 87,193 1.64% - 627,084 643,979 89,542 - 1,426 Montana 1,284 - 100,158 1.37% - 1,081,562 1,011,961 93,713 - 1,372 New Hampshire 860 - 75,803 1.54% - 1,662,742 1,222,864 55,749 - 1,170 District of Columbia 1,450 - 40,818 2.51% - 1,233,983 1,748,473 57,836 +4 1,023 Maine 524 - 45,091 1.56% - 1,871,610 1,392,347 33,545 +2 705 Wyoming 1,178 - 54,527 1.25% - 641,380 1,108,199 94,214 - 682 Hawaii 310 - 27,623 1.59% - 1,120,660 791,498 19,510 - 439 Alaska 409 - 56,428 0.53% - 1,704,660 2,330,219 77,135 - 299 Vermont 330 - 15,372 1.34% - 1,078,840 1,728,941 24,635 - 20 Coronavirus Updates (COVID-19) Deaths & Cases per 1M Population | RealClearPolitics
Coronavirus Updates (COVID-19) Deaths & Cases per Population | RealClearPolitics
Guess who is on top for deaths per capita, Trump country.
You people are liars, you are stupid and you are disgusting. Other than that you are good people.
Total Deaths and Death Rates per 100,000 Population | KFF State Health Facts
State level data on Total Deaths and Death Rates per 100,000 Population from KFF, the leading health policy organization in the U.S.
View attachment 463728Population density
Go figure
You're full of shit. Texas and Florida are larger than New York and have major population centers.
Fake news is your lifeUnited States COVID - Coronavirus Statistics - Worldometer
United States Coronavirus update with statistics and graphs: total and new cases, deaths per day, mortality and recovery rates, current active cases, recoveries, trends and timeline.
Yesterday 275 people died of coronavirus in Texas.
That's more than New York, New Jersey and Connecticut combined.
(watch the loons piss their pink panties)
Do the populations of illiterate, ignorant, careless dark people have anything to do with it?
Community, Work, and School
Actions that communities can take to slow the spread of COVID-19.
weird how it's only in white countries this is a problem....?
*looks at the third world*
haha the projection
let the chinese lead you around by the nose then blame the darkies? What teh **** are you smoking ******? This is your people's fault
Argue the data with the CDC raghead.
Community, Work, and School
Actions that communities can take to slow the spread of COVID-19.
What data?
I'm an Asian we get better results on everything than whites
Have like an 80% acceptance rate for the vaccine. We are the model minority you ******* dolt. And not very fat
While white trash like you are busying cookin meth and suckin pecker for oxyColonelanus does not know the difference between a novel virus and a virus. I will not waste my time explaining. Not only the difference but the implications.Actually the argument that masks don't work, is the same as claimning seatbelts don't work.Covid is more contagiousSo explain why the masks and social distancing have not worked on COVID.
Is it though? 28 total influenza cases? Florida has been wide open since May.
Are you contending there should not be any influenza cases where everything is open and there is no mask mandates?
Well neither works if you don't wear them right or don't wear them at all.
DUH !!!
If we have eradicated influenza by wearing masks and social distancing and closing all businesses, we need to do it every flu season.
How do all these dumbass Trump minions survive. They are so fricking stupid they do not know the difference between shit and Shinola.
FYI, in the future do not say "neither do you" which implies we both do not know. Oh my you people are stupid.
I said, neither do you.
Now tell me where I was included in any of that. you're such a fkwad. You must have to wipe yourself hourly.
Why the **** would i need to name a novel virus
The whole point of my post was to illustrate THERE ARE INNUMERABLE we just dont' give a shit you ******* pleb
Notice how the poor parts of the world just h ave no issues with this? That's because what we're doing is insane and normally we would just ignore it.
My mistake Jshit. I thought the post was from Colonelanus. Easy mistake to make, you both spew the same bullshit.no you didn't read the post you fking idiot. Here was the line in the Post I responded to " Colonelanus does not know the difference between a novel virus and a virus "I read the post. Tell me what I am missing.Read the fking post you idiotWHAT DID NEITHER REFER TO?It depends on what the neither referred toSo you are admitting you do not know the difference between shit and Shinola. Only a double dumbass would do that.Neither do you dumb assPopulation density
Go figureI count four red states in your top ten here. Texas and Florida are #2 and #3 respectively.U.S. State Population by Rank (Update for 2023!)
Discover the U.S. States ranked by population, population density, and growth.
The states with the largest populations tended to have the most COVID deaths. Some were actually red states...I'm guessing that's too complicated an answer.Population density
Go figureDems claim rightwingers refuse to wear masks. Then explain why more people died in lefty states.
Bring some science, not "ORANGE MAN BAD"!
State Deaths /
1M popTotal
CasesConfirmed
CasesConfirmed Case
Fatality RateTotal Case
Fatality RateTests Tests /
1M popConfirmed Cases /
1M popNew
DeathsDeaths California 1,336 - 3,563,618 1.48% - 48,897,190 1,237,521 90,190 - 52,782 New York 2,470 - 1,693,580 2.84% - 38,409,107 1,974,400 87,058 - 48,042 Texas 1,533 - 2,672,266 1.66% - 23,204,166 800,257 92,160 - 44,453 Florida 1,450 - 1,918,100 1.62% - 21,901,603 1,019,735 89,306 - 31,142 Pennsylvania 1,890 - 940,831 2.57% - 10,476,323 818,336 73,491 - 24,193 New Jersey 2,626 - 795,785 2.93% - 10,690,625 1,203,602 89,593 - 23,321 Illinois 1,800 - 1,189,416 1.92% - 18,234,668 1,438,993 93,863 - 22,803 Georgia 1,646 - 1,011,807 1.73% - 7,712,024 726,356 95,297 - 17,480 Ohio 1,484 - 970,583 1.79% - 10,084,481 862,725 83,033 - 17,346 Michigan 1,657 - 649,057 2.55% - 10,985,614 1,100,007 64,991 - 16,544 Massachusetts 2,329 - 582,844 2.78% - 16,317,937 2,348,073 83,868 - 16,182 Arizona 2,206 - 818,670 1.96% - 4,210,980 578,533 112,474 - 16,060 Indiana 1,875 - 662,750 1.90% - 8,056,112 1,196,650 98,445 - 12,623 Tennessee 1,674 - 776,337 1.47% - 6,797,475 994,776 113,613 - 11,436 North Carolina 1,076 - 863,409 1.31% - 10,311,881 983,200 82,323 - 11,288 Alabama 2,045 - 497,154 2.02% - 2,423,471 494,265 101,394 +38 10,029 Louisiana 2,075 - 431,271 2.24% - 6,004,999 1,291,733 92,771 - 9,647 Virginia 1,048 - 578,559 1.55% - 7,547,695 884,269 67,783 - 8,943 South Carolina 1,666 - 518,823 1.65% - 5,999,533 1,165,249 100,767 - 8,576 Missouri 1,394 - 522,581 1.64% - 5,490,487 894,591 85,147 - 8,555 Maryland 1,310 - 383,956 2.06% - 7,948,627 1,314,761 63,509 +14 7,919 Connecticut 2,148 - 283,128 2.70% - 6,804,929 1,908,662 79,412 - 7,658 Mississippi 2,266 - 295,675 2.28% - 2,472,673 830,830 99,348 +19 6,743 Minnesota 1,163 - 485,655 1.35% - 7,376,464 1,307,969 86,115 - 6,558 Wisconsin 1,106 - 564,592 1.14% - 3,196,304 548,964 96,968 - 6,440 Colorado 1,035 - 430,615 1.38% - 2,585,390 448,951 74,776 - 5,959 Iowa 1,743 - 364,892 1.51% - 4,088,220 1,295,762 115,653 - 5,498 Arkansas 1,741 - 322,949 1.63% - 3,169,449 1,050,243 107,014 - 5,254 Washington 664 - 344,660 1.47% - 5,301,508 696,203 45,261 - 5,059 Nevada 1,613 - 294,289 1.69% - 2,729,627 886,198 95,544 - 4,967 Kansas 1,630 - 296,954 1.60% - 1,259,105 432,190 101,930 - 4,750 Kentucky 1,046 - 406,201 1.15% - 4,521,249 1,011,992 90,920 - 4,671 Oklahoma 1,146 - 424,999 1.07% - 3,516,251 888,622 107,405 - 4,534 New Mexico 1,784 - 185,542 2.02% - 2,710,151 1,292,500 88,487 - 3,740 Rhode Island 2,384 - 126,849 1.99% - 3,022,306 2,852,952 119,741 - 2,525 West Virginia 1,292 - 132,416 1.74% - 2,198,226 1,230,020 74,094 +8 2,309 Oregon 528 - 156,037 1.43% - 3,760,400 891,568 36,995 - 2,225 Nebraska 1,077 - 201,346 1.04% - 967,551 500,179 104,087 - 2,084 Puerto Rico 641 - 183,432 1.12% - 464,073 145,309 57,436 +8 2,048 Utah 608 - 371,979 0.52% - 3,828,322 1,194,127 116,027 - 1,949 South Dakota 2,134 - 112,652 1.68% - 423,463 478,674 127,339 - 1,888 Idaho 1,044 - 171,836 1.09% - 1,092,871 609,839 95,887 - 1,871 North Dakota 1,899 - 99,957 1.45% - 405,387 531,961 131,166 - 1,447 Delaware 1,464 - 87,193 1.64% - 627,084 643,979 89,542 - 1,426 Montana 1,284 - 100,158 1.37% - 1,081,562 1,011,961 93,713 - 1,372 New Hampshire 860 - 75,803 1.54% - 1,662,742 1,222,864 55,749 - 1,170 District of Columbia 1,450 - 40,818 2.51% - 1,233,983 1,748,473 57,836 +4 1,023 Maine 524 - 45,091 1.56% - 1,871,610 1,392,347 33,545 +2 705 Wyoming 1,178 - 54,527 1.25% - 641,380 1,108,199 94,214 - 682 Hawaii 310 - 27,623 1.59% - 1,120,660 791,498 19,510 - 439 Alaska 409 - 56,428 0.53% - 1,704,660 2,330,219 77,135 - 299 Vermont 330 - 15,372 1.34% - 1,078,840 1,728,941 24,635 - 20 Coronavirus Updates (COVID-19) Deaths & Cases per 1M Population | RealClearPolitics
Coronavirus Updates (COVID-19) Deaths & Cases per Population | RealClearPolitics
Population density for one thing. You're pretty dense but even you can figure it out (probably not but there is always hope).
That and your blob's DHS forced everyone returning from overseas--tens of thousands of passengers who were unscreened and untested through 13 major airports. Almost all were in Blue States and every county that had one of these airports was a Covid-19 Hotspot and had an infection spike.U.S. State Population by Rank (Update for 2023!)
Discover the U.S. States ranked by population, population density, and growth.
The states with the largest populations tended to have the most COVID deaths. Some were actually red states...
The other factor affecting death rates is when states first got socked with Covid. Early on we didn't know how to treat it or detect early.Not trueThe people most vocal about lockdowns and social distancing were silent during BLM protests
Yes...and masks...and out doorsDid anyone see social distancing there?
I actually attended several BLM marches and yes...masks and social distancing...unlike the Trump rallies. And I called out those cases where people were sloppy about masks and SD on this very forum.It's the Dems fault nobody wants to live in third world shithole red states (-:Democratic Governors took the hard decisions to shut down when the pandemic hit.Wow good one. How about lack of population density in the skulls of Dim governors?Population density
Go figure
It was Republican Governors who had three months to prepare and left their states vulnerable.Flu is way down because people are wearing masks following safety measures & more people getting flu shots.You dumb son of a *****. The more population a state has, it is logical the more deaths they will have. To compare apples to apples you need to rank by deaths' per capita. You cannot be this stupid.Dems claim rightwingers refuse to wear masks. Then explain why more people died in lefty states.
Bring some science, not "ORANGE MAN BAD"!
State Deaths /
1M popTotal
CasesConfirmed
CasesConfirmed Case
Fatality RateTotal Case
Fatality RateTests Tests /
1M popConfirmed Cases /
1M popNew
DeathsDeaths California 1,336 - 3,563,618 1.48% - 48,897,190 1,237,521 90,190 - 52,782 New York 2,470 - 1,693,580 2.84% - 38,409,107 1,974,400 87,058 - 48,042 Texas 1,533 - 2,672,266 1.66% - 23,204,166 800,257 92,160 - 44,453 Florida 1,450 - 1,918,100 1.62% - 21,901,603 1,019,735 89,306 - 31,142 Pennsylvania 1,890 - 940,831 2.57% - 10,476,323 818,336 73,491 - 24,193 New Jersey 2,626 - 795,785 2.93% - 10,690,625 1,203,602 89,593 - 23,321 Illinois 1,800 - 1,189,416 1.92% - 18,234,668 1,438,993 93,863 - 22,803 Georgia 1,646 - 1,011,807 1.73% - 7,712,024 726,356 95,297 - 17,480 Ohio 1,484 - 970,583 1.79% - 10,084,481 862,725 83,033 - 17,346 Michigan 1,657 - 649,057 2.55% - 10,985,614 1,100,007 64,991 - 16,544 Massachusetts 2,329 - 582,844 2.78% - 16,317,937 2,348,073 83,868 - 16,182 Arizona 2,206 - 818,670 1.96% - 4,210,980 578,533 112,474 - 16,060 Indiana 1,875 - 662,750 1.90% - 8,056,112 1,196,650 98,445 - 12,623 Tennessee 1,674 - 776,337 1.47% - 6,797,475 994,776 113,613 - 11,436 North Carolina 1,076 - 863,409 1.31% - 10,311,881 983,200 82,323 - 11,288 Alabama 2,045 - 497,154 2.02% - 2,423,471 494,265 101,394 +38 10,029 Louisiana 2,075 - 431,271 2.24% - 6,004,999 1,291,733 92,771 - 9,647 Virginia 1,048 - 578,559 1.55% - 7,547,695 884,269 67,783 - 8,943 South Carolina 1,666 - 518,823 1.65% - 5,999,533 1,165,249 100,767 - 8,576 Missouri 1,394 - 522,581 1.64% - 5,490,487 894,591 85,147 - 8,555 Maryland 1,310 - 383,956 2.06% - 7,948,627 1,314,761 63,509 +14 7,919 Connecticut 2,148 - 283,128 2.70% - 6,804,929 1,908,662 79,412 - 7,658 Mississippi 2,266 - 295,675 2.28% - 2,472,673 830,830 99,348 +19 6,743 Minnesota 1,163 - 485,655 1.35% - 7,376,464 1,307,969 86,115 - 6,558 Wisconsin 1,106 - 564,592 1.14% - 3,196,304 548,964 96,968 - 6,440 Colorado 1,035 - 430,615 1.38% - 2,585,390 448,951 74,776 - 5,959 Iowa 1,743 - 364,892 1.51% - 4,088,220 1,295,762 115,653 - 5,498 Arkansas 1,741 - 322,949 1.63% - 3,169,449 1,050,243 107,014 - 5,254 Washington 664 - 344,660 1.47% - 5,301,508 696,203 45,261 - 5,059 Nevada 1,613 - 294,289 1.69% - 2,729,627 886,198 95,544 - 4,967 Kansas 1,630 - 296,954 1.60% - 1,259,105 432,190 101,930 - 4,750 Kentucky 1,046 - 406,201 1.15% - 4,521,249 1,011,992 90,920 - 4,671 Oklahoma 1,146 - 424,999 1.07% - 3,516,251 888,622 107,405 - 4,534 New Mexico 1,784 - 185,542 2.02% - 2,710,151 1,292,500 88,487 - 3,740 Rhode Island 2,384 - 126,849 1.99% - 3,022,306 2,852,952 119,741 - 2,525 West Virginia 1,292 - 132,416 1.74% - 2,198,226 1,230,020 74,094 +8 2,309 Oregon 528 - 156,037 1.43% - 3,760,400 891,568 36,995 - 2,225 Nebraska 1,077 - 201,346 1.04% - 967,551 500,179 104,087 - 2,084 Puerto Rico 641 - 183,432 1.12% - 464,073 145,309 57,436 +8 2,048 Utah 608 - 371,979 0.52% - 3,828,322 1,194,127 116,027 - 1,949 South Dakota 2,134 - 112,652 1.68% - 423,463 478,674 127,339 - 1,888 Idaho 1,044 - 171,836 1.09% - 1,092,871 609,839 95,887 - 1,871 North Dakota 1,899 - 99,957 1.45% - 405,387 531,961 131,166 - 1,447 Delaware 1,464 - 87,193 1.64% - 627,084 643,979 89,542 - 1,426 Montana 1,284 - 100,158 1.37% - 1,081,562 1,011,961 93,713 - 1,372 New Hampshire 860 - 75,803 1.54% - 1,662,742 1,222,864 55,749 - 1,170 District of Columbia 1,450 - 40,818 2.51% - 1,233,983 1,748,473 57,836 +4 1,023 Maine 524 - 45,091 1.56% - 1,871,610 1,392,347 33,545 +2 705 Wyoming 1,178 - 54,527 1.25% - 641,380 1,108,199 94,214 - 682 Hawaii 310 - 27,623 1.59% - 1,120,660 791,498 19,510 - 439 Alaska 409 - 56,428 0.53% - 1,704,660 2,330,219 77,135 - 299 Vermont 330 - 15,372 1.34% - 1,078,840 1,728,941 24,635 - 20 Coronavirus Updates (COVID-19) Deaths & Cases per 1M Population | RealClearPolitics
Coronavirus Updates (COVID-19) Deaths & Cases per Population | RealClearPolitics
Guess who is on top for deaths per capita, Trump country.
You people are liars, you are stupid and you are disgusting. Other than that you are good people.
Total Deaths and Death Rates per 100,000 Population | KFF State Health Facts
State level data on Total Deaths and Death Rates per 100,000 Population from KFF, the leading health policy organization in the U.S.
View attachment 463728Population density
Go figure
You're full of shit. Texas and Florida are larger than New York and have major population centers.
Fake news is your lifeUnited States COVID - Coronavirus Statistics - Worldometer
United States Coronavirus update with statistics and graphs: total and new cases, deaths per day, mortality and recovery rates, current active cases, recoveries, trends and timeline.
Yesterday 275 people died of coronavirus in Texas.
That's more than New York, New Jersey and Connecticut combined.
(watch the loons piss their pink panties)
Do the populations of illiterate, ignorant, careless dark people have anything to do with it?
Community, Work, and School
Actions that communities can take to slow the spread of COVID-19.
weird how it's only in white countries this is a problem....?
*looks at the third world*
haha the projection
let the chinese lead you around by the nose then blame the darkies? What teh **** are you smoking ******? This is your people's fault
Argue the data with the CDC raghead.
Community, Work, and School
Actions that communities can take to slow the spread of COVID-19.
What data?
I'm an Asian we get better results on everything than whites
Have like an 80% acceptance rate for the vaccine. We are the model minority you ******* dolt. And not very fat
While white trash like you are busying cookin meth and suckin pecker for oxyColonelanus does not know the difference between a novel virus and a virus. I will not waste my time explaining. Not only the difference but the implications.Actually the argument that masks don't work, is the same as claimning seatbelts don't work.Covid is more contagiousSo explain why the masks and social distancing have not worked on COVID.
Is it though? 28 total influenza cases? Florida has been wide open since May.
Are you contending there should not be any influenza cases where everything is open and there is no mask mandates?
Well neither works if you don't wear them right or don't wear them at all.
DUH !!!
If we have eradicated influenza by wearing masks and social distancing and closing all businesses, we need to do it every flu season.
How do all these dumbass Trump minions survive. They are so fricking stupid they do not know the difference between shit and Shinola.
FYI, in the future do not say "neither do you" which implies we both do not know. Oh my you people are stupid.
I said, neither do you.
Now tell me where I was included in any of that. you're such a fkwad. You must have to wipe yourself hourly.
Such vulgar language coming out your pelosi.My mistake Jshit. I thought the post was from Colonelanus. Easy mistake to make, you both spew the same bullshit.no you didn't read the post you fking idiot. Here was the line in the Post I responded to " Colonelanus does not know the difference between a novel virus and a virus "I read the post. Tell me what I am missing.Read the fking post you idiotWHAT DID NEITHER REFER TO?It depends on what the neither referred toSo you are admitting you do not know the difference between shit and Shinola. Only a double dumbass would do that.Neither do you dumb assPopulation density
Go figureI count four red states in your top ten here. Texas and Florida are #2 and #3 respectively.U.S. State Population by Rank (Update for 2023!)
Discover the U.S. States ranked by population, population density, and growth.
The states with the largest populations tended to have the most COVID deaths. Some were actually red states...I'm guessing that's too complicated an answer.Population density
Go figureDems claim rightwingers refuse to wear masks. Then explain why more people died in lefty states.
Bring some science, not "ORANGE MAN BAD"!
State Deaths /
1M popTotal
CasesConfirmed
CasesConfirmed Case
Fatality RateTotal Case
Fatality RateTests Tests /
1M popConfirmed Cases /
1M popNew
DeathsDeaths California 1,336 - 3,563,618 1.48% - 48,897,190 1,237,521 90,190 - 52,782 New York 2,470 - 1,693,580 2.84% - 38,409,107 1,974,400 87,058 - 48,042 Texas 1,533 - 2,672,266 1.66% - 23,204,166 800,257 92,160 - 44,453 Florida 1,450 - 1,918,100 1.62% - 21,901,603 1,019,735 89,306 - 31,142 Pennsylvania 1,890 - 940,831 2.57% - 10,476,323 818,336 73,491 - 24,193 New Jersey 2,626 - 795,785 2.93% - 10,690,625 1,203,602 89,593 - 23,321 Illinois 1,800 - 1,189,416 1.92% - 18,234,668 1,438,993 93,863 - 22,803 Georgia 1,646 - 1,011,807 1.73% - 7,712,024 726,356 95,297 - 17,480 Ohio 1,484 - 970,583 1.79% - 10,084,481 862,725 83,033 - 17,346 Michigan 1,657 - 649,057 2.55% - 10,985,614 1,100,007 64,991 - 16,544 Massachusetts 2,329 - 582,844 2.78% - 16,317,937 2,348,073 83,868 - 16,182 Arizona 2,206 - 818,670 1.96% - 4,210,980 578,533 112,474 - 16,060 Indiana 1,875 - 662,750 1.90% - 8,056,112 1,196,650 98,445 - 12,623 Tennessee 1,674 - 776,337 1.47% - 6,797,475 994,776 113,613 - 11,436 North Carolina 1,076 - 863,409 1.31% - 10,311,881 983,200 82,323 - 11,288 Alabama 2,045 - 497,154 2.02% - 2,423,471 494,265 101,394 +38 10,029 Louisiana 2,075 - 431,271 2.24% - 6,004,999 1,291,733 92,771 - 9,647 Virginia 1,048 - 578,559 1.55% - 7,547,695 884,269 67,783 - 8,943 South Carolina 1,666 - 518,823 1.65% - 5,999,533 1,165,249 100,767 - 8,576 Missouri 1,394 - 522,581 1.64% - 5,490,487 894,591 85,147 - 8,555 Maryland 1,310 - 383,956 2.06% - 7,948,627 1,314,761 63,509 +14 7,919 Connecticut 2,148 - 283,128 2.70% - 6,804,929 1,908,662 79,412 - 7,658 Mississippi 2,266 - 295,675 2.28% - 2,472,673 830,830 99,348 +19 6,743 Minnesota 1,163 - 485,655 1.35% - 7,376,464 1,307,969 86,115 - 6,558 Wisconsin 1,106 - 564,592 1.14% - 3,196,304 548,964 96,968 - 6,440 Colorado 1,035 - 430,615 1.38% - 2,585,390 448,951 74,776 - 5,959 Iowa 1,743 - 364,892 1.51% - 4,088,220 1,295,762 115,653 - 5,498 Arkansas 1,741 - 322,949 1.63% - 3,169,449 1,050,243 107,014 - 5,254 Washington 664 - 344,660 1.47% - 5,301,508 696,203 45,261 - 5,059 Nevada 1,613 - 294,289 1.69% - 2,729,627 886,198 95,544 - 4,967 Kansas 1,630 - 296,954 1.60% - 1,259,105 432,190 101,930 - 4,750 Kentucky 1,046 - 406,201 1.15% - 4,521,249 1,011,992 90,920 - 4,671 Oklahoma 1,146 - 424,999 1.07% - 3,516,251 888,622 107,405 - 4,534 New Mexico 1,784 - 185,542 2.02% - 2,710,151 1,292,500 88,487 - 3,740 Rhode Island 2,384 - 126,849 1.99% - 3,022,306 2,852,952 119,741 - 2,525 West Virginia 1,292 - 132,416 1.74% - 2,198,226 1,230,020 74,094 +8 2,309 Oregon 528 - 156,037 1.43% - 3,760,400 891,568 36,995 - 2,225 Nebraska 1,077 - 201,346 1.04% - 967,551 500,179 104,087 - 2,084 Puerto Rico 641 - 183,432 1.12% - 464,073 145,309 57,436 +8 2,048 Utah 608 - 371,979 0.52% - 3,828,322 1,194,127 116,027 - 1,949 South Dakota 2,134 - 112,652 1.68% - 423,463 478,674 127,339 - 1,888 Idaho 1,044 - 171,836 1.09% - 1,092,871 609,839 95,887 - 1,871 North Dakota 1,899 - 99,957 1.45% - 405,387 531,961 131,166 - 1,447 Delaware 1,464 - 87,193 1.64% - 627,084 643,979 89,542 - 1,426 Montana 1,284 - 100,158 1.37% - 1,081,562 1,011,961 93,713 - 1,372 New Hampshire 860 - 75,803 1.54% - 1,662,742 1,222,864 55,749 - 1,170 District of Columbia 1,450 - 40,818 2.51% - 1,233,983 1,748,473 57,836 +4 1,023 Maine 524 - 45,091 1.56% - 1,871,610 1,392,347 33,545 +2 705 Wyoming 1,178 - 54,527 1.25% - 641,380 1,108,199 94,214 - 682 Hawaii 310 - 27,623 1.59% - 1,120,660 791,498 19,510 - 439 Alaska 409 - 56,428 0.53% - 1,704,660 2,330,219 77,135 - 299 Vermont 330 - 15,372 1.34% - 1,078,840 1,728,941 24,635 - 20 Coronavirus Updates (COVID-19) Deaths & Cases per 1M Population | RealClearPolitics
Coronavirus Updates (COVID-19) Deaths & Cases per Population | RealClearPolitics
Population density for one thing. You're pretty dense but even you can figure it out (probably not but there is always hope).
That and your blob's DHS forced everyone returning from overseas--tens of thousands of passengers who were unscreened and untested through 13 major airports. Almost all were in Blue States and every county that had one of these airports was a Covid-19 Hotspot and had an infection spike.U.S. State Population by Rank (Update for 2023!)
Discover the U.S. States ranked by population, population density, and growth.
The states with the largest populations tended to have the most COVID deaths. Some were actually red states...
The other factor affecting death rates is when states first got socked with Covid. Early on we didn't know how to treat it or detect early.Not trueThe people most vocal about lockdowns and social distancing were silent during BLM protests
Yes...and masks...and out doorsDid anyone see social distancing there?
I actually attended several BLM marches and yes...masks and social distancing...unlike the Trump rallies. And I called out those cases where people were sloppy about masks and SD on this very forum.It's the Dems fault nobody wants to live in third world shithole red states (-:Democratic Governors took the hard decisions to shut down when the pandemic hit.Wow good one. How about lack of population density in the skulls of Dim governors?Population density
Go figure
It was Republican Governors who had three months to prepare and left their states vulnerable.Flu is way down because people are wearing masks following safety measures & more people getting flu shots.You dumb son of a *****. The more population a state has, it is logical the more deaths they will have. To compare apples to apples you need to rank by deaths' per capita. You cannot be this stupid.Dems claim rightwingers refuse to wear masks. Then explain why more people died in lefty states.
Bring some science, not "ORANGE MAN BAD"!
State Deaths /
1M popTotal
CasesConfirmed
CasesConfirmed Case
Fatality RateTotal Case
Fatality RateTests Tests /
1M popConfirmed Cases /
1M popNew
DeathsDeaths California 1,336 - 3,563,618 1.48% - 48,897,190 1,237,521 90,190 - 52,782 New York 2,470 - 1,693,580 2.84% - 38,409,107 1,974,400 87,058 - 48,042 Texas 1,533 - 2,672,266 1.66% - 23,204,166 800,257 92,160 - 44,453 Florida 1,450 - 1,918,100 1.62% - 21,901,603 1,019,735 89,306 - 31,142 Pennsylvania 1,890 - 940,831 2.57% - 10,476,323 818,336 73,491 - 24,193 New Jersey 2,626 - 795,785 2.93% - 10,690,625 1,203,602 89,593 - 23,321 Illinois 1,800 - 1,189,416 1.92% - 18,234,668 1,438,993 93,863 - 22,803 Georgia 1,646 - 1,011,807 1.73% - 7,712,024 726,356 95,297 - 17,480 Ohio 1,484 - 970,583 1.79% - 10,084,481 862,725 83,033 - 17,346 Michigan 1,657 - 649,057 2.55% - 10,985,614 1,100,007 64,991 - 16,544 Massachusetts 2,329 - 582,844 2.78% - 16,317,937 2,348,073 83,868 - 16,182 Arizona 2,206 - 818,670 1.96% - 4,210,980 578,533 112,474 - 16,060 Indiana 1,875 - 662,750 1.90% - 8,056,112 1,196,650 98,445 - 12,623 Tennessee 1,674 - 776,337 1.47% - 6,797,475 994,776 113,613 - 11,436 North Carolina 1,076 - 863,409 1.31% - 10,311,881 983,200 82,323 - 11,288 Alabama 2,045 - 497,154 2.02% - 2,423,471 494,265 101,394 +38 10,029 Louisiana 2,075 - 431,271 2.24% - 6,004,999 1,291,733 92,771 - 9,647 Virginia 1,048 - 578,559 1.55% - 7,547,695 884,269 67,783 - 8,943 South Carolina 1,666 - 518,823 1.65% - 5,999,533 1,165,249 100,767 - 8,576 Missouri 1,394 - 522,581 1.64% - 5,490,487 894,591 85,147 - 8,555 Maryland 1,310 - 383,956 2.06% - 7,948,627 1,314,761 63,509 +14 7,919 Connecticut 2,148 - 283,128 2.70% - 6,804,929 1,908,662 79,412 - 7,658 Mississippi 2,266 - 295,675 2.28% - 2,472,673 830,830 99,348 +19 6,743 Minnesota 1,163 - 485,655 1.35% - 7,376,464 1,307,969 86,115 - 6,558 Wisconsin 1,106 - 564,592 1.14% - 3,196,304 548,964 96,968 - 6,440 Colorado 1,035 - 430,615 1.38% - 2,585,390 448,951 74,776 - 5,959 Iowa 1,743 - 364,892 1.51% - 4,088,220 1,295,762 115,653 - 5,498 Arkansas 1,741 - 322,949 1.63% - 3,169,449 1,050,243 107,014 - 5,254 Washington 664 - 344,660 1.47% - 5,301,508 696,203 45,261 - 5,059 Nevada 1,613 - 294,289 1.69% - 2,729,627 886,198 95,544 - 4,967 Kansas 1,630 - 296,954 1.60% - 1,259,105 432,190 101,930 - 4,750 Kentucky 1,046 - 406,201 1.15% - 4,521,249 1,011,992 90,920 - 4,671 Oklahoma 1,146 - 424,999 1.07% - 3,516,251 888,622 107,405 - 4,534 New Mexico 1,784 - 185,542 2.02% - 2,710,151 1,292,500 88,487 - 3,740 Rhode Island 2,384 - 126,849 1.99% - 3,022,306 2,852,952 119,741 - 2,525 West Virginia 1,292 - 132,416 1.74% - 2,198,226 1,230,020 74,094 +8 2,309 Oregon 528 - 156,037 1.43% - 3,760,400 891,568 36,995 - 2,225 Nebraska 1,077 - 201,346 1.04% - 967,551 500,179 104,087 - 2,084 Puerto Rico 641 - 183,432 1.12% - 464,073 145,309 57,436 +8 2,048 Utah 608 - 371,979 0.52% - 3,828,322 1,194,127 116,027 - 1,949 South Dakota 2,134 - 112,652 1.68% - 423,463 478,674 127,339 - 1,888 Idaho 1,044 - 171,836 1.09% - 1,092,871 609,839 95,887 - 1,871 North Dakota 1,899 - 99,957 1.45% - 405,387 531,961 131,166 - 1,447 Delaware 1,464 - 87,193 1.64% - 627,084 643,979 89,542 - 1,426 Montana 1,284 - 100,158 1.37% - 1,081,562 1,011,961 93,713 - 1,372 New Hampshire 860 - 75,803 1.54% - 1,662,742 1,222,864 55,749 - 1,170 District of Columbia 1,450 - 40,818 2.51% - 1,233,983 1,748,473 57,836 +4 1,023 Maine 524 - 45,091 1.56% - 1,871,610 1,392,347 33,545 +2 705 Wyoming 1,178 - 54,527 1.25% - 641,380 1,108,199 94,214 - 682 Hawaii 310 - 27,623 1.59% - 1,120,660 791,498 19,510 - 439 Alaska 409 - 56,428 0.53% - 1,704,660 2,330,219 77,135 - 299 Vermont 330 - 15,372 1.34% - 1,078,840 1,728,941 24,635 - 20 Coronavirus Updates (COVID-19) Deaths & Cases per 1M Population | RealClearPolitics
Coronavirus Updates (COVID-19) Deaths & Cases per Population | RealClearPolitics
Guess who is on top for deaths per capita, Trump country.
You people are liars, you are stupid and you are disgusting. Other than that you are good people.
Total Deaths and Death Rates per 100,000 Population | KFF State Health Facts
State level data on Total Deaths and Death Rates per 100,000 Population from KFF, the leading health policy organization in the U.S.
View attachment 463728Population density
Go figure
You're full of shit. Texas and Florida are larger than New York and have major population centers.
Fake news is your lifeUnited States COVID - Coronavirus Statistics - Worldometer
United States Coronavirus update with statistics and graphs: total and new cases, deaths per day, mortality and recovery rates, current active cases, recoveries, trends and timeline.
Yesterday 275 people died of coronavirus in Texas.
That's more than New York, New Jersey and Connecticut combined.
(watch the loons piss their pink panties)
Do the populations of illiterate, ignorant, careless dark people have anything to do with it?
Community, Work, and School
Actions that communities can take to slow the spread of COVID-19.
weird how it's only in white countries this is a problem....?
*looks at the third world*
haha the projection
let the chinese lead you around by the nose then blame the darkies? What teh **** are you smoking ******? This is your people's fault
Argue the data with the CDC raghead.
Community, Work, and School
Actions that communities can take to slow the spread of COVID-19.
What data?
I'm an Asian we get better results on everything than whites
Have like an 80% acceptance rate for the vaccine. We are the model minority you ******* dolt. And not very fat
While white trash like you are busying cookin meth and suckin pecker for oxyColonelanus does not know the difference between a novel virus and a virus. I will not waste my time explaining. Not only the difference but the implications.Actually the argument that masks don't work, is the same as claimning seatbelts don't work.Covid is more contagiousSo explain why the masks and social distancing have not worked on COVID.
Is it though? 28 total influenza cases? Florida has been wide open since May.
Are you contending there should not be any influenza cases where everything is open and there is no mask mandates?
Well neither works if you don't wear them right or don't wear them at all.
DUH !!!
If we have eradicated influenza by wearing masks and social distancing and closing all businesses, we need to do it every flu season.
How do all these dumbass Trump minions survive. They are so fricking stupid they do not know the difference between shit and Shinola.
FYI, in the future do not say "neither do you" which implies we both do not know. Oh my you people are stupid.
I said, neither do you.
Now tell me where I was included in any of that. you're such a fkwad. You must have to wipe yourself hourly.
You are a horses ass for throwing your fellow minion, Colonelanus, under the bus as not knowing the difference between a novel virus and a virus and the implications.
Jshit, why don't you tell us the difference between a novel virus and a virus and the implications.
My mistake Jshit. I thought the post was from Colonelanus. Easy mistake to make, you both spew the same bullshit.no you didn't read the post you fking idiot. Here was the line in the Post I responded to " Colonelanus does not know the difference between a novel virus and a virus "I read the post. Tell me what I am missing.Read the fking post you idiotWHAT DID NEITHER REFER TO?It depends on what the neither referred toSo you are admitting you do not know the difference between shit and Shinola. Only a double dumbass would do that.Neither do you dumb assPopulation density
Go figureI count four red states in your top ten here. Texas and Florida are #2 and #3 respectively.U.S. State Population by Rank (Update for 2023!)
Discover the U.S. States ranked by population, population density, and growth.
The states with the largest populations tended to have the most COVID deaths. Some were actually red states...I'm guessing that's too complicated an answer.Population density
Go figureDems claim rightwingers refuse to wear masks. Then explain why more people died in lefty states.
Bring some science, not "ORANGE MAN BAD"!
State Deaths /
1M popTotal
CasesConfirmed
CasesConfirmed Case
Fatality RateTotal Case
Fatality RateTests Tests /
1M popConfirmed Cases /
1M popNew
DeathsDeaths California 1,336 - 3,563,618 1.48% - 48,897,190 1,237,521 90,190 - 52,782 New York 2,470 - 1,693,580 2.84% - 38,409,107 1,974,400 87,058 - 48,042 Texas 1,533 - 2,672,266 1.66% - 23,204,166 800,257 92,160 - 44,453 Florida 1,450 - 1,918,100 1.62% - 21,901,603 1,019,735 89,306 - 31,142 Pennsylvania 1,890 - 940,831 2.57% - 10,476,323 818,336 73,491 - 24,193 New Jersey 2,626 - 795,785 2.93% - 10,690,625 1,203,602 89,593 - 23,321 Illinois 1,800 - 1,189,416 1.92% - 18,234,668 1,438,993 93,863 - 22,803 Georgia 1,646 - 1,011,807 1.73% - 7,712,024 726,356 95,297 - 17,480 Ohio 1,484 - 970,583 1.79% - 10,084,481 862,725 83,033 - 17,346 Michigan 1,657 - 649,057 2.55% - 10,985,614 1,100,007 64,991 - 16,544 Massachusetts 2,329 - 582,844 2.78% - 16,317,937 2,348,073 83,868 - 16,182 Arizona 2,206 - 818,670 1.96% - 4,210,980 578,533 112,474 - 16,060 Indiana 1,875 - 662,750 1.90% - 8,056,112 1,196,650 98,445 - 12,623 Tennessee 1,674 - 776,337 1.47% - 6,797,475 994,776 113,613 - 11,436 North Carolina 1,076 - 863,409 1.31% - 10,311,881 983,200 82,323 - 11,288 Alabama 2,045 - 497,154 2.02% - 2,423,471 494,265 101,394 +38 10,029 Louisiana 2,075 - 431,271 2.24% - 6,004,999 1,291,733 92,771 - 9,647 Virginia 1,048 - 578,559 1.55% - 7,547,695 884,269 67,783 - 8,943 South Carolina 1,666 - 518,823 1.65% - 5,999,533 1,165,249 100,767 - 8,576 Missouri 1,394 - 522,581 1.64% - 5,490,487 894,591 85,147 - 8,555 Maryland 1,310 - 383,956 2.06% - 7,948,627 1,314,761 63,509 +14 7,919 Connecticut 2,148 - 283,128 2.70% - 6,804,929 1,908,662 79,412 - 7,658 Mississippi 2,266 - 295,675 2.28% - 2,472,673 830,830 99,348 +19 6,743 Minnesota 1,163 - 485,655 1.35% - 7,376,464 1,307,969 86,115 - 6,558 Wisconsin 1,106 - 564,592 1.14% - 3,196,304 548,964 96,968 - 6,440 Colorado 1,035 - 430,615 1.38% - 2,585,390 448,951 74,776 - 5,959 Iowa 1,743 - 364,892 1.51% - 4,088,220 1,295,762 115,653 - 5,498 Arkansas 1,741 - 322,949 1.63% - 3,169,449 1,050,243 107,014 - 5,254 Washington 664 - 344,660 1.47% - 5,301,508 696,203 45,261 - 5,059 Nevada 1,613 - 294,289 1.69% - 2,729,627 886,198 95,544 - 4,967 Kansas 1,630 - 296,954 1.60% - 1,259,105 432,190 101,930 - 4,750 Kentucky 1,046 - 406,201 1.15% - 4,521,249 1,011,992 90,920 - 4,671 Oklahoma 1,146 - 424,999 1.07% - 3,516,251 888,622 107,405 - 4,534 New Mexico 1,784 - 185,542 2.02% - 2,710,151 1,292,500 88,487 - 3,740 Rhode Island 2,384 - 126,849 1.99% - 3,022,306 2,852,952 119,741 - 2,525 West Virginia 1,292 - 132,416 1.74% - 2,198,226 1,230,020 74,094 +8 2,309 Oregon 528 - 156,037 1.43% - 3,760,400 891,568 36,995 - 2,225 Nebraska 1,077 - 201,346 1.04% - 967,551 500,179 104,087 - 2,084 Puerto Rico 641 - 183,432 1.12% - 464,073 145,309 57,436 +8 2,048 Utah 608 - 371,979 0.52% - 3,828,322 1,194,127 116,027 - 1,949 South Dakota 2,134 - 112,652 1.68% - 423,463 478,674 127,339 - 1,888 Idaho 1,044 - 171,836 1.09% - 1,092,871 609,839 95,887 - 1,871 North Dakota 1,899 - 99,957 1.45% - 405,387 531,961 131,166 - 1,447 Delaware 1,464 - 87,193 1.64% - 627,084 643,979 89,542 - 1,426 Montana 1,284 - 100,158 1.37% - 1,081,562 1,011,961 93,713 - 1,372 New Hampshire 860 - 75,803 1.54% - 1,662,742 1,222,864 55,749 - 1,170 District of Columbia 1,450 - 40,818 2.51% - 1,233,983 1,748,473 57,836 +4 1,023 Maine 524 - 45,091 1.56% - 1,871,610 1,392,347 33,545 +2 705 Wyoming 1,178 - 54,527 1.25% - 641,380 1,108,199 94,214 - 682 Hawaii 310 - 27,623 1.59% - 1,120,660 791,498 19,510 - 439 Alaska 409 - 56,428 0.53% - 1,704,660 2,330,219 77,135 - 299 Vermont 330 - 15,372 1.34% - 1,078,840 1,728,941 24,635 - 20 Coronavirus Updates (COVID-19) Deaths & Cases per 1M Population | RealClearPolitics
Coronavirus Updates (COVID-19) Deaths & Cases per Population | RealClearPolitics
Population density for one thing. You're pretty dense but even you can figure it out (probably not but there is always hope).
That and your blob's DHS forced everyone returning from overseas--tens of thousands of passengers who were unscreened and untested through 13 major airports. Almost all were in Blue States and every county that had one of these airports was a Covid-19 Hotspot and had an infection spike.U.S. State Population by Rank (Update for 2023!)
Discover the U.S. States ranked by population, population density, and growth.
The states with the largest populations tended to have the most COVID deaths. Some were actually red states...
The other factor affecting death rates is when states first got socked with Covid. Early on we didn't know how to treat it or detect early.Not trueThe people most vocal about lockdowns and social distancing were silent during BLM protests
Yes...and masks...and out doorsDid anyone see social distancing there?
I actually attended several BLM marches and yes...masks and social distancing...unlike the Trump rallies. And I called out those cases where people were sloppy about masks and SD on this very forum.It's the Dems fault nobody wants to live in third world shithole red states (-:Democratic Governors took the hard decisions to shut down when the pandemic hit.Wow good one. How about lack of population density in the skulls of Dim governors?Population density
Go figure
It was Republican Governors who had three months to prepare and left their states vulnerable.Flu is way down because people are wearing masks following safety measures & more people getting flu shots.You dumb son of a *****. The more population a state has, it is logical the more deaths they will have. To compare apples to apples you need to rank by deaths' per capita. You cannot be this stupid.Dems claim rightwingers refuse to wear masks. Then explain why more people died in lefty states.
Bring some science, not "ORANGE MAN BAD"!
State Deaths /
1M popTotal
CasesConfirmed
CasesConfirmed Case
Fatality RateTotal Case
Fatality RateTests Tests /
1M popConfirmed Cases /
1M popNew
DeathsDeaths California 1,336 - 3,563,618 1.48% - 48,897,190 1,237,521 90,190 - 52,782 New York 2,470 - 1,693,580 2.84% - 38,409,107 1,974,400 87,058 - 48,042 Texas 1,533 - 2,672,266 1.66% - 23,204,166 800,257 92,160 - 44,453 Florida 1,450 - 1,918,100 1.62% - 21,901,603 1,019,735 89,306 - 31,142 Pennsylvania 1,890 - 940,831 2.57% - 10,476,323 818,336 73,491 - 24,193 New Jersey 2,626 - 795,785 2.93% - 10,690,625 1,203,602 89,593 - 23,321 Illinois 1,800 - 1,189,416 1.92% - 18,234,668 1,438,993 93,863 - 22,803 Georgia 1,646 - 1,011,807 1.73% - 7,712,024 726,356 95,297 - 17,480 Ohio 1,484 - 970,583 1.79% - 10,084,481 862,725 83,033 - 17,346 Michigan 1,657 - 649,057 2.55% - 10,985,614 1,100,007 64,991 - 16,544 Massachusetts 2,329 - 582,844 2.78% - 16,317,937 2,348,073 83,868 - 16,182 Arizona 2,206 - 818,670 1.96% - 4,210,980 578,533 112,474 - 16,060 Indiana 1,875 - 662,750 1.90% - 8,056,112 1,196,650 98,445 - 12,623 Tennessee 1,674 - 776,337 1.47% - 6,797,475 994,776 113,613 - 11,436 North Carolina 1,076 - 863,409 1.31% - 10,311,881 983,200 82,323 - 11,288 Alabama 2,045 - 497,154 2.02% - 2,423,471 494,265 101,394 +38 10,029 Louisiana 2,075 - 431,271 2.24% - 6,004,999 1,291,733 92,771 - 9,647 Virginia 1,048 - 578,559 1.55% - 7,547,695 884,269 67,783 - 8,943 South Carolina 1,666 - 518,823 1.65% - 5,999,533 1,165,249 100,767 - 8,576 Missouri 1,394 - 522,581 1.64% - 5,490,487 894,591 85,147 - 8,555 Maryland 1,310 - 383,956 2.06% - 7,948,627 1,314,761 63,509 +14 7,919 Connecticut 2,148 - 283,128 2.70% - 6,804,929 1,908,662 79,412 - 7,658 Mississippi 2,266 - 295,675 2.28% - 2,472,673 830,830 99,348 +19 6,743 Minnesota 1,163 - 485,655 1.35% - 7,376,464 1,307,969 86,115 - 6,558 Wisconsin 1,106 - 564,592 1.14% - 3,196,304 548,964 96,968 - 6,440 Colorado 1,035 - 430,615 1.38% - 2,585,390 448,951 74,776 - 5,959 Iowa 1,743 - 364,892 1.51% - 4,088,220 1,295,762 115,653 - 5,498 Arkansas 1,741 - 322,949 1.63% - 3,169,449 1,050,243 107,014 - 5,254 Washington 664 - 344,660 1.47% - 5,301,508 696,203 45,261 - 5,059 Nevada 1,613 - 294,289 1.69% - 2,729,627 886,198 95,544 - 4,967 Kansas 1,630 - 296,954 1.60% - 1,259,105 432,190 101,930 - 4,750 Kentucky 1,046 - 406,201 1.15% - 4,521,249 1,011,992 90,920 - 4,671 Oklahoma 1,146 - 424,999 1.07% - 3,516,251 888,622 107,405 - 4,534 New Mexico 1,784 - 185,542 2.02% - 2,710,151 1,292,500 88,487 - 3,740 Rhode Island 2,384 - 126,849 1.99% - 3,022,306 2,852,952 119,741 - 2,525 West Virginia 1,292 - 132,416 1.74% - 2,198,226 1,230,020 74,094 +8 2,309 Oregon 528 - 156,037 1.43% - 3,760,400 891,568 36,995 - 2,225 Nebraska 1,077 - 201,346 1.04% - 967,551 500,179 104,087 - 2,084 Puerto Rico 641 - 183,432 1.12% - 464,073 145,309 57,436 +8 2,048 Utah 608 - 371,979 0.52% - 3,828,322 1,194,127 116,027 - 1,949 South Dakota 2,134 - 112,652 1.68% - 423,463 478,674 127,339 - 1,888 Idaho 1,044 - 171,836 1.09% - 1,092,871 609,839 95,887 - 1,871 North Dakota 1,899 - 99,957 1.45% - 405,387 531,961 131,166 - 1,447 Delaware 1,464 - 87,193 1.64% - 627,084 643,979 89,542 - 1,426 Montana 1,284 - 100,158 1.37% - 1,081,562 1,011,961 93,713 - 1,372 New Hampshire 860 - 75,803 1.54% - 1,662,742 1,222,864 55,749 - 1,170 District of Columbia 1,450 - 40,818 2.51% - 1,233,983 1,748,473 57,836 +4 1,023 Maine 524 - 45,091 1.56% - 1,871,610 1,392,347 33,545 +2 705 Wyoming 1,178 - 54,527 1.25% - 641,380 1,108,199 94,214 - 682 Hawaii 310 - 27,623 1.59% - 1,120,660 791,498 19,510 - 439 Alaska 409 - 56,428 0.53% - 1,704,660 2,330,219 77,135 - 299 Vermont 330 - 15,372 1.34% - 1,078,840 1,728,941 24,635 - 20 Coronavirus Updates (COVID-19) Deaths & Cases per 1M Population | RealClearPolitics
Coronavirus Updates (COVID-19) Deaths & Cases per Population | RealClearPolitics
Guess who is on top for deaths per capita, Trump country.
You people are liars, you are stupid and you are disgusting. Other than that you are good people.
Total Deaths and Death Rates per 100,000 Population | KFF State Health Facts
State level data on Total Deaths and Death Rates per 100,000 Population from KFF, the leading health policy organization in the U.S.
View attachment 463728Population density
Go figure
You're full of shit. Texas and Florida are larger than New York and have major population centers.
Fake news is your lifeUnited States COVID - Coronavirus Statistics - Worldometer
United States Coronavirus update with statistics and graphs: total and new cases, deaths per day, mortality and recovery rates, current active cases, recoveries, trends and timeline.
Yesterday 275 people died of coronavirus in Texas.
That's more than New York, New Jersey and Connecticut combined.
(watch the loons piss their pink panties)
Do the populations of illiterate, ignorant, careless dark people have anything to do with it?
Community, Work, and School
Actions that communities can take to slow the spread of COVID-19.
weird how it's only in white countries this is a problem....?
*looks at the third world*
haha the projection
let the chinese lead you around by the nose then blame the darkies? What teh **** are you smoking ******? This is your people's fault
Argue the data with the CDC raghead.
Community, Work, and School
Actions that communities can take to slow the spread of COVID-19.
What data?
I'm an Asian we get better results on everything than whites
Have like an 80% acceptance rate for the vaccine. We are the model minority you ******* dolt. And not very fat
While white trash like you are busying cookin meth and suckin pecker for oxyColonelanus does not know the difference between a novel virus and a virus. I will not waste my time explaining. Not only the difference but the implications.Actually the argument that masks don't work, is the same as claimning seatbelts don't work.Covid is more contagiousSo explain why the masks and social distancing have not worked on COVID.
Is it though? 28 total influenza cases? Florida has been wide open since May.
Are you contending there should not be any influenza cases where everything is open and there is no mask mandates?
Well neither works if you don't wear them right or don't wear them at all.
DUH !!!
If we have eradicated influenza by wearing masks and social distancing and closing all businesses, we need to do it every flu season.
How do all these dumbass Trump minions survive. They are so fricking stupid they do not know the difference between shit and Shinola.
FYI, in the future do not say "neither do you" which implies we both do not know. Oh my you people are stupid.
I said, neither do you.
Now tell me where I was included in any of that. you're such a fkwad. You must have to wipe yourself hourly.
You are a horses ass for throwing your fellow minion, Colonelanus, under the bus as not knowing the difference between a novel virus and a virus and the implications.
Jshit, why don't you tell us the difference between a novel virus and a virus and the implications.