ScienceRocks
Democrat all the way!
- Banned
- #1
Lets look at the IPCC 4th assement models against reality
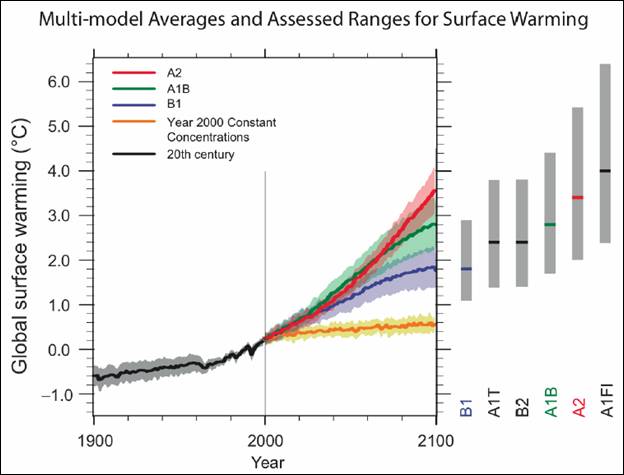
Figure 2: Solid lines are multi-model global averages of surface warming (relative to 1980–1999) for the scenarios A2, A1B, and B1, shown as continuations of the 20th century simulations. Shading denotes the ±1 standard deviation range of individual model annual averages. The orange line is for the experiment where concentrations were held constant at year 2000 values. The grey bars at right indicate the best estimate (solid line within each bar) and the likely range assessed for the six SRES marker scenarios.
A2 is slightly lower in rate during the next 20 years. Most likely caused by sulfurs, but ends the highest at 2100 as the level of co2 increases as the sulfur, aerosals decrease.
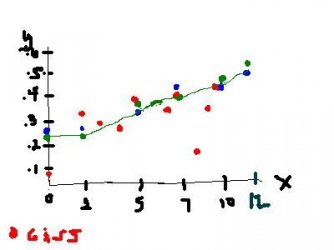
This is on a 1980-1999 baseline, so we have to match the giss record to that....
------What occurred, A2, A1b1
2002 .33c, .262c, .272c
2005 .37c .349c .339c
2007 .37c .373c .401c
2010 .40c, .423c, .408c
Model data
http://www.ipcc-data.org/data/ar4_multimodel_globalmean_tas.txt
2010 giss
Data.GISS: GISS Surface Temperature Analysis
2005
Data.GISS: GISS Surface Temperature Analysis
2007
Data.GISS: GISS Surface Temperature Analysis
Here are some predictions from the ipcc models
Year, A1b1, A2
2012 0.516 0.461
2015 0.546 0.526
2018 0.605 0.553
2020 0.684 0.615
2030 0.944 0.809
I'd likely go with A2...Why, because it is handling the aerosals much better as are emissions put out sulfur at the rate we're increasing them. I'd also wouldn't judge these models from anomaly's like 1998, 2008, 2011.
---A2 is lower throughout mid century even with higher emissions for this reason. I expect it is right. Aerosals for the next 20-30 years will hold it down. Longer term 2060 onwards A2 with higher emissions over takes A1b1. http://www.ipcc.ch/graphics/2001wg1/large/01.33.jpg
Here is the emissions. We're close to A2.
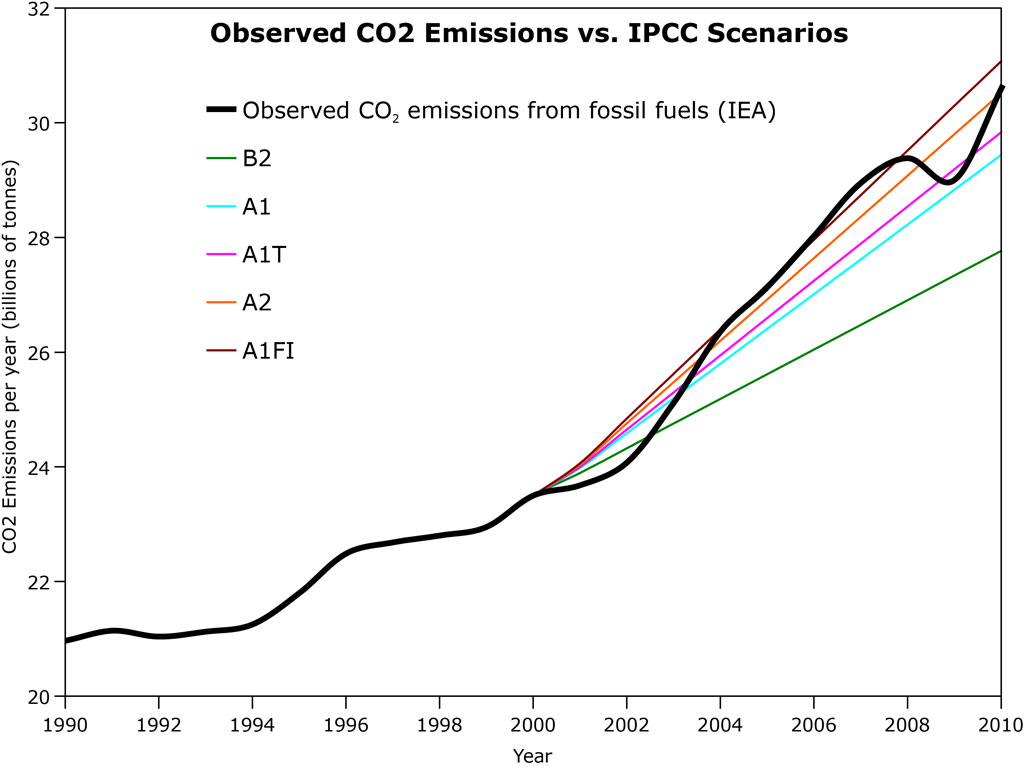
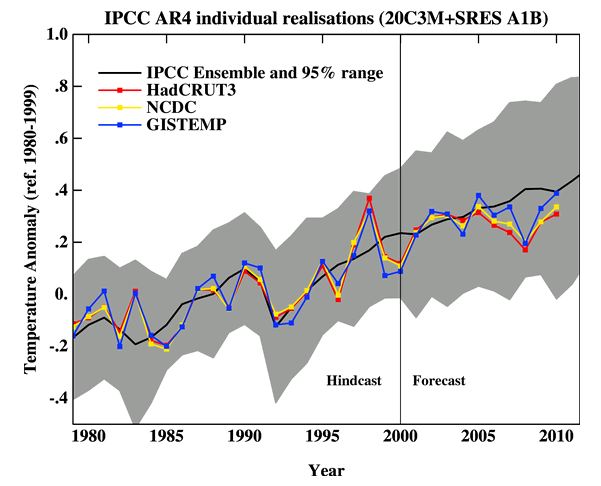
Figure 2: Solid lines are multi-model global averages of surface warming (relative to 1980–1999) for the scenarios A2, A1B, and B1, shown as continuations of the 20th century simulations. Shading denotes the ±1 standard deviation range of individual model annual averages. The orange line is for the experiment where concentrations were held constant at year 2000 values. The grey bars at right indicate the best estimate (solid line within each bar) and the likely range assessed for the six SRES marker scenarios.
A2 is slightly lower in rate during the next 20 years. Most likely caused by sulfurs, but ends the highest at 2100 as the level of co2 increases as the sulfur, aerosals decrease.
This is on a 1980-1999 baseline, so we have to match the giss record to that....
------What occurred, A2, A1b1
2002 .33c, .262c, .272c
2005 .37c .349c .339c
2007 .37c .373c .401c
2010 .40c, .423c, .408c
Model data
http://www.ipcc-data.org/data/ar4_multimodel_globalmean_tas.txt
2010 giss
Data.GISS: GISS Surface Temperature Analysis
2005
Data.GISS: GISS Surface Temperature Analysis
2007
Data.GISS: GISS Surface Temperature Analysis
Here are some predictions from the ipcc models
Year, A1b1, A2
2012 0.516 0.461
2015 0.546 0.526
2018 0.605 0.553
2020 0.684 0.615
2030 0.944 0.809
I'd likely go with A2...Why, because it is handling the aerosals much better as are emissions put out sulfur at the rate we're increasing them. I'd also wouldn't judge these models from anomaly's like 1998, 2008, 2011.
---A2 is lower throughout mid century even with higher emissions for this reason. I expect it is right. Aerosals for the next 20-30 years will hold it down. Longer term 2060 onwards A2 with higher emissions over takes A1b1. http://www.ipcc.ch/graphics/2001wg1/large/01.33.jpg
Here is the emissions. We're close to A2.
Last edited: