A new NASA study says that an increase in Antarctic snow accumulation that began 10,000 years ago is currently adding enough ice to the continent to outweigh the increased losses from its thinning glaciers.

science.nasa.gov
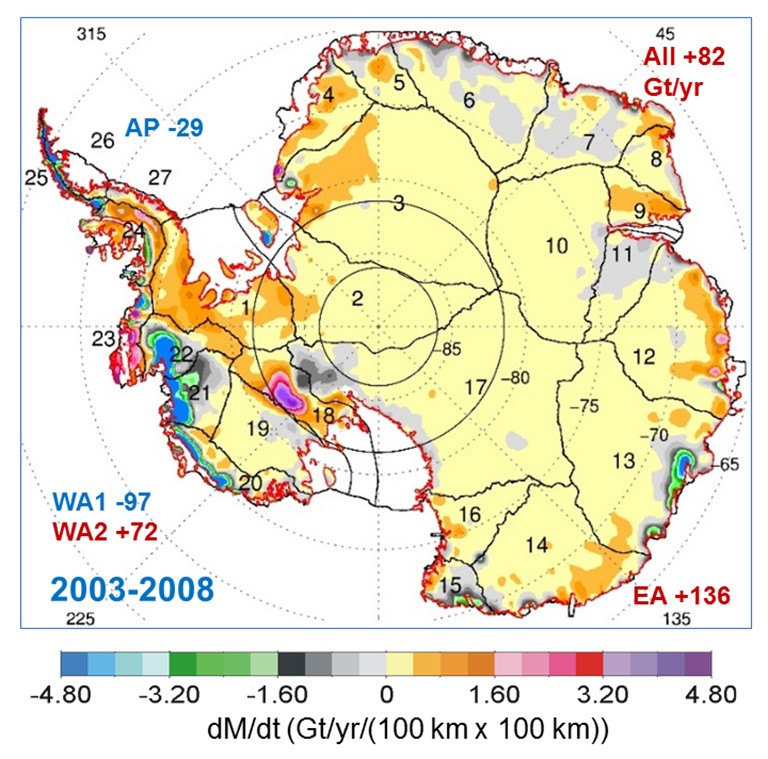
"the Antarctic ice sheet showed a net gain of 112 billion tons of ice a year from 1992 to 2001. That net gain slowed to 82 billion tons of ice per year between 2003 and 2008."
“The good news is that Antarctica is not currently contributing to sea level rise, but is taking 0.23 millimeters per year away,” Zwally said. “But this is also bad news. If the 0.27 millimeters per year of sea level rise attributed to Antarctica in the IPCC report is not really coming from Antarctica, there must be some other contribution to sea level rise that is not accounted for.”
LOL!!!..... or, IPCC is just fudging data and lying....
Here's something American media are virtually guaranteed to not report: a British court has determined that Al Gore's schlockumentary "An Inconvenient Truth" contains at least eleven material falsehoods. It seems a safe bet Matt Lauer and Diane Sawyer won't be discussing this Tuesday morning...

www.newsbusters.org
- The film suggests that the Antarctic ice covering is melting, the evidence was that it is in fact increasing.