Giss for Nov reports that we had the warmest November in recorded history

Pretty much all of Russia and Antarctica was far above avg in Nov.

ncep_cfsr_t2m_anom_112013.png
 
Satellite data for Russia is nowhere near as spiked as the NOAA reports on thermometer data.

In addition the Sat data has
UAH Nov 2013 9th warmest Nov (0.20 C cooler than warmest Nov.)

RSS Nov 2013 16th warmest Nov (0.22 C cooler than warmest Nov.)

uah_november-2013-map.jpg
 
I'd trust the Giss and noaa that shown nov to be the hottest.

Even the Hadley center said 3rd...

Modern 21st Century technology says Nov 2013 was nothing special. I'll go with ONE thermometer in the sky looking at the ENTIRE globe, Rather than 1000s of people fucking with data and MAKING UP data for places that have none.

Dont know man.... But something tells me that th latter choice just doesnt have the 0.01 accuracy worth fighting over.. BUT PLEASE DO SO if you have to.
 
Toasty November Vaults 2013 Into Top 5 Warmest Years

Toasty November Vaults 2013 Into Top 5 Warmest Years | Climate Central

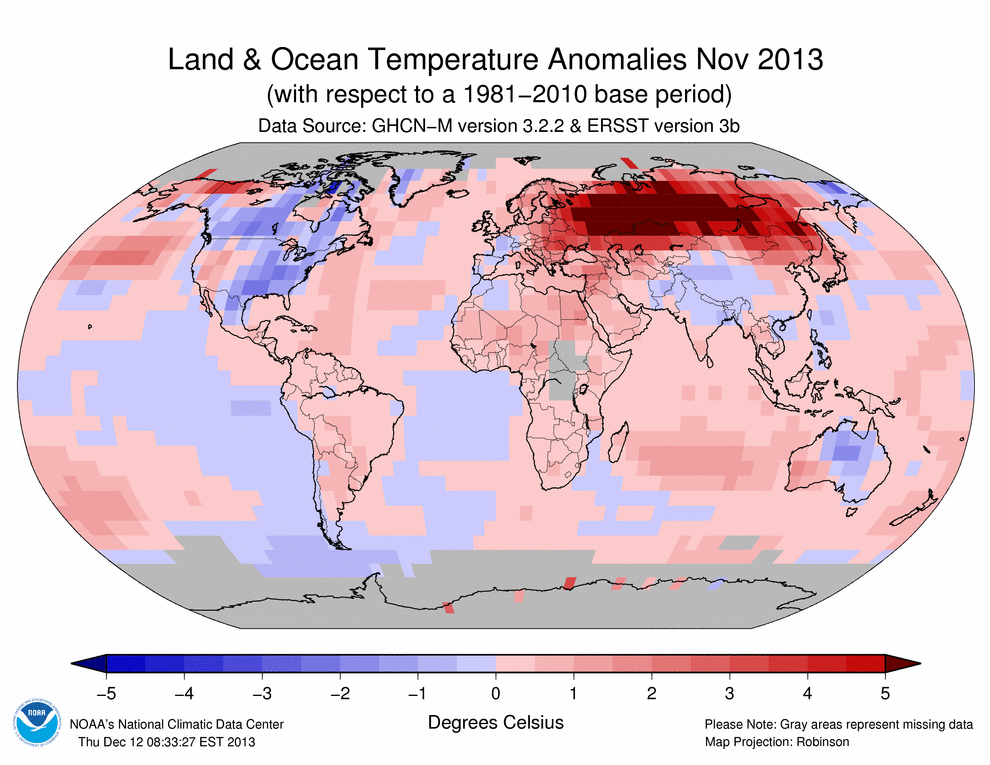
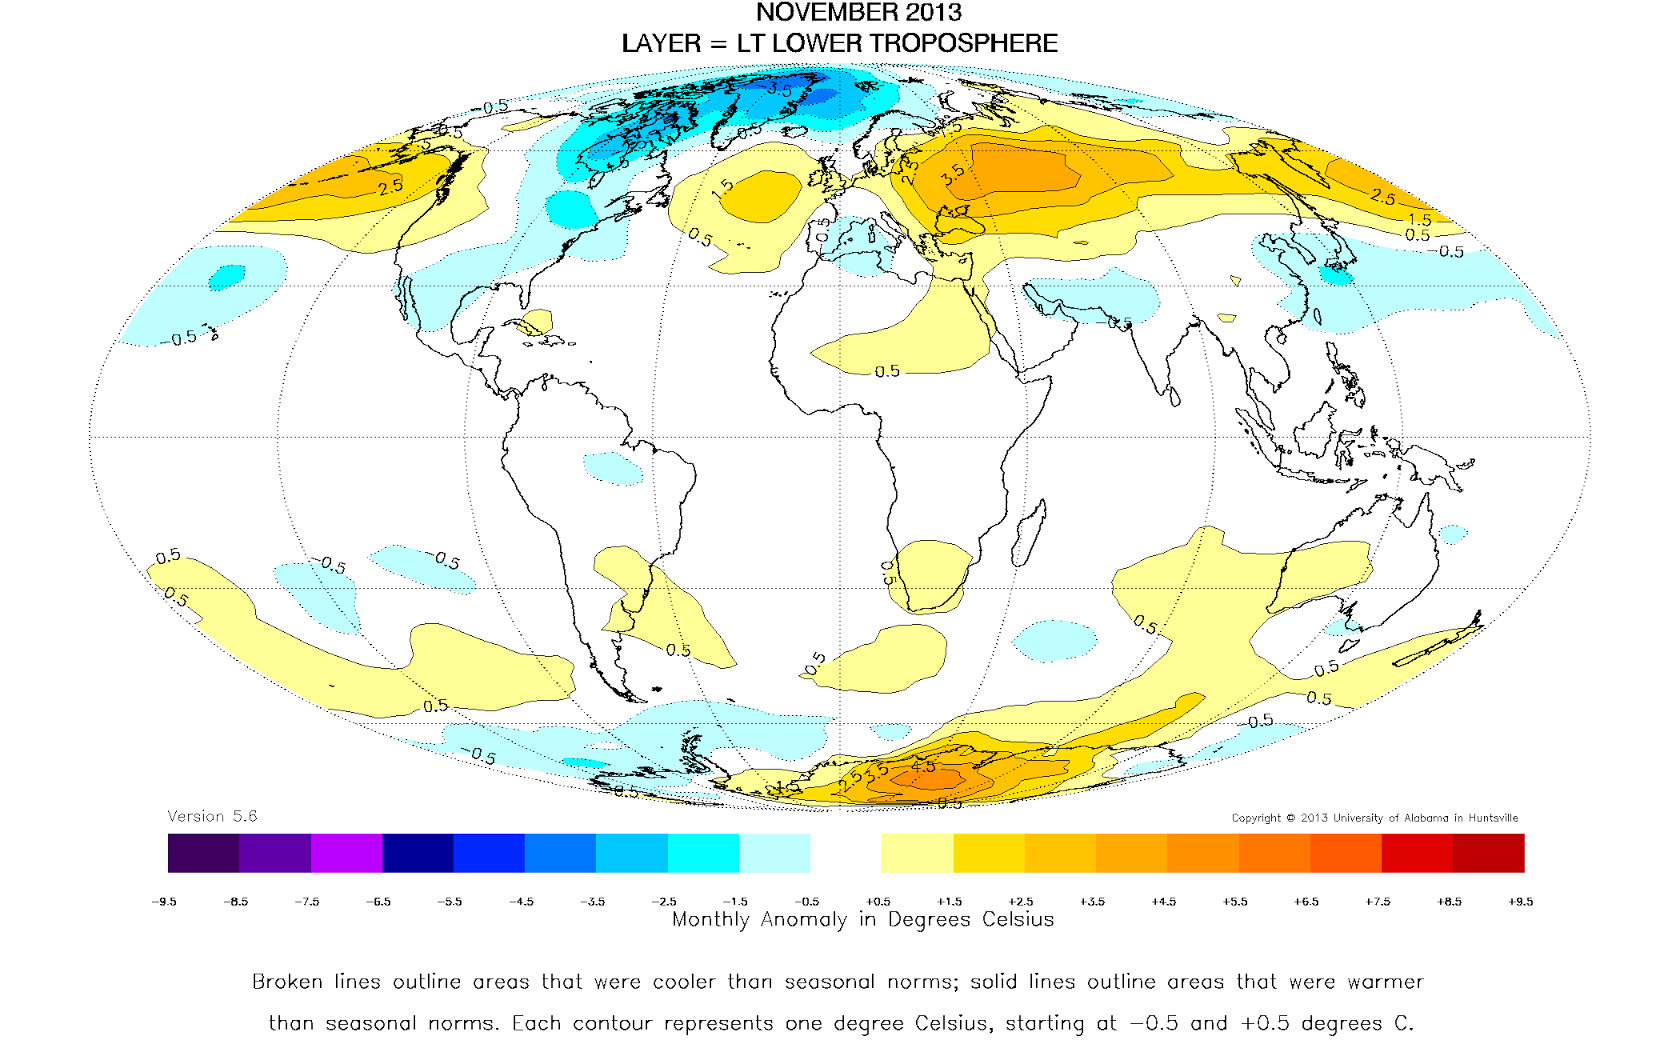
Last month was the warmest November since record-keeping began 134 years ago, the National Oceanic and Atmospheric Administration (NOAA) reported Tuesday. The latest data, combined with more recently reported by NASA, showed a record global average surface temperature for November, particularly in Eurasia, where Russia experienced its warmest November in history.

According to NOAA, the global average surface temperature for November was 1.4°F above the long-term average for the month, and much of Russia, northwest Kazakhstan, south India, southern Madagascar, parts of the central and south Indian Ocean, and areas of the Pacific Ocean were record warm. That surpassed the previous record-holder of November 2004 by 0.05°F, and is the 6th-highest monthly departure from average of any month on record, according to NOAA.

Russia had its warmest November since records began there in 1891, with some parts of the country, including Siberia and the Arctic islands in the Kara Sea, seeing temperatures that were more than 14°F above the typical monthly average.

In contrast, not a single region of the globe was record cold for the month, NOAA said. The only areas that were cooler than average were northern Australia, parts of North America, southwest Greenland, and parts of the Southern Ocean near South America.

According to NOAA, November's warmth catapulted the year-to-date to the 4th warmest year on record, up from the 7th warmest, which is where it stood as of the end of October. That puts 2013 on track to be the warmest year on record without an El Niño event, depending on where December temperatures rank.

El Niño events feature warmer-than-average ocean temperatures in the tropical Pacific Ocean and tend to alter weather patterns and ocean currents in ways that provide an added boost — on top of manmade global warming and other climate cycles — to global average surface temperatures. NOAA said that while milder-than-average global ocean conditions contributed to November's record warm, the month was the 19th straight without an El Niño or La Niña event present in the tropical Pacific Ocean.

Each of the top three years in NOAA’s dataset — 2010, 2005, and 1998, respectively — were El Niño years or exhibited the lingering effects of an El Niño.

The additional heat injected into the climate system from El Niño events accentuates the impacts of long-term global warming from manmade emissions of greenhouse gases and other causes. Although most climate outlooks show the continued absence of El Niño through the spring of 2014, should El Niño conditions develop at some point in the new year, it will increase the likelihood that 2014 will set a new global temperature record.
 
So now weve ddiscounted this NOVEMBER dealy from the Warmestt ever to maybe 3rd or 5th or 8th.

if all that aint an incedible waste of brain power, I dont know what is.. Rather watch 20 hour Duck Dynasty marathon..
 
I am not disputing the atmospheric temperature pause in global temperature since 1998....1. aerosols from china and the developing world are blocking the energy in the same way as the US and Europe did during the 1950s-1970s. 2. Pdo, enso is absorbing the energy...Looking at the graph and you will see that we had a + enso during 2001-2007 and - one since that time. The 1990's had a eruption that was the biggest in 200+ years and gave the appearance of .2c per decade warming.

I don't believe we have ever had + forcing stronger then .14 to .15c per decade.

28744d1387357519-dec-update-of-the-global-temperature-trend-uah.png


This graph I made a avg on is ignoring the short term crap like the volcano and 1998.
 
Last edited:
Still the AGW cultists still have not posted the datasets with source code to prove that CO2 drives climate.

Does CO2 always correlate with temperature (and if not, why not?)

Figure 4: Green line is carbon dioxide levels from ice cores obtained at Law Dome, East Antarctica (CDIAC). Blue line is carbon dioxide levels measured at Mauna Loa, Hawaii (NOAA). Red line is annual global temperature anomaly (GISS)

Figure 4 compares CO2 to global temperatures over the past century. While CO2 is rising from 1940 to 1970, global temperatures show a cooling trend. This is a 30 year period, longer than can be explained by internal variability from ENSO and solar cycles. If CO2 causes warming, why isn't global temperature rising over this period? To answer this, one needs to recognise that CO2 is not the only driver of climate. There are a number of factors which affect the net energy flow into our climate. Stratospheric aerosols (eg - from volcanic eruptions) reflect sunlight back into space, causing cooling. When solar activity increases, the amount of energy flowing into our climate increases. Figure 5 shows a composite of the various radiative forcings that affect climate.

When all the forcings are combined in Figure 6, the net forcing shows good correlation to global temperature. There is still internal variability superimposed on the temperature record due to short term cycles like ENSO. The main discrepancy is a decade centered around 1940. This is thought to be due to a warming bias introduced by US ships measuring engine intake temperature.

Yes you know how to post AGW cultist propaganda.

Still no datasets with source code to prove that CO2 drives climate.
 
I know it is a waste of time but let me try again.

We warmed about a 3rd of a degree over 15 to 20 years. That means all temperatures after that PERMANENT warming will be higher then BEFORE the warming.

Comparing temps to the years before the warm is a waste of time, of course the new years will be warmer. The Temperature went up so after that all temps will be warmer on average.

What has NOT happened is the warming trend did not continue. Since 1998 there has been no raise in global average temperatures.

So please quit claiming the new era is hotter then the old, we already KNOW that. it has been 15 years since the last increase and of course those 15 years are going to be warmer then the years before 1998.
 

CFC have been banned and Cosmic rays haven't increased to explain the warming.

What's the link between cosmic rays and climate change?

1_GCRsvsTemps.jpg


The galactic cosmic ray (GCR) warming hypothesis is based on the premise that GCRs can "seed" clouds, and clouds reflect sunilight. So if there are fewer GCRs reaching Earth (because a strong solar magnetic field is deflecting them away), the hypothesis says there will be fewer clouds, more sunlight reaching the Earth's surface, and thus more global warming.

So more solar activity means a stronger solar magnetic field, which means fewer GCRs reaching Earth, which hypothetically means fewer clouds and more warming.

The body of scientific research has determined that GCRs are actually not very effective at seeding clouds. However, the hypothesis is also disproven just by examining the data. Over the past five decades, the number of GCRs reaching Earth has increased, and in recent years reached record high numbers. This means that if the GCR-warming hypothesis is correct, this increase in GCRs should actually be causing global cooling over the past five decades, and particularly cold temperatures in recent years.

Annual average GCR counts per minute (blue - note that numbers decrease going up the left vertical axis, because lower GCRs should mean higher temperatures) from the Neutron Monitor Database vs. annual average global surface temperature (red, right vertical axis) from NOAA NCDC, both with second order polynomial fits.
 
Last edited:

Forum List

Back
Top