Carl Sagan in 1985, addressing the UN on anthropogenic climate change

You gotta love Carl Sagan. He's like an early version of Anthony Fauci. Remember the time he wanted to detonate an atomic bomb on the moon to show the Soviets who was boss?


That was not Sagan's idea. Sagan was a graduate student at the time and was brought on to do the math of dust cloud expansion on the Moon. So thank you for the misleading contribution.

Sagan did think it could be useful for studying microbes in lunar dust. But this project was a product of its time.

I honestly did not think anyone would be silly enough to try to smear such a fine man. I forgot which board I was on.
 
Last edited:
That was not Sagan's idea. Sagan was a graduate student at the time and was brought on to do the math of dust cloud expansion on the Moon. So thank you for the useless and misleading contribution.
Did Sagan have any empirical evidence which quantified the radiative forcing of CO2 from 300 ppm to 420 ppm?

Because you are avoiding that question like it's got covid.

Let me answer it for you... no. Carl Sagan did not have any empirical evidence which quantified the radiative forcing of CO2 from 300 ppm to 420 ppm. It's like the answer to the question how many french guys does it take to defend Paris? No one knows. It's never been done before. Same thing for empirical evidence which quantified the radiative forcing of CO2 from 300 ppm to 420. It's never been done before. Now you know.
 
Show a mechanism by which the greenhouse effect does act to not warm the earth.
It seems you are trying to imply that since all greenhouse gases act to warm the planet that rising atmospheric CO2 must be responsible for the warming trend. That's an equivocation (which is the use of ambiguous language to conceal the truth or to avoid committing oneself). The reality is it's not that simple. Relative to water vapor CO2 is a minor greenhouse gas. There is no empirical evidence which quantifies the radiative forcing of CO2 from 300 ppm to 420 ppm. CO2 has never been shown to drive climate change in the geologic record. In fact, the geologic record shows that CO2 trails temperature changes. So your implication that CO2 must be responsible for the current warming trend is false. It's more complicated than that.
 
Scientists clearly understood the basic mechanisms of the greenhouse effect and were surprisingly accurate in their warnings 40 years ago. They had already laid all the groundwork for this new field of science (ACC), in their study of past earth climate adtheir study of the other bodies in our solar system. A lot of people don't know this. The concerns about Earth's climate arose from what they learned about the physics of the greenhouse effect and about past climate and the climate on other bodies in our solar system. Not the other way around.

So far the predictions have come to pass. Scientists abhor being "right for the wrong reasons" and so have added evidence and understanding to ACC theory every single day. It has become possibly the most well studied scientific subject and one of the most robust scientific theories in history.
 
Like what?
Rapid increase in the amount of heat trapped by our atmosphere and ocean, acidification of the oceans.This is the basic theory. Supported by all the evidence, and yields useful predictions. As good theories do.
 
I don't know what strain of weed the OP is smoking, but the IPCC's predictions have not been very accurate. In fact it got so bad that they just admitted that their models are producing implausibly hot forecasts and have grown a little too alarmist.

 
, but the IPCC's predictions have not been very accurate. In
This is, of course, a lie fed to deniers by paid liars who need to keep them stupid and angry and voting.. In reality, the IPCC's basic predictions from the theoretical work available 30 years ago have come to be true.


"Carbon dioxide concentrations in the atmosphere stood at 354 ppm when the first IPCC report was issued. They are now 412 ppm. The rise in carbon dioxide levels has pushed Earth's temperature from 0.7 degrees Celsius (1.3 degrees Fahrenheit) above pre-industrial levels in 1990 to 1.3 degrees Celsius (2.3 degrees Fahrenheit) in 2020. This change was not only predictable - it was predicted by scientists and reported in the 1990 IPCC report."
 
Last edited:
What the deniers and charlatans don't understand (and don't care to understand) is that the predictions made by IPCC are contingent on the actions of mankind. If this, then this. If we curtail emissions, thenA. If we do not, then B. We chose to ignore the advice of scientists and chose to accelerate our emissions. And what the IPCC predicted in this scenario has come to pass. Which is not surprising, given that the effect of carbon emissions on global mean temperature was already very well known in 1990.
 
Last edited:
One of the parlor tricks the denier cottage industry uses to fool willing rubes like ding is "cherry picking". Here is an example:

Cherry Picking​

Most claims that the IPCC models have failed are based on surface temperature changes over the past 15 years (1998–2012). During that period, temperatures have risen about 50 percent more slowly than the multi-model average, but have remained within the range of individual model simulation runs.

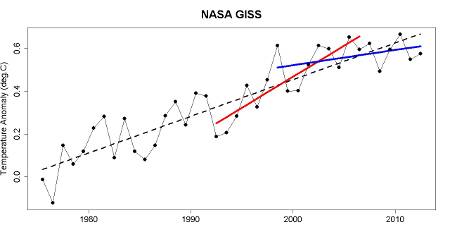
However, 1998 represented an abnormally hot year at the Earth's surface due to one of the strongest El Niño events of the 20th century. Thus it represents a poor choice of a starting date to analyze the surface warming trend (selectively choosing convenient start and/or end points is also known as 'cherry picking'). For example, we can select a different 15-year period, 1992–2006, and find a surface warming trend nearly 50 percent faster than the multi-model average, as statistician Tamino helpfully illustrates in the figure below.

Fast warming trend 1992–2006, slow warming trend 1997–2012

Global surface temperature data 1975–2012 from NASA with a linear trend (black), with trends for 1992–2006 (red) and 1998–2012 (blue).
In short, if climate contrarians weren't declaring that global surface warming was accelerating out of control in 2006, then he has no business declaring that global surface warming has 'paused' in 2013. Both statements are equally wrong, based on cherry picking noisy short-term data.

 
Furthermore, IPCC has always been very conservative in their estimates. They are essentially providing actionable intelligence to governments and private industry. In doing so, they have to be clear about what is a very safe bet and when there is more uncertainty, as these entities will not make risky bets.

As such, the global scientific community is trying to convey the message that simply doing the minimum to address the minimum "guarantees" by IPCC is foolish and may, itself, be counterproductive. We don't get a "do over". We have limited time and limited resources.

As it turns out, the most accurate models available predict more warming than the safe bets compiled by the IPCC.

 
Last edited:
This is, of course, a lie fed to deniers by paid liars who need to keep them stupid and angry and voting.. In reality, the IPCC's basic predictions from the theoretical work available 30 years ago have come to be true.


"Carbon dioxide concentrations in the atmosphere stood at 354 ppm when the first IPCC report was issued. They are now 412 ppm. The rise in carbon dioxide levels has pushed Earth's temperature from 0.7 degrees Celsius (1.3 degrees Fahrenheit) above pre-industrial levels in 1990 to 1.3 degrees Celsius (2.3 degrees Fahrenheit) in 2020. This change was not only predictable - it was predicted by scientists and reported in the 1990 IPCC report."
I like how you edited out the part that the UN climate panel has admitted that the IPCC models are producing implausibly hot forecasts and have grown a little too alarmist, and believe that wasn't dishonest of you. So this link is for you.


I also like how you provide one data point and think that's acceptable and not dishonest. So this table is for you.
1638051784513.png


Now let me address a couple of other dishonest points. Their reference point is the coldest period prior to the industrial revolution which is dishonest. We are in an interglacial cycle which is still 2C below the peak temperature of previous interglacial cycles. So the honest thing to do would have been to pick the warmest point prior to the industrial revolution as a reference point. Doind so yields an increase of 0.8C over the last 1,000 years.

The problem with using that reference point is that 0.8C for a 300 ppm to a 420 ppm atmospheric CO2 concentration only yield half of the predicted associated temperature of the radiative forcing equation. Never mind the positive feedback they pile on which are unsupported by any data.

If they had used the correct reference point (same CO2 reading in the year 1000 as there was in the year 1750) their model predictions would be historically inaccurate and laughed at by even you.

Now let me tell you about the urban heat effect which is real. Temperatures in rural measurement stations do not show the same temperature increases that temperatures from urban measurement stations are showing. That's because there is no urban heat island effect skewing the data of the rural measurement stations. So by including temperatures from urban measurement stations they are in effect attributing the urban heat island effect to CO2 which is dishonest.

Now let me tell you about the solar output they are using in their models. They are using solar output from the low variability dataset instead of the high variability dataset used by the team in charge of NASA’s ACRIM sun-monitoring satellites. This effectively eliminates the sun as a source for the warming trend of the last few decades which is dishonest.

If they had excluded the urban heat island effect and used the the high variability dataset used by the team in charge of NASA’s ACRIM sun-monitoring satellites their models would have shown that the warming trend is from sun and not CO2. Which makes perfect sense given that we are in an interglacial cycle and are 2C below the peak temperature of previous interglacial cycles.
 
What the deniers and charlatans don't understand (and don't care to understand) is that the predictions made by IPCC are contingent on the actions of mankind. If this, then this. If we curtail emissions, thenA. If we do not, then B. We chose to ignore the advice of scientists and chose to accelerate our emissions. And what the IPCC predicted in this scenario has come to pass. Which is not surprising, given that the effect of carbon emissions on global mean temperature was already very well known in 1990.
Within 30 years everything you believe will be proven wrong by colder temperatures.

It seems their case for CO2 driving climate change is based upon the fact that CO2 is a greenhouse gas and that temperatures have been rising. The problem is that CO2 is a minor greenhouse gas, the rate of sea level rise has not changed and temperatures are still below the peak temperatures of previous interglacials. So it would be expected for temperatures to rise as we have not yet completed the interglacial cycle.

They will argue that the rate temperatures are rising is unprecedented. Unfortunately that's not true. 25 D-O events during the last glacial cycle show that temperatures rose from glacial temperatures to interglacial temperatures - 5C swings up and down - over the course of a few decades. That's even on NASA's website.

Here's what's really happening... we entered an ice age 2.7 million years ago. You can see the slope change on the oxygen isotope curve which is the well established proxy for temperatures. No one disputes the curve. The drivers were a gradually cooling of the planet coupled with the polar regions being isolated from warm marine currents; the south pole has a continent parked on top of it and the north pole has a mostly landlocked ocean on top of it. Also the rise of the Himalayas and the Panama isthmus. All these things changed the circulation patterns of the atmosphere and the ocean, but the biggest driver was both polar regions being isolated from the warmer marine currents.

But the glaciation threshold is different for each pole. Because the south pole has a continent parked on top of it, the southern hemisphere has a lower threshold for extensive continental glaciation than the northern hemisphere does because the north pole has an ocean parked over it. It is this difference which created increased climate fluctuation and environmental uncertainty on the earth. It is the northern hemisphere which dominates the climate of the earth. The coolest average temperatures occurs when the northern hemisphere is in winter and the warmest average temperatures occur when the northern hemisphere is in summer. Again... that's even on NASA's website.

You can see from ice cores during the last glacial cycle how much more erratic temperatures were in the northern hemisphere. By the way these are the D-O events from the Greenland ice cores. My point is that it is not unusual for there to be large temperature swings because that is the signature of the present ice age. We live in a period of bipolar glaciation. Never before has the earth been configured for bipolar glaciation. It is because we have bipolar glaciation where the poles do not have the same glaciation threshold that has led to increased climate fluctuation and environmental uncertainty on the earth. They have mistakenly correlated a period of warming and associated it with an increase from a minor greenhouse gas.

Here's the oxygen isotope curve.
F2 annotated.jpg


Here is a zoomed in view of the oxygen isotope curve showing the transition from a greenhouse planet to an icehouse planet which clearly shows the increased climate fluctuation and environmental uncertainty of the earth's climate.

transition to icehouse.png


And here is the climate data from the southern and northern hemisphere ice cores for the last glacial period where you can clearly see how much more erratic the climate of the northern hemisphere was compared to the southern hemisphere.

1630631739732.png
 
One of the parlor tricks the denier cottage industry uses to fool willing rubes like ding is "cherry picking". Here is an example:

Cherry Picking​

Most claims that the IPCC models have failed are based on surface temperature changes over the past 15 years (1998–2012). During that period, temperatures have risen about 50 percent more slowly than the multi-model average, but have remained within the range of individual model simulation runs.

However, 1998 represented an abnormally hot year at the Earth's surface due to one of the strongest El Niño events of the 20th century. Thus it represents a poor choice of a starting date to analyze the surface warming trend (selectively choosing convenient start and/or end points is also known as 'cherry picking'). For example, we can select a different 15-year period, 1992–2006, and find a surface warming trend nearly 50 percent faster than the multi-model average, as statistician Tamino helpfully illustrates in the figure below.

Fast warming trend 1992–2006, slow warming trend 1997–2012

Global surface temperature data 1975–2012 from NASA with a linear trend (black), with trends for 1992–2006 (red) and 1998–2012 (blue).
In short, if climate contrarians weren't declaring that global surface warming was accelerating out of control in 2006, then he has no business declaring that global surface warming has 'paused' in 2013. Both statements are equally wrong, based on cherry picking noisy short-term data.

Scientists come to opposite conclusions about the causes of recent climate change depending on which datasets they consider. For instance, the panels on the left lead to the conclusion that global temperature changes since the mid-19th century have been mostly due to human-caused emissions, especially carbon dioxide (CO2), i.e., the conclusion reached by the UN IPCC reports. In contrast, the panels on the right lead to the exact opposite conclusion, i.e., that the global temperature changes since the mid-19th century have been mostly due to natural cycles, chiefly long-term changes in the energy emitted by the Sun.


1632186412722.png


Both sets of panels are based on published scientific data, but each uses different datasets and assumptions. On the left, it is assumed that the available temperature records are unaffected by the urban heat island problem, and so all stations are used, whether urban or rural. On the right, only rural stations are used. Meanwhile, on the left, solar output is modeled using the low variability dataset that has been chosen for the IPCC’s upcoming (in 2021/2022) 6th Assessment Reports. This implies zero contribution from natural factors to the long-term warming. On the right, solar output is modeled using a high variability dataset used by the team in charge of NASA’s ACRIM sun-monitoring satellites. This implies that most, if not all, of the long-term temperature changes are due to natural factors.

Here is the link to the full paper.
ShieldSquare Captcha
 
Furthermore, IPCC has always been very conservative in their estimates. They are essentially providing actionable intelligence to governments and private industry. In doing so, they have to be clear about what is a very safe bet and when there is more uncertainty, as these entities will not make risky bets.

As such, the global scientific community is trying to convey the message that simply doing the minimum to address the minimum "guarantees" by IPCC is foolish and may, itself, be counterproductive. We don't get a "do over". We have limited time and limited resources.

As it turns out, the most accurate models available predict more warming than the safe bets compiled by the IPCC.

This table says otherwise.

1638053274044.png
 
Attempts by paid liars and their willing rubes to blog, equivocate, and copy-paste their way to undermining a robust scientific theory they don't even understand are not valid or useful and can be ignored. Until they produce mountains of evidence that contradict the theory, this is just all empty crybabying and snake oil sales pitch.

As it turns out, only one published study on the last 30+ years has drawn a conclusion that contradicts basic ACC theory. This single study was published just this year under dubious pretenses of peer review. It has since been retracted, and has not made it through rigorous peer review for republishing.

It doesn't take a scientists to understand THAT writing on the wall. The ONE contrarian, published study has apparently been undermined by its own falsities and dubious methods. While a new mountain of mutually supportive evidence is added in support of ACC Theory every year.

Clearly the deniers don't understand that they are losing the game eleventy trillion to zero. They fool themselves by regurgitating stuff they don't understand (like ding does) and using repetition and volume. Scientific theories are not upended this way.
People believe the world we live in today is normal. It's not. It's actually quite rare. The world we live in is considered to be an ice house planet. Our modern day ice house planet is characterized by bi-polar glaciation, glacial/interglacial cycles and a high latitudinal thermal gradient between the polar regions and the equators. No previous record for bi-polar glaciation exists in the geologic record.

2.7 million years ago we transitioned from a greenhouse planet to an ice house planet. Greenhouse planets are characterized by a lack of bi-polar glaciation and have a low latitudinal thermal gradient between the polar regions and the equator.

As you scroll through this sequence note the lack of ice in the northern hemisphere - except for the present day ice house planet we live in today of course.

sequence 1.jpg


sequence 2.jpg


sequence 3.jpg


Sequences were mapped using the Mollweide projection, and, in all cases, are by Ron Blakey.

What Did the Continents Look Like Millions of Years Ago?

An artist-geologist renders the history of the Earth with maps.
www.theatlantic.com
www.theatlantic.com
 
I would say you have shown us your ceiling in the science section, with this post.
I would say he was showing you his humor.

Empirical data shows the earth is warming. The OP assumes it is because atmospheric CO2 is increasing which is caused by increasing CO2 emissions. Correlation does not necessarily mean causation. The OP is ignoring the natural climate variability as a cause.

Willie Soon, at the Center for Environmental Research and Earth Sciences (CERES), who also has been researching sun/climate relationships at the Harvard-Smithsonian Center for Astrophysics (U.S.A.) since 1991: “We know that the Sun is the primary source of energy for the Earth’s atmosphere. So, it always was an obvious potential contributor to recent climate change. My own research over the last 31 years into the behavior of stars that are similar to our Sun, shows that solar variability is the norm, not the exception. For this reason, the Sun’s role in recent climate change should never have been as systematically undermined as it was by the IPCC’s reports. Hopefully, this systematic review of the many unresolved and ongoing challenges and complexities of Sun/climate relationships can help the scientific community return to a more comprehensive and realistic approach to understanding climate change.”

Richard C. Willson, Principal Investigator in charge of NASA’s ACRIM series of Sun-monitoring Total Solar Irradiance satellite experiments (U.S.A.):
“Contrary to the findings of the IPCC, scientific observations in recent decades have demonstrated that there is no ‘climate change crisis’. The concept that’s devolved into the failed CO2 anthropogenic global warming (CAGW) hypothesis is based on the flawed predictions of imprecise 1980’s vintage global circulation models that have failed to match observational data both since and prior to their fabrication. The Earth’s climate is determined primarily by the radiation it receives from the Sun. The amount of solar radiation the Earth receives has natural variabilities caused by both variations in the intrinsic amount of radiation emitted by the Sun and by variations in the Earth-Sun geometry caused by planetary rotational and orbital variations. Together these natural variations cause the Total Solar Irradiance (TSI) at the Earth to vary cyclically on a number of known periodicities that are synchronized with known past climatic changes.”


Hong Yan (晏宏), Professor of Geology and Paleoclimatology at the Institute of Earth Environment and Vice Director of the State Key Laboratory of Loess and Quaternary Geology in Xi’an, China: “Paleoclimate evidence has long been informing us of the large natural variations of local, regional and hemispheric climate on decadal, multidecadal to centennial timescales. This paper will be a great scientific guide on how we can study the broad topic of natural climatic changes from the unique perspective of external forcings by the Sun’s multi-scale and multi-wavelength impacts and responses.”

Connolly

Research in Astronomy and Astrophysics
www.raa-journal.org
www.raa-journal.org
 

Forum List

Back
Top