Arctic sea ice melting toward record

The most comprehensive modeling yet carried out on the likelihood of how much hotter the Earth's climate will get in this century shows that without rapid and massive action, the problem will be about twice as severe as previously estimated six years ago - and could be even worse than that.

The study uses the MIT Integrated Global Systems Model, a detailed computer simulation of global economic activity and climate processes that has been developed and refined by the Joint Program on the Science and Policy of Global Change since the early 1990s. The new research involved 400 runs of the model with each run using slight variations in input parameters, selected so that each run has about an equal probability of being correct based on present observations and knowledge. Other research groups have estimated the probabilities of various outcomes, based on variations in the physical response of the climate system itself. But the MIT model is the only one that interactively includes detailed treatment of possible changes in human activities as well - such as the degree of economic growth, with its associated energy use, in different countries.

Study co-author Ronald Prinn, the co-director of the Joint Program and director of MIT's Center for Global Change Science, says that, regarding global warming, it is important "to base our opinions and policies on the peer-reviewed science," he says. And in the peer-reviewed literature, the MIT model, unlike any other, looks in great detail at the effects of economic activity coupled with the effects of atmospheric, oceanic and biological systems. "In that sense, our work is unique," he says.

The new projections, published this month in the American Meteorological Society's Journal of Climate, indicate a median probability of surface warming of 5.2 degrees Celsius by 2100, with a 90% probability range of 3.5 to 7.4 degrees.

Climate change odds much worse than thought


Based on how inacurate the models have allways been I am not the slightest bit concerned.

I have no doubt you are smarter than the boys at MIT.

But I bet they can spell the word, "always."


Smarter than some not as smart as others. And yes allways has allways been a problem!:lol: I am afraid it is an artifice of my upbringing. Some day you may hear the tale....
 
More dishonesty by Si. No one ever claimed that CO2 was the only variable. In fact, it has been pointed out many times by the honest posters here that the TSI, NAO, and La Nina, El Nino oscilations all contribute to the variability of the weather.

Oh how quickly they forget their own mantra. You've been screaming till blood spattered us from your shredded vocal chords how we have to stop CO2. Nothing else would do. You typed your little fingers to skeletal nubs with fake science and bullshit activist links 'proving' that CO2 was the holy grail of climate change.

Now... not so much? buh?

Do you have a SHRED of intellectual integrity? Did you ever?


The answers are no and no.
 
Study: Arctic seabed methane stores destabilizing, venting

Study: Arctic seabed methane stores destabilizing, venting
March 4, 2010 A section of the Arctic Ocean seafloor that holds vast stores of frozen methane is showing signs of instability and widespread venting of the powerful greenhouse gas, according to the findings of an international research team led by University of Alaska Fairbanks scientists Natalia Shakhova and Igor Semiletov.


The research results, published in the March 5 edition of the journal Science, show that the permafrost under the East Siberian Arctic Shelf, long thought to be an impermeable barrier sealing in methane, is perforated and is leaking large amounts of methane into the atmosphere. Release of even a fraction of the methane stored in the shelf could trigger abrupt climate warming.

“The amount of methane currently coming out of the East Siberian Arctic Shelf is comparable to the amount coming out of the entire world’s oceans,” said Shakhova, a researcher at UAF’s International Arctic Research Center. “Subsea permafrost is losing its ability to be an impermeable cap.”
Sheesh

How many times do I have to explain that abrupt climate change is a natural event of the earth?

Hot Warm Cold, Cold Warm Hot!

How many times does someone have to explain it to you that you are a stupid, clueless bimbo who doesn't know shit about anything. Let alone anything scientific. You really ought to just shut your trap and stop making a fool out of yourself.
 
:D
For everyone concerned about the CO2 emissions causing global warming and Arctic Ice melting, try staying OFF the internet and cease the blogging in USMB! :D

Greening the Internet: How much CO2 does this article produce? - CNN.com
AND
A pair of Sun Fire T2000 servers draws 2*320Watts. Double that number for cooling and infrastructure, so you need 33628KWh in three years. That's 0.5KWh for every blog! One KWh electral power created in a coal power plant creates 1700 grams of CO2 - so the global warming effect of this blog is comparable to a runner running 21 kilometers (or sitting in front of his computer for one whole day).
Your CO2 footprint when using the internet : Rolf Kersten's Weblog
AND
A typical search through the online giant's website is thought to generate about 7g of carbon dioxide. Boiling a kettle produces about 15g.

Two Google searches 'produce same CO2 as boiling a kettle' - Telegraph
 
As somebody wrote recently. 97 percent of climatologists (note naysayers I say climatologists - you know the guys and gals who've spent every moment of their working lives studying this shit, not some Horray Henry's with an opinion and NOT scientists) said global warming is happening and humans are the cause of some of it. If 97 percent of doctors told you the food you were about to eat contained deadly toxins, would you eat it?

Only dumbarse right-wing Yanks say it ain't happening...wonder why...


It has NOT warmed in 10 years Dr.Grumps. The sciencist pretty much admitted that they where messing with the data in the emails. Where is this 2c going to come from since we're where during the 20th century at the highest solar output in 2,000 years and now fully out of the little ice age? Makes no sense. It is the heat island effect with that solar max period that made us warm up and now we have leveled off. I feel sorry for all those people that worked there whole lifes just to be feed shitty data. In fact that data was destroyed.

If there is global warming than more food for all. I doubt it.

Science don't give a fllying rats ass about the majority, but it does care about data and finding out what is right or wrong based on it. It is not political or numbers game in science.
 
Last edited:
As somebody wrote recently. 97 percent of climatologists (note naysayers I say climatologists - you know the guys and gals who've spent every moment of their working lives studying this shit, not some Horray Henry's with an opinion and NOT scientists) said global warming is happening and humans are the cause of some of it. If 97 percent of doctors told you the food you were about to eat contained deadly toxins, would you eat it?

Only dumbarse right-wing Yanks say it ain't happening...wonder why...


It has NOT warmed in 10 years Dr.Grumps. The sciencist pretty much admitted that they where messing with the data in the emails. Where is this 2c going to come from since we're where during the 20th century at the highest solar output in 2,000 years and now fully out of the little ice age? Makes no sense. It is the heat island effect with that solar max period that made us warm up and now we have leveled off. I feel sorry for all those people that worked there whole lifes just to be feed shitty data. In fact that data was destroyed.

If there is global warming than more food for all. I doubt it.

Science don't give a fllying rats ass about the majority, but it does care about data and finding out what is right or wrong based on it. It is not political or numbers game in science.

Hey, if you can prove your ascertains via climatologists, be my guest. I've read thread after thread on this board and others, and have yet to see a valid argument by naysayers. A lot of dodgy links, scientists (NOT climatologists) offering an opinion, but nothing solid.

In saying that, I'm not even saying global warming is a bad thing. It might be, it might not be....
 
As somebody wrote recently. 97 percent of climatologists (note naysayers I say climatologists - you know the guys and gals who've spent every moment of their working lives studying this shit, not some Horray Henry's with an opinion and NOT scientists) said global warming is happening and humans are the cause of some of it. If 97 percent of doctors told you the food you were about to eat contained deadly toxins, would you eat it?

Only dumbarse right-wing Yanks say it ain't happening...wonder why...

If you caught your doctor cooking the tests to make you think you had cancer when you are perfectly healthy, you would sue the shit out of him and have him criminally prosecuted. The same thing is happening here. The diagnosis is cancer, and the tests have been falsified to make it look that way so they can profiteer from the treatment to follow. They have shown their unsuspecting colleagues, who assuming the tests are true say "well if this is the case, of COURSE you have cancer!" Now it's show that every positive test is a LIE.

This from fraudulent data, massaged numbers and very very selective research designed to hide raw data and actual methodology, which when FINALLY exposed turns out to be deliberately designed to achieve a very particular result regardless of the data you enter.

If that's what you were presented with, yes, you'd believe it too.

ALL DATA PRE-CLIMATEGATE IS NOW SUSPECT. UNTIL PROVEN TO BE UNCORRUPTED AND ACCURATE MUST BE IGNORED AND REDONE.

There is your whole problem. Start over. Till then you get nothing. Nothing's going to happen in the next 30 years that we can do a thing about anyway. Okay, nothing in the next 3000 years will be anything we can do something about.
 
Last edited:
How many times does someone have to explain it to you that you are a stupid, clueless bimbo who doesn't know shit about anything. Let alone anything scientific. You really ought to just shut your trap and stop making a fool out of yourself.

Thanks pot. And my compliments back to you as well. :lol:
 
Sheesh

How many times do I have to explain that abrupt climate change is a natural event of the earth?

Hot Warm Cold, Cold Warm Hot!

Have you a Doctorate in climatology? If not, then perhaps you could post a link to someone that does who is saying just that.

Based on the people who have them, Doctorates in climatology are good for wiping your ass and very little else.

Based on that comment, your brains are good for wiping your ass and very little else.
 
The most comprehensive modeling yet carried out on the likelihood of how much hotter the Earth's climate will get in this century shows that without rapid and massive action, the problem will be about twice as severe as previously estimated six years ago - and could be even worse than that.

The study uses the MIT Integrated Global Systems Model, a detailed computer simulation of global economic activity and climate processes that has been developed and refined by the Joint Program on the Science and Policy of Global Change since the early 1990s. The new research involved 400 runs of the model with each run using slight variations in input parameters, selected so that each run has about an equal probability of being correct based on present observations and knowledge. Other research groups have estimated the probabilities of various outcomes, based on variations in the physical response of the climate system itself. But the MIT model is the only one that interactively includes detailed treatment of possible changes in human activities as well - such as the degree of economic growth, with its associated energy use, in different countries.

Study co-author Ronald Prinn, the co-director of the Joint Program and director of MIT's Center for Global Change Science, says that, regarding global warming, it is important "to base our opinions and policies on the peer-reviewed science," he says. And in the peer-reviewed literature, the MIT model, unlike any other, looks in great detail at the effects of economic activity coupled with the effects of atmospheric, oceanic and biological systems. "In that sense, our work is unique," he says.

The new projections, published this month in the American Meteorological Society's Journal of Climate, indicate a median probability of surface warming of 5.2 degrees Celsius by 2100, with a 90% probability range of 3.5 to 7.4 degrees.

Climate change odds much worse than thought

Based on how inacurate(sic) the models have allways(sic) been I am not the slightest bit concerned.

Given how wrong you are about everything and given how accurate the models have actually proved to be, the conclusion is that you are an idiot who has no idea what is really happening but just repeats tired, lame, lying denier cult misinformation and myths.
 
More dishonesty by Si. No one ever claimed that CO2 was the only variable. In fact, it has been pointed out many times by the honest posters here that the TSI, NAO, and La Nina, El Nino oscilations all contribute to the variability of the weather.

Oh how quickly they forget their own mantra. You've been screaming till blood spattered us from your shredded vocal chords how we have to stop CO2. Nothing else would do. You typed your little fingers to skeletal nubs with fake science and bullshit activist links 'proving' that CO2 was the holy grail of climate change.

Now... not so much? buh?

Do you have a SHRED of intellectual integrity? Did you ever?

Wow, you really are a major retard, bigfistedass.

Just because there are other factors that affect our climate does not invalidate the fact that mankind's carbon emissions are the major contributing factor in the current abrupt global warming/climate changes.
 
What ever Happened To The Erupting Iceland Volcano?
By Dr. Tim Ball Thursday, April 29, 2010
This photo (left) taken on April 27, 2010 shows that the Eyjafjallajokull volcano continues to erupt in Iceland, but the story has fallen off the very small mainstream media tabletop. We need to put in perspective what happened and what it means.

There are two major stories. The first was the information provided by the United Kingdom Meteorological Office (UKMO) that was used to ground all the flights. They provided maps of the distribution of the ash cloud and made these available on their web site.


The site is still providing information but it is also providing an analysis of the model used to generate the forecasts. This is the Numerical Atmospheric Modelling Environment (NAME) that uses information from their larger Met Office Unified Model (UM). The NAME model was using wind and precipitation data from the UM and those are two of the most unreliable variables in any model. This is frequently a problem, for example, we now know wind and ocean currents explained much of the variation in Arctic Ice attributed solely to temperature. It is clear the models did not work in their prediction of Iceland volcanic dust distribution and the UKMO basically says so, “Throughout the event Met Office scientists compared our forecasts with the observations of volcanic ash. The main conclusion is that the forecasts of ash have been consistent with the observations available at the time. Although, it is important to note that there are limitations in both the forecast model and the observations.”

We knew this already because computer model expert Tim Palmer, leading climate modeler at the European Centre for Medium Range Weather Forecasts, said; “I don’t want to undermine the IPCC, but the forecasts, especially for regional climate change, are immensely uncertain.” They could also have known the model predictions would fail because the Intergovernmental Panel on Climate Change (IPCC) failed to determine vertical profiles of aerosols that include volcanic ash because of meteorological conditions.

“Comparisons of in situ measurements against those from global atmospheric models are complicated by differences in meteorological conditions and because in situ measurements are representative of conditions mostly at or near the surface while the direct and indirect RFs depend on the aerosol vertical profile.”

The failed UKMO forecast comes on the heels of previous disastrous summer and winter forecasts. Many have called for closing down the agency.

This will increase those demands especially if, as is expected, the airlines sue the government for the lost revenue caused by groundings based on the model outputs. Of course, as usual, the taxpayer will pay the bill.

Composition of the Atmosphere
The second story is the continued output of the volcano and the implications for long-term atmospheric change. All volcanic activity releases gases especially water vapor and CO2. There are various estimates of the CO2 output but they are only estimates. Willis Eschenbach, in a crude estimate based on outputs from nearby volcanoes, said it was 200,000 tonnes per day. It is a minute fraction of the global total, but a bigger percentage of the human production and the longer the eruption continues the greater the volume. However, the output of volcanic dust is a more important factor.

One of the problems with attempts to determine how much volcanic dust was in the atmosphere from Iceland is we don’t know the normal background levels. Hubert Lamb, founder of the Climatic Research Unit (CRU) at East Anglia, who would turn in his grave to know what has transpired there, in 1970 created what he called a Dust Veil Index (DVI). “Lamb’s Dust Veil Index (DVI) is a numerical index that quantifies the impact of a particular volcanic eruption’s release of dust and aerosols over the years following the event, especially the impact on the Earth’s energy balance. DVIs have been calculated for eruptions occurring from 1500 through 1983. The methods used to calculate the DVI have been intercalibrated to give a DVI of 1000 for the eruption of Krakatoa in 1883.”

Historical Examples
Global temperatures are currently declining as solar activity declines. A continuation of dust particle injections from the Iceland volcano will add to the cooling, especially in the Northern Hemisphere. This relationship is important because the impact of previous volcanic eruptions varies depending on what the temperature was doing at the time. For example, Laki, which erupted in 1783, was at the beginning of lower temperatures associated with the Dalton Minimum (Figure 2.) Similarly, the eruption of Tambora in 1815 was within the same period and trend. It also shows the projected sunspot numbers for the upcoming two solar cycles.

What ever Happened To The Erupting Iceland Volcano?
 
Bull shit, In fact the Antarctic the last few years have seen record high sea ice. The Arctic has seen the most ice in a decade. Stupid feeding horse crap to the people.

LOLOLOL....you're really wedded to those loony denier cult delusions. You really ought to jerk your head out of your ass and look at some real science instead of just those lying denier cult blogs, dufus.

20100504_Figure3_thumb.png


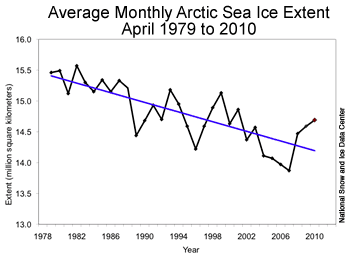
April 2010 compared to past years

Average ice extent for April 2010 was 310,000 square kilometers (120,000 square miles) below the average extent for the month.

March - Overview of conditions

Arctic sea ice extent averaged for March 2010 was 15.10 million square kilometers (5.83 million square miles). This was 650,000 square kilometers (250,000 square miles) below the 1979 to 2000 average for March

February - Overview of conditions

Arctic sea ice extent averaged for February 2010 was 14.58 million square kilometers (5.63 million square miles). This was 1.06 million square kilometers (409,000 square miles) below the 1979 to 2000 average for February

January - Overview of conditions

Arctic sea ice extent averaged for January 2010 was 13.78 million square kilometers (5.32 million square miles). This was 1.08 million square kilometers (417,000 square miles) below the 1979 to 2000 average for January

Arctic sea ice extent remains low; 2009 sees third-lowest mark

This is a press release from the National Snow and Ice Data Center (NSIDC), which is part of the Cooperative Institute for Research in Environmental Sciences at the University of Colorado at Boulder.

At the end of the Arctic summer, more ice cover remained this year than during the previous record-setting low years of 2007 and 2008. However, sea ice has not recovered to previous levels. September sea ice extent was the third lowest since the start of satellite records in 1979, and the past five years have seen the five lowest ice extents in the satellite record.

NSIDC Director and Senior Scientist Mark Serreze said, “It’s nice to see a little recovery over the past couple years, but there’s no reason to think that we’re headed back to conditions seen back in the 1970s. We still expect to see ice-free summers sometime in the next few decades.”

The average ice extent over the month of September, a reference comparison for climate studies, was 5.36 million square kilometers (2.07 million square miles) (Figure 1). This was 1.06 million square kilometers (409,000 square miles) greater than the record low for the month in 2007, and 690,000 square kilometers (266,000 square miles) greater than the second-lowest extent in 2008. However, ice extent was still 1.68 million square kilometers (649,000 square miles) below the 1979 to 2000 September average (Figure 2). Arctic sea ice is now declining at a rate of 11.2 percent per decade, relative to the 1979 to 2000 average (Figure 3).


Arctic Sea Ice Down to Second-Lowest Extent; Likely Record-Low Volume

Despite cooler temperatures and ice-favoring conditions, long-term decline continues


2 October 2008

This is a press release from the National Snow and Ice Data Center (NSIDC), which is part of the Cooperative Institute for Research in Environmental Sciences at the University of Colorado at Boulder.

Arctic sea ice extent during the 2008 melt season dropped to the second-lowest level since satellite measurements began in 1979, reaching the lowest point in its annual cycle of melt and growth on September 14, 2008. Average sea ice extent over the month of September, a standard measure in the scientific study of Arctic sea ice, was 4.67 million square kilometers (1.80 million square miles) (Figure 1). The record monthly low, set in 2007, was 4.28 million square kilometers (1.65 million square miles); the now-third-lowest monthly value, set in 2005, was 5.57 million square kilometers (2.15 million square miles).

The 2008 season strongly reinforces the thirty-year downward trend in Arctic ice extent. The 2008 September low was 34% below the long-term average from 1979 to 2000 and only 9% greater than the 2007 record (Figure 2). Because the 2008 low was so far below the September average, the negative trend in September extent has been pulled downward, from –10.7 % per decade to –11.7 % per decade (Figure 3).

NSIDC Senior Scientist Mark Serreze said, “When you look at the sharp decline that we’ve seen over the past thirty years, a ‘recovery’ from lowest to second lowest is no recovery at all. Both within and beyond the Arctic, the implications of the decline are enormous.”

Conditions in spring, at the end of the growth season, played an important role in the outcome of this year’s melt. In March 2008, thin first-year ice covered a record high 73% of the Arctic Basin. While this might seem like a recovery of the ice, the large extent masked an important aspect of sea ice health; thin ice is more prone to melting out during summer. So, the widespread thin ice of spring 2008 set the stage for extensive ice loss over the melt season.

Through the 2008 melt season, a race developed between melting of the thin ice and gradually waning sunlight. Summer ice losses allowed a great deal of solar energy to enter the ocean and heat up the water, melting even more ice from the bottom and sides. Warm oceans store heat longer than the atmosphere does, contributing to melt long after sunlight has begun to wane. In August 2008, the Arctic Ocean lost more ice than any previous August in the satellite record.

NSIDC Research Scientist Walt Meier said, “Warm ocean waters helped contribute to ice losses this year, pushing the already thin ice pack over the edge. In fact, preliminary data indicates that 2008 probably represents the lowest volume of Arctic sea ice on record, partly because less multiyear ice is surviving now, and the remaining ice is so thin.” (See Figure 4.)


Arctic Sea Ice Shatters All Previous Record Lows

Diminished summer sea ice leads to opening of the fabled Northwest Passage

1 October 2007

This is a press release from the National Snow and Ice Data Center (NSIDC), which is part of the Cooperative Institute for Research in Environmental Sciences at the University of Colorado at Boulder.

Arctic sea ice during the 2007 melt season plummeted to the lowest levels since satellite measurements began in 1979. The average sea ice extent for the month of September was 4.28 million square kilometers (1.65 million square miles), the lowest September on record, shattering the previous record for the month, set in 2005, by 23 percent (see Figure 1). At the end of the melt season, September 2007 sea ice was 39 percent below the long-term average from 1979 to 2000 (see Figure 2). If ship and aircraft records from before the satellite era are taken into account, sea ice may have fallen by as much as 50 percent from the 1950s. The September rate of sea ice decline since 1979 is now approximately 10 percent per decade, or 72,000 square kilometers (28,000 square miles) per year (see Figure 3).

Arctic sea ice has long been recognized as a sensitive climate indicator. NSIDC Senior Scientist Mark Serreze said, “Computer projections have consistently shown that as global temperatures rise, the sea ice cover will begin to shrink. While a number of natural factors have certainly contributed to the overall decline in sea ice, the effects of greenhouse warming are now coming through loud and clear.”

One factor that contributed to this fall’s extreme decline was that the ice was entering the melt season in an already weakened state. NSIDC Research Scientist Julienne Stroeve said, "The spring of 2007 started out with less ice than normal, as well as thinner ice. Thinner ice takes less energy to melt than thicker ice, so the stage was set for low levels of sea ice this summer.”

Another factor that conspired to accelerate the ice loss this summer was an unusual atmospheric pattern, with persistent high atmospheric pressures over the central Arctic Ocean and lower pressures over Siberia. The scientists noted that skies were fairly clear under the high-pressure cell, promoting strong melt. At the same time, the pattern of winds pumped warm air into the region. While the warm winds fostered further melt, they also helped push ice away from the Siberian shore. NSIDC Research Scientist Walt Meier said, "While the decline of the ice started out fairly slowly in spring and early summer, it accelerated rapidly in July. By mid-August, we had already shattered all previous records for ice extent."

Arctic sea ice receded so much that the fabled Northwest Passage completely opened for the first time in human memory (see Figure 4). Explorers and other seafarers had long recognized that this passage, through the straits of the Canadian Arctic Archipelago, represented a potential shortcut from the Pacific to the Atlantic. Roald Amundsen began the first successful navigation of the route starting in 1903. It took his group two-and-a-half years to leapfrog through narrow passages of open water, with their ship locked in the frozen ice through two cold, dark winters. More recently, icebreakers and ice-strengthened ships have on occasion traversed the normally ice-choked route. However, by the end of the 2007 melt season, a standard ocean-going vessel could have sailed smoothly through. On the other hand, the Northern Sea Route, a shortcut along the Eurasian coast that is often at least partially open, was completely blocked by a band of ice this year.

In addition to the record-breaking retreat of sea ice, NSIDC scientists also noted that the date of the lowest sea ice extent, or the absolute minimum, has shifted to later in the year. This year, the five-day running minimum occurred on September 16, 2007; from 1979 to 2000, the minimum usually occurred on September 12. NSIDC Senior Scientist Ted Scambos said, “What we’ve seen this year fits the profile of lengthening melt seasons, which is no surprise. As the system warms up, spring melt will tend to come earlier and autumn freezing will begin later.”

Changes in sea ice extent, timing, ice thickness, and seasonal fluctuations are already having an impact on the people, plants, and animals that live in the Arctic. NSIDC Research Scientist and Arctic resident Shari Gearheard said, “Local people who live in the region are noticing the changes in sea ice. The earlier break up and later freeze up affect when and where people can go hunting, as well as safety for travel.”

NSIDC scientists monitor and study Arctic sea ice year round, analyzing satellite data and seeking to understand the regional changes and complex feedbacks that we are seeing. Serreze said, “The sea ice cover is in a downward spiral and may have passed the point of no return. As the years go by, we are losing more and more ice in summer, and growing back less and less ice in winter. We may well see an ice-free Arctic Ocean in summer within our lifetimes.” The scientists agree that this could occur by 2030. Serreze concluded, “The implications for global climate, as well as Arctic animals and people, are disturbing."

20071001_septembertrendthumb.gif
 
Last edited:
The only constant is change.

And right now, due to mankind's actions, the world is constantly changing into a warmer world with less ice at the poles and in the glaciers. So what's your point? Or perhaps you just like pontificating vague, meaningless generalities and pretending that it is an intelligent comment.


Rather arrogant to believe that it is only mankind actions don't you think?
 

Forum List

Back
Top