Billy_Bob
Diamond Member
Note the change in trend lines..This mornings forecast discussion got into the falling arctic ice levels. Several of the scientists over at NSIDC were commenting on the pack ice (30% ice coverage of water) growth vs the edge ice (15% coverage of the water) which is what Old crock and others post here as evidence of CAGW.
One of the reasons the sea ice levels are going down is the winds are driving the ice into pack ice that is 10 meters deep. SO the ice loss is not happening and they are talking about how to correct for this.
The Danish Meteorological Institute (DMI) recently stopped posting their 30% ice coverage (pack ice) as they were having trouble explaining the difference to lay persons who didn't understand. The High winds this year in the arctic have driven the ice into pack ice resulting in a lower surface area coverage.
Pack Ice has increased in the Arctic by 11% this year alone.. Just using one graph to say the arctic is melting is not only disingenuous but a lie to boot.
View attachment 65128
Here is the corrected 15% ice coverage graph from NSIDC
Even NCAR has updated their ice pack graphs..
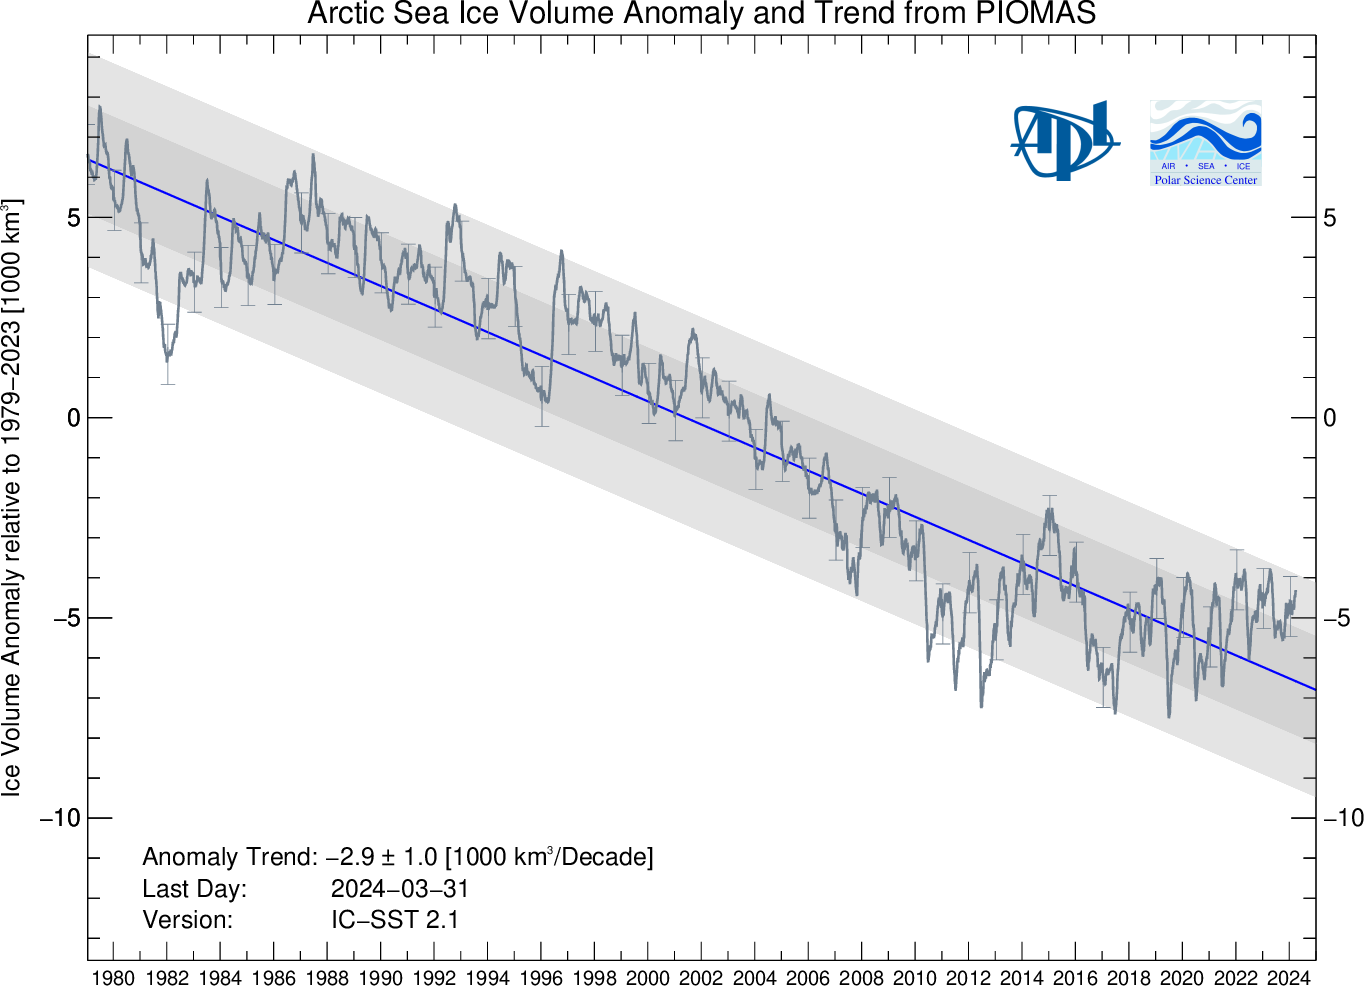
Good reason to use volume rather than extents.

One low year doesn not break a trend nor does it make one...