Arctic Ice

Old Rocks

Diamond Member
Oct 31, 2008
63,085
9,753
2,040
Portland, Ore.
It looks like we are headed for another very low ice cover in the Arctic this summer.

Arctic Sea Ice News & Analysis
Conditions in context

Although the 2009 melt season started slowly, the pace of ice loss quickened through May. During May, the Arctic Ocean lost 1.67 million square kilometers (645,000 square miles) of ice, an average decline of 54,000 square kilometers (21,000 square miles) per day. This is similar to the rate of decline observed last year. For comparison, the long-term average (1979-2000) rate of decline for May is 47,000 kilometers per day (18,000 square miles per day). By the end of May 2009, ice extent was 84,000 square kilometers (32,000 square miles) higher than extent at the end of May 2007.
 
Granny says, "Dat's right - alla ice gonna melt an' we all gonna drown...
icon_grandma.gif

Arctic and Antarctic sea ice hit record low in January: UN
Saturday 18th February, 2017 - The extent of sea ice in the Arctic and Antarctic last month was the lowest on record for January, the UN World Meteorological Organization said on Friday, while concentrations of carbon dioxide in the atmosphere hit a January record.
“The missing ice in both poles has been quite extraordinary,” David Carlson, director of the World Climate Research Programme, told a UN briefing in Geneva. “It is a quite strange situation. It’s extraordinarily warm in the north, and the sea ice, which is one indicator of planetary warmth, is at a minimum at this point in both hemispheres.”

The month of January was probably the second or third hottest such month on record, but that was not a reliable indicator of the state of the climate, he said. “Surface air temperature is a small hair on the long tail of a very big dog. And the very big dog is the ocean. And what you really don’t want to watch is individual months of surface air temperature because they can go up for a variety of reasons.

A better guide was the temperature of oceans, or “integrated ocean heat content.” “And that in fact is relentlessly going up and up and up,” he said. There have been at least three periods this winter when Arctic sea ice has retreated, when it should have been expanding. Satellite records for polar sea ice go back 38 years. This January, Arctic sea ice averaged 13.38 million square km. The previous record low was just a year ago, in January 2016, when there was 260,000 square km more ice - bigger than the area of the United Kingdom.

Arctic ice was 8.6 per cent below the average for January, while ice in the Antarctic sea, where it is summer, was 22.8 pe rcent below the average, the WMO said, citing data from the U.S. National Oceanic and Atmospheric Administration."The horizons that we thought we had - the number of years until summer sea ice disappears, or the number of years until we reach some global average surface temperature target - are absolutely shortening,” Carlson said. “The time for the global community to react is now.”

Arctic and Antarctic sea ice hit record low in January: UN
 
And on and on and on with the fake news...it's like you don't know that there are other sources with which to verify your spew...

Tell me rocks, how does the glassy eyed chant go?

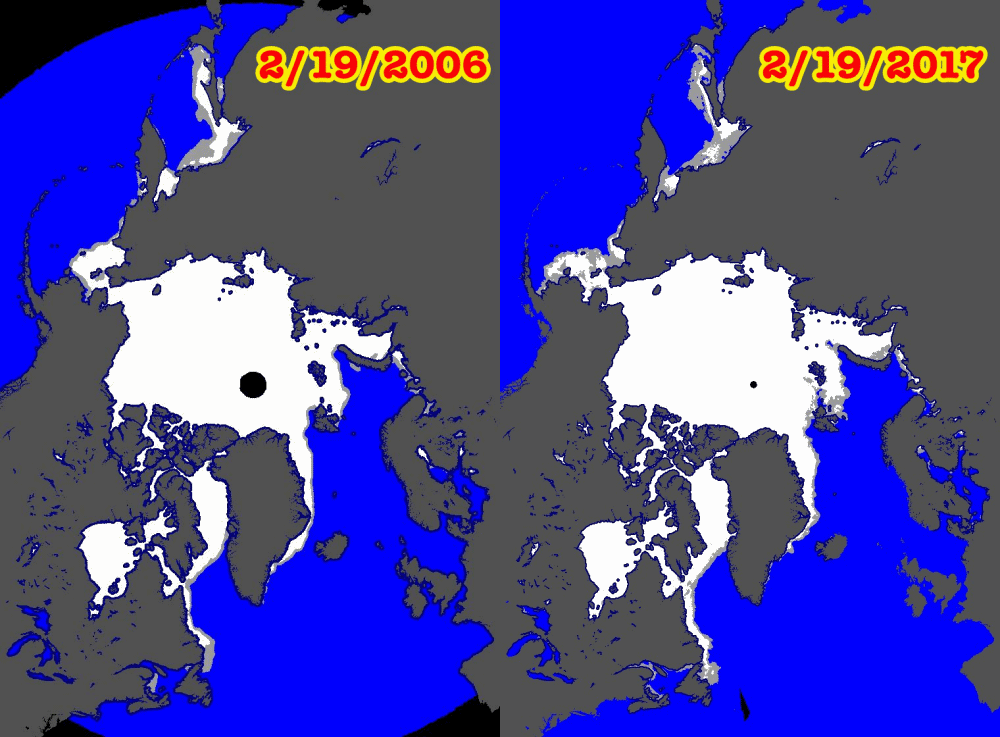
SeaIce2-19-2006-2-19-2017.gif
 
Last edited:
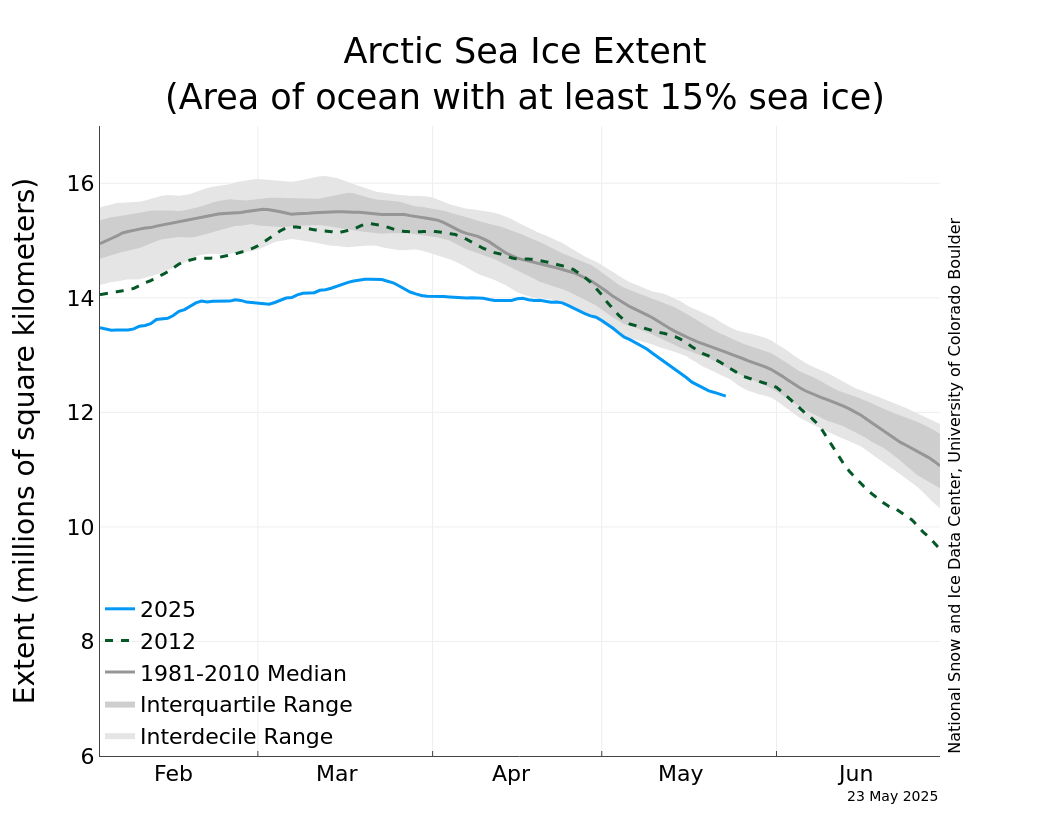
N_iqr_timeseries.png

Arctic Sea Ice News and Analysis | Sea ice data updated daily with one-day lag
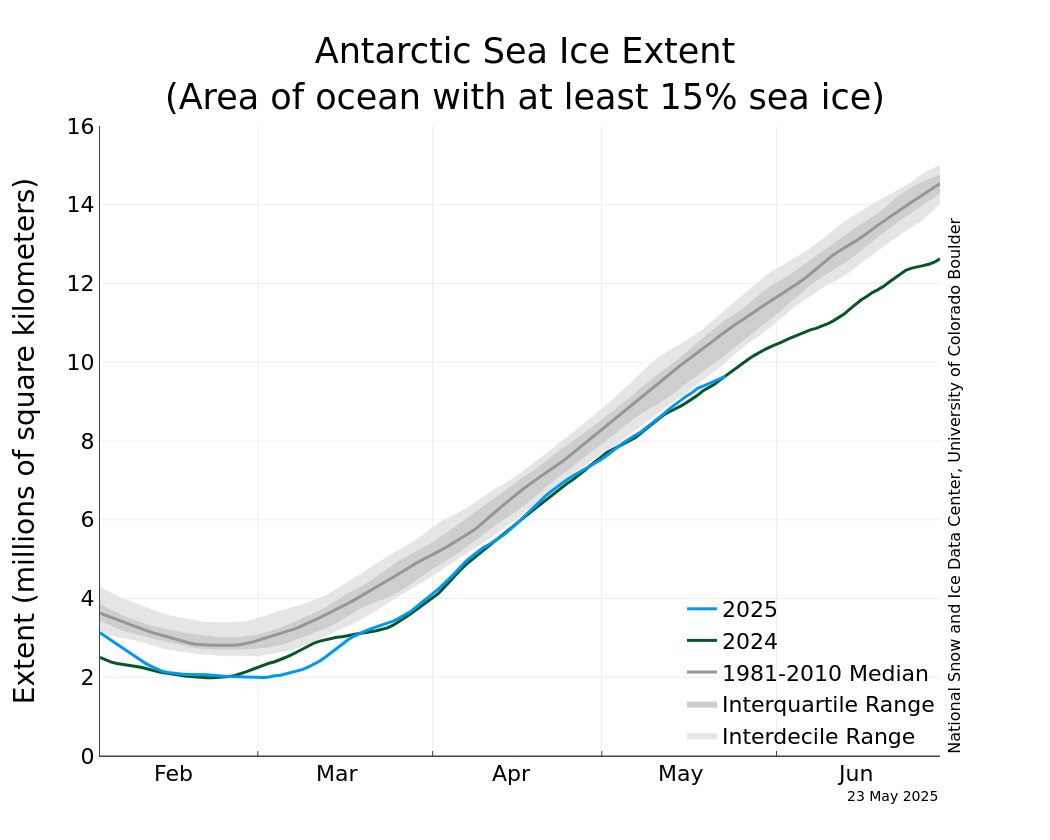
S_iqr_timeseries.png


← Previous Article
2017 ushers in record low extent
February 7, 2017


Record low daily Arctic ice extents continued through most of January 2017, a pattern that started last October. Extent during late January remained low in the Kara, Barents and Bering Seas. Southern Hemisphere extent also tracked at record low levels for January; globally, sea ice cover remains at record low levels.
..................................................................................................
Extent is tracking at records low levels in the Southern Hemisphere, where it is currently summer. As shown in this plot for February 5, this is primarily due to low ice extent within the Amundsen Sea, where only a few scattered patches of ice remain. By contrast, extent in the Weddell Sea is now only slightly below average. This pattern is consistent with persistent above average air temperatures off western Antarctica.

Record low ice at both poles. Three extreme warmups in the Arctic this winter. Yet our 'Conservatives' are still claiming that nothing is happening.
 

Clearly your graph is just more fake news....it clearly states that there was much more ice in 2006 and yet, the sat photos don't show anything like that...all this fake news and fake graphs...and fake science is coming back to bite you all in the ass...and I, for one am going to enjoy watching it.
 
N_iqr_timeseries.png

Arctic Sea Ice News and Analysis | Sea ice data updated daily with one-day lag
S_iqr_timeseries.png


← Previous Article
2017 ushers in record low extent
February 7, 2017


Record low daily Arctic ice extents continued through most of January 2017, a pattern that started last October. Extent during late January remained low in the Kara, Barents and Bering Seas. Southern Hemisphere extent also tracked at record low levels for January; globally, sea ice cover remains at record low levels.
..................................................................................................
Extent is tracking at records low levels in the Southern Hemisphere, where it is currently summer. As shown in this plot for February 5, this is primarily due to low ice extent within the Amundsen Sea, where only a few scattered patches of ice remain. By contrast, extent in the Weddell Sea is now only slightly below average. This pattern is consistent with persistent above average air temperatures off western Antarctica.

Record low ice at both poles. Three extreme warmups in the Arctic this winter. Yet our 'Conservatives' are still claiming that nothing is happening.

All fake news, all the time....
 
Show us the real stuff then. Prove that NSIDC is fake.
 
Last edited:
What is the source of your two images? What does your source claim to have been the ice extent for those periods? NSIDC showed 2006 to have been an exceptionally low extent year.

However

September 2006 extent: 5.95 million km^2
September 2016 extent: 4.72 million km^2, down 21% in one decade.
SOTC: Sea Ice | National Snow and Ice Data Center
 
Last edited:
Links? Evidence? Expert opinions? Wait... let me guess: conspiracy, money and lies. Right?
 
Holocene variability in sea ice cover, primary production, and Pacific‐Water inflow and climate change in the Chukchi and East Siberian Seas (Arctic Ocean)

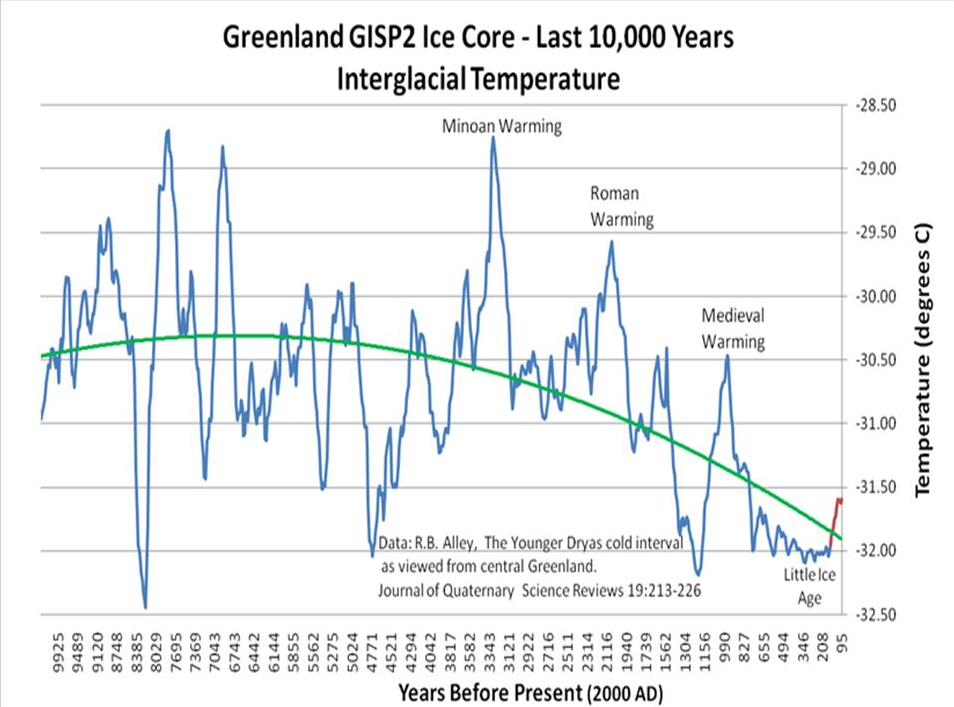
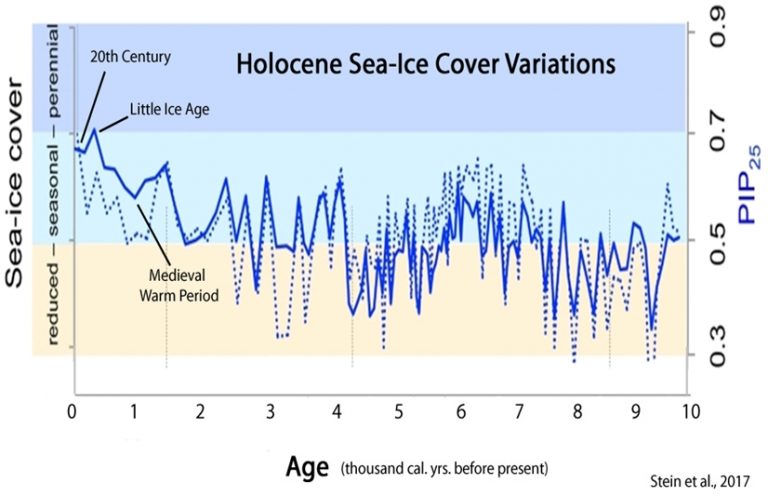
So here is a paper just published in The Journal of Quaternary Science, by Stein, et. al. They actually looked at the gold standard ice core reconstructions showing the temperature record over the past 10K years studied how the arctic ice actually looked over the same period... Guess what...when the arctic temperatures over the past 10K years are considered by rational people, it becomes evident that in the present, the arctic has more ice than it has for the bulk of the past 10K years...I have been pointing that out to you wackos for quite some time with this graph...

Screen_shot_2012-10-06_at_11.14.04_AM.png


So Stein et al produced this graph showing what the arctic ice looked like over the past 10K years...and guess what, it puts the claim you guys make of present arctic ice being at its lowest point in over a million years in the shit bin with all the rest of your failed claims.. Here, have a look at what the arctic ice has looked like over the past 10K years...


Arctic-Sea-Ice-Holocene-Stein-17-768x496.jpg


Stein et al said:
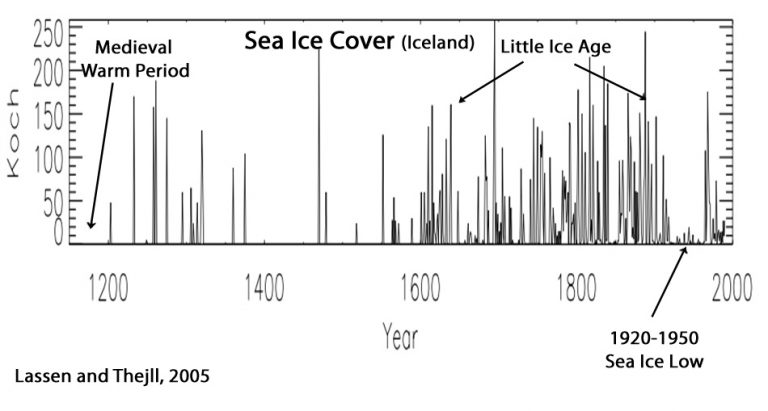
Robust substantiation for the trends documented in this new Arctic sea ice record comes from a 2005 paper by Lassen and Thejll entitled “Multi-decadal variation of the East Greenland Sea- Ice Extent: AD 1500-2000.” Shown below is an annotated graph from the paper revealing Iceland’s sea ice cover during the last millennium. These scientists also link sea ice variations to solar activity, namely solar cycle length. Notice the direct correspondence between the Arctic trends as a whole (from Stein et al., 2017) and the trends for Iceland.


Arctic-Sea-Ice-Iceland-Koch-Since-1200-768x411.jpg


Of special note is the fact that the paper makes no mention of atmospheric CO2 as it is not necessary to explain the present state of arctic ice...I suspect that will become the trend in the future...explaining present conditions without the need to invoke the magic of CO2...

Other papers showing the present "vastness" of arctic sea ice as compared to the past 10K years...

http://www.sciencedirect.com/science/article/pii/S0277379113004162?np=y

Ice free Arctic Ocean, an Early Holocene analogue.
 
Last edited:
Greenland is most assuredly not "the Gold Standard".

"Most important is the presence of rapid warming events in Greenland in contrast with usually gradual warming in Antarctica. The relative rarity of rapid cooling events in Greenland and the generally in-phase character of gradual cooling in both hemispheres, are probably equally critical."

http://isolab.ess.washington.edu/isolab/papers/SteigAlley.pdf, Phase Relationships between Antarctic and Greenland Climate Records
 
Greenland is most assuredly not "the Gold Standard".

Of course it is skid mark...but then, to acknowledge that would threaten your belief and perhaps put you on the outs with the glassy eyed chanting cult...

https://ir.library.oregonstate.edu/.../1957/37906/MitchellLoganE2013.pdf?sequence=1

Ice cores are considered the gold standard for recording past climate and biogeochemical changes.

The past is the key to the future: Temperature history of the past 10,000 years | Die kalte Sonne

Although the GISP2 ice core data is site specific (Greenland), it has been well correlated with global glacial fluctuations and a wide range of other climate proxies and has become the ‘gold standard’ among global climate reconstructions.

And I could go on and on...there is no doubt that ice cores are the gold standard for climate reconstruction....


"Most important is the presence of rapid warming events in Greenland in contrast with usually gradual warming in Antarctica. The relative rarity of rapid cooling events in Greenland and the generally in-phase character of gradual cooling in both hemispheres, are probably equally critical."

Can you not even read a simple graph...oh..wait a minute...I am talking to crick...of course you can't read a graph...Here...let me help...

Screen_shot_2012-10-06_at_11.14.04_AM.png


Your source states that rapid cooling events are rare in Greenland...according to the gold standard temperature reconstruction, rapid cooling events are commonplace in Greenland...changes of 2 to 3 degrees over very short periods of time have been the norm over the past 10 thousand years.....

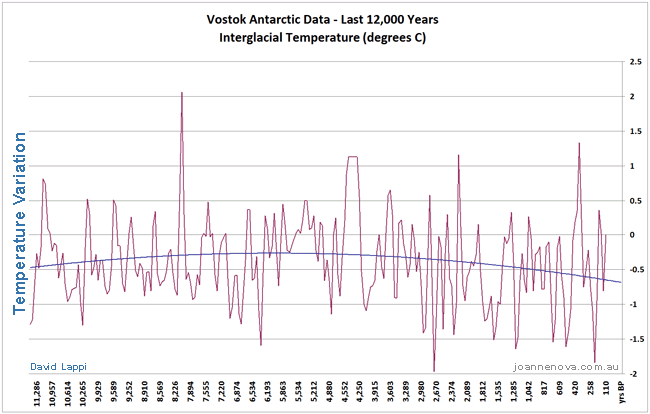
Further, your source also says that warming in Antarctica is gradual...again...according to the gold standard reconstruction, that also is not in accordance with the facts...here is a graph of the vostok cores covering the past 10K years...again...rapid warming of 1.5 to 3 degrees in a very short time span has been the norm over the past 10K years...in short, your source is full of shit, and you are a dupe for believing him when actual evidence showing he is wrong is readily available..

vostok-last-12000-years-web.gif
 
Links? Evidence? Expert opinions? Wait... let me guess: conspiracy, money and lies. Right?

Libtard ROE


1. Demand a link or an explanation of the truth you are objecting to.

2. Promptly reject all explanations as right wing lies.

3. Ignore any facts presented.


4. Ridicule spelling and typos.

5. Attack the person as being juvenile, ie: "are you 12 years old", question their education, intelligence.

6. Employ misdirection, smear people, attack religion

7. Lie, make false assumptions

8. Play race/gender card

9. Play gay/lesbian card

10. Play the Nazi card

11. Make up stuff

12. Deny constantly

13. Reword and repeat

14. Pretending not to understand when they have been posting about it for the last 2 days.
-----------------------------------------------------------------------------------------------------------------------------------------------------

Hey Crick, I'm sure if look back over these posts you can find a spelling error to support your "facts".
 
I might. But I will NOT find any links to peer reviewed studies supporting your contentions, will I.
 
I might. But I will NOT find any links to peer reviewed studies supporting your contentions, will I.
No, because they don't want to tell people they have no data from thousands of years ago because there is none. All they have are clues to what it might have been like. Back 500 years ago, you would have been the kind of person who had me imprisoned because I claimed the Earth revolved around the Sun.
 

Forum List

Back
Top