Figure 4 : Processed data from Nov 16 – Dec 31, 2014
Figure 5 : Processed data from Jan 1 – Feb 15, 2015
Figure 6 : Processed data from Feb 16 – Mar 31, 2015
Figure 7 : Processed data from Apr 1 – May 15, 2015
Figure 8 : Processed data from May 16 – Jun 30, 2015
Figure 9 : Processed data from Jul 1 – Aug 15, 2015
Also, reader “edimbukvarevic” provides this map of anthropogenic CO2 emissions for comparison:
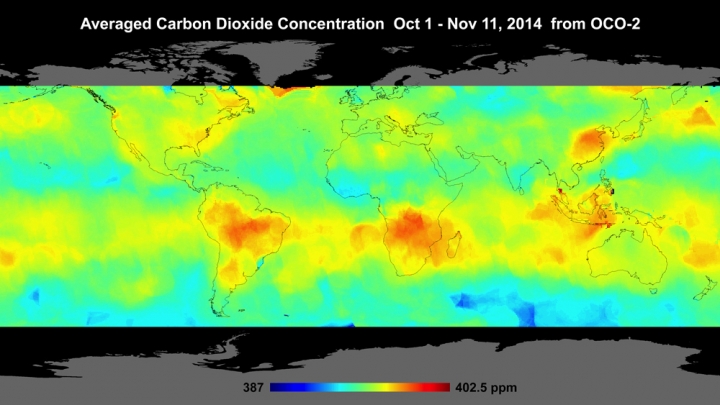
Finally: visualized OCO2 satellite data showing global carbon dioxide concentrations
A lie by misdirection is still a lie, Mr. Westwall, and you again stand branded a liar by your own posts.


