You are a climate denier if....

so again, or what? What is going to happen if we don't agree with them? BTW, I don't. I believe doctors because they do experiments and find outwhat is happening. I believe Military leaders because they actually have combat simulation experiments that demonstrate their tactics. Why can't a climate scientist merely show the data they use to depict a graph and call it a day. Why does it take a suit to even begin to move toward that probability? Why isn't there that one experiment that can demonstrate the climate scientist hypothetical model? That quote has holes all in it. Too bad for him. But again, what happens because we don't agree?
 
Why was it so hard to prove the Higgs boson existed? Why did it take so long to convince the world's geologists that the Earth's plates were in motion? Why did people think the Earth was flat for a thousand years? What was wrong with them?

The carbon dioxide absorbs infrared light is a fact. That greenhouse gases warm the atmosphere is a fact. That humans are the source of 120 ppm of the 400 ppm CO2 in the atmosphere is a fact. You only see a shortage of hard evidence because you want to see it that way.
 
Seems that you are a real climate denier if you....
...are a very gullible rightwingnut, very ignorant, very brainwashed, completely full of misinformation, lies and BS, and, of course, extremely retarded.

There! Fixed it for you. Now it is accurate.
 
Seems that you are a real climate denier if you....
...are a very gullible rightwingnut, very ignorant, very brainwashed, completely full of misinformation, lies and BS, and, of course, extremely retarded.

There! Fixed it for you. Now it is accurate.

You are an asshat who can't compose an argument more complicated than juvenile name calling so excuse me if your opinion doesn't have much of an effect on me.
 
I think Old Rocks intent was to communicate his point to others that might have the horribly flawed idea of assigning some non-zero value to your utter nonsense.
 
I think Old Rocks intent was to communicate his point to others that might have the horribly flawed idea of assigning some non-zero value to your utter nonsense.

You don't think at all as evidenced by your kneejerk response to the revelation that the oceans have low emissivity at the far IR wavelengths....supposing that it must mean more warming rather than realizing that low emissivity must equal low absorptivity.
 
Seems that you are a real climate denier if you....
...are a very gullible rightwingnut, very ignorant, very brainwashed, completely full of misinformation, lies and BS, and, of course, extremely retarded.

There! Fixed it for you. Now it is accurate.

You are an asshat who can't compose an argument more complicated than juvenile name calling so excuse me if your opinion doesn't have much of an effect on me.

LOLOLOLOL.....must have touched a nerve.

Not my nerve....we have already been through all this....you are, unfortunately damaged....your parents did something to you which has left you so insecure that you feel the need to convince yourself that you are superior to everyone and the only way you have found to get that feeling is name calling, which is a very poor device indeed. We can go back over it all again and try to learn what damaged you so badly in the first place...whether it was a single incident, or small slights over a very long period of time...and maybe even help you come to grips with how threatening the world and everyone who disagrees with you is...and who knows, maybe even help you deal with your severely limited communication skills...which at this point, only make you seem less and less intelligent...bold face...all caps...incessant name calling....it makes you appear mentally ill. The very sort of communication one sees in a psychiatric ward....lots of shouting and name calling....little rational exchange of ideas.
 
Do you have memory issues? How many times do you have to be shown this diagram?

image_n%2Fgrl50382-fig-0001.png

Distinctive climate signals in reanalysis of global ocean heat content - Balmaseda - 2013 - Geophysical Research Letters - Wiley Online Library


here is what OHC data looked like before Trenberth 'fixed' it-

dev5ld.png


image_n%2Fgrl50382-fig-0001.png


Augung sorta goes down. El Chi sorta goes down but it is awfully noisy. Pinatubo goes down BEFORE the eruption and spikes when it does. hmmmm........... and I guess 2009 was just inconvenient.

edit- I made a mistake on the date of Pinatubo. june 1991. I guess you could find a little drop, but small compared to the noise.

If AGW worked as they claim, temperatures would be above 0 from the year 1850 forward

Ian,

Do you have reason to believe your OHC data is more accurate than Balmaseda, Trenberth and Kallen's OHC data? If so, what is that reason?

Your data has no depth parameter in it. Here is data from the same source differentiating 0-700 and 0-2000. It shows a difference.

heat_content700m2000myr.png


Why do you keep showing graphs that show a reduction in the rate of heat accumulation expecting them to prove your point? Here, let me help you out...in order for a graph to show an increase in the rate of heat accumulation, the line must be at a steeper angle near the end than at earlier points in the graph...

Further, since we have now learned that the ocean is a poor absorber of the far IR wavelengths that CO2 emits, the only other source of energy the sun has is the sun...does the term "its the sun stupid" ring a bell for you?....unless of course, you are going to start trying to promote back conduction and back convection since back radiation isn't working out for you in so far as sea water goes. Are you going to start promoting back convection and back conduction bucky?
 
You don't see an increase in slope in the BTK graph at 2000? If not, go find your readers. If still not, make an appointment with your ophthalmologist as you need new ones.
 
You don't see an increase in slope in the BTK graph at 2000? If not, go find your readers. If still not, make an appointment with your ophthalmologist as you need new ones.


Of course not...and neither do you. I guess I know what you think you see, but as always, you are misinterpreting...look at the graph from 1999 - 2004...what is the change? Now look at the graph from 2004 through 2013...what is the change.

From 1999 - 2004 the heat content changed from 6 to 12 from 2004 - 2009 the heat content rose from 12 to 14.5....a decrease the rate of increase...and from 2009 till 2012 when the chart ends the increase was to 15.5....still a decrease in the rate of heat accumulation. Sorry crick...those numbers on the bottom and side of the graph mean something and if you actually look at them, you can, if you try real hard....see what they mean...in this case, they show that from 2004 forward, the rate of heat accumulation has decreased from the period before.
 
Look at the graph from 1960 to 2000. Look at the rest of the graph.

Stop cherry picking.

I see periods of rapid accumulation, and periods of slowing accumulation...and a possibly manufactured period of loss of heat...the point is that you keep claiming that today the rate of heat accumulation is accelerating and in fact, it is decelerating.
 
My claim is and has always been the same claim made by BTK and now at least five other studies, that it accelerated in 2000, at the same point in time that surface warming slowed. I have never claimed that deep ocean warming continued to accelerate. The data clearly show that to be the case and that the rate at all times since then have been greater than the rate prior. The data also show a significant increase in the movement of warm water to depths below 700 meters.
 
The rate of warming from 2000 is much slower than the rate of previous periods...the fact remains that the rate of warming from 2000 forward is decelerating from previous periods...

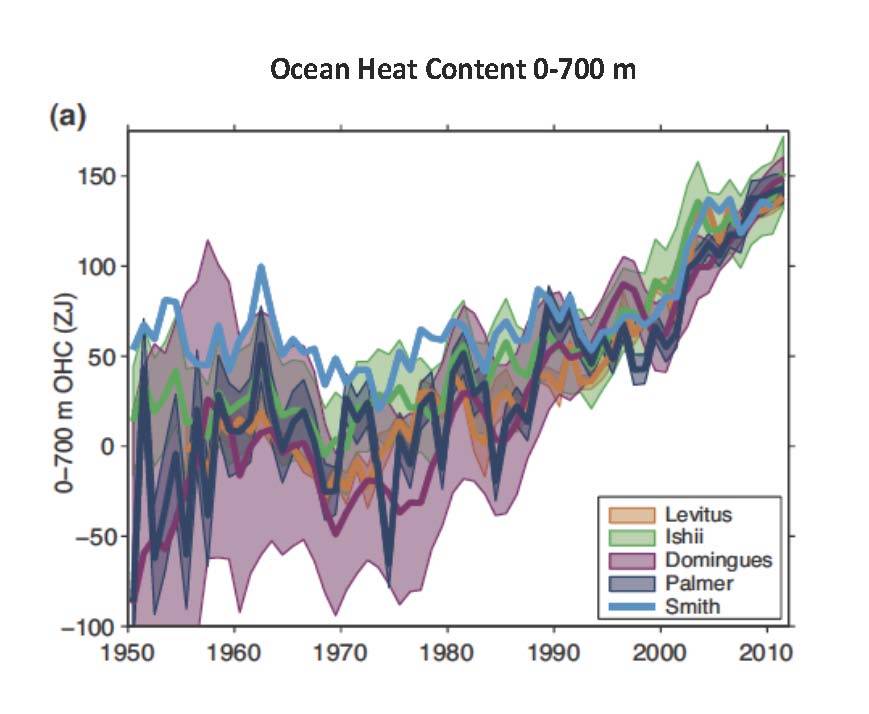
Tell me crick...what is the margin of error for that graph?... I don't see it listed.. Is it to be believed that there is no margin of error?

Here...from AR5..quite the margin of error I would say

presentation12.jpg


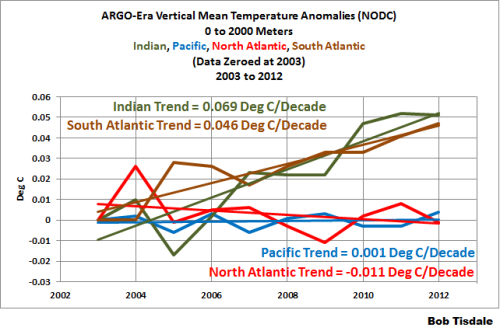
And here, from the ARGO era...a clear deceleration in the rate of heat accumulation when compared to your "best guess" graph....

01-vertical-mean-temp-basin-comparison-0-2000m.png
 
Last edited:

Forum List

Back
Top