Wonder Where Chris is?

"Polar Ice Sheets Melting Faster Than Predicted

So now you retards are claiming victory because AGW scientists have been deliberately over-conservative in their forecasts?

Didn't you all just scream they were alarmists?

No, I don't expect consistency from y'all. Given how many contradictory lies your cult has ordered you to parrot, there's no way you could be consistent.

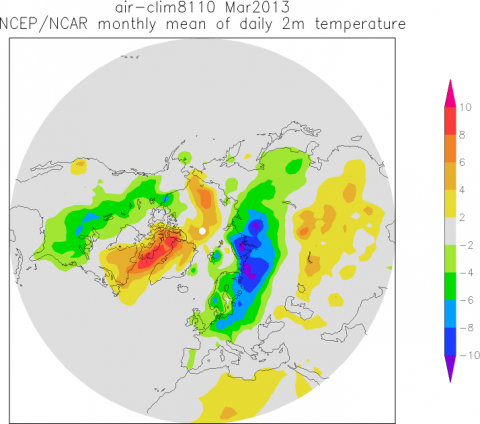
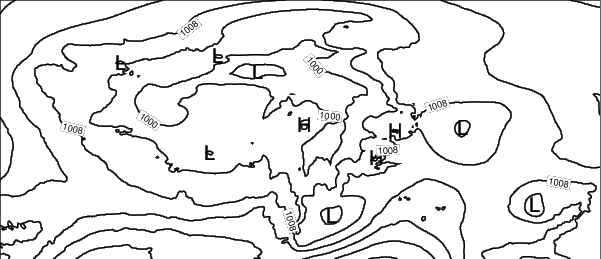
And I'd respond to polarbear, except it's just another of his Grampa Simpson rants. Lots of pictures, but he doesn't actually say anything.


No dumbass, because I just showed you to be either a complete fucking moron (likely) who is incapable of remembering to wipe his own ass, or you are a fucking prevaricator of the first order (also likely) either way you have the credibility of a dung beetle.
 
The non-cultists understand that their backyard isn't the world.

3_19_13_news_andrew_cfs1wk-500x368.jpg


Note the colder-than-normal USA and hotter-than-normal arctic. They're cancelling their ski races in Greenland because the snow has all melted. It's due to a very strong negative Arctic Oscillation, possibly a record breaker. Extremely high pressure over Greenland, which diverts the jet stream south, allowing Arctic air to blow south, and for warm air to come north to replace it.

Why such a strong negative Arctic Oscillation? No one is sure. Various theories, but nothing proven. If it keeps up into the melt season, it's going to murder the sea ice, either melting it or blowing it south past Greenland through the Fram Strait.
Do you understand the difference between weather and climate?
 
Wonder if mamooth ever wondered why the areas always portrayed as the warmist on idiot warmist charts are always areas with the fewest points for data gathering?
 
The non-cultists understand that their backyard isn't the world.

3_19_13_news_andrew_cfs1wk-500x368.jpg


Note the colder-than-normal USA and hotter-than-normal arctic. They're cancelling their ski races in Greenland because the snow has all melted. It's due to a very strong negative Arctic Oscillation, possibly a record breaker. Extremely high pressure over Greenland, which diverts the jet stream south, allowing Arctic air to blow south, and for warm air to come north to replace it.

Why such a strong negative Arctic Oscillation? No one is sure. Various theories, but nothing proven. If it keeps up into the melt season, it's going to murder the sea ice, either melting it or blowing it south past Greenland through the Fram Strait.

In the dead of winter when the average temp at lattitude 20Deg is about -30F --> do you really think that +/- 2 degF is gonna make a diff to Arctic climate? What's gonna make a diff to Sea Ice is the precipt -- which is likely to increase with the recent wind patterns.
That hysterical pseudocolor job just lacks any logic or reason for being.. Not that I'm being geocentric or anything -- but the entire concept of ONE NUMBER to describe Global Warming is a load of crap anyway...

But I guess it had to be simplified for consumption so that Chris and his legions could follow along.

Hmmm............. Can't read the data again. Look at the colors. Then the chart for the colors. 4 to 14 degree increases in Greenland.
 
Wonder if mamooth ever wondered why the areas always portrayed as the warmist on idiot warmist charts are always areas with the fewest points for data gathering?

Here we go again. Ever hear of a satellite? Most of the temperature data today is from satellites.
 
Wonder if mamooth ever wondered why the areas always portrayed as the warmist on idiot warmist charts are always areas with the fewest points for data gathering?

Here we go again. Ever hear of a satellite? Most of the temperature data today is from satellites.
What he posted was not a satellite IR image it was a computer generated forecast temperature deviation from the norm WHICH DID NOT HAPPEN.
http://www.climatecentral.org/image...s/news/3_19_13_news_andrew_cfs1wk-500x368.jpg
This is what happened instead and these are the color enhanced IR satellite images:
sshot4cf.png

sshot1vp.png


What he posted was from a blogger who also wrote this on the same page from where he copied that picture:
Fast forward to March 2013 and millions of Americans are shivering as an unrelenting string of winter storms have brought heavy snow from the Midwest to the Northeast, and colder-than-average temperatures to much of the East since February.
To put that weather in context, consider that by March 19, 2012, more than 2,200 warm-temperature records had been set or tied across the U.S. That is about 1,000 more than had been set or tied so far this March.
Perhaps no other location best illustrates the whiplash between March 2012 and March 2013 than International Falls, Minn., known as the “Icebox” of the nation. On March 18, 2012, International Falls recorded a high temperature of 79ºF, which was a monthly all-time high.
And what was the high temperature in International Falls on Monday? A chilly 28°F, with a low of 14°F. It was even colder on Tuesday, with the forecast high temperature of just 16°F.
A similar reversal is occurring in Chicago, where the first day of spring last year brought a high temperature of 85°F, which was a monthly record. This year? Try 60-degrees cooler, with a forecast high on Wednesday of just 25°F.
The weather pattern that is responsible for this year's cold weather is unusual, even though it is not yielding extremely cold temperatures across the U.S. In fact, March is running near average for the lower 48 states. Still, after last year's nonexistent winter and downright summer-like spring, any cold and snow in March may seem like a shock to the system.
And so on...
So it`s no wonder he did not want to include the link to the blog page where he got that picture from...which is definitely not a satellite IR image temperature equivalent.
It`s a construct.


You at least include a link with everything you post and kept it honest
B.t.w. This massive shift is not over yet but still continues not just on this continent but all over Europe as well:
http://www.spiegel.de/panorama/osterwetter-sonne-lockt-deutsche-ins-freie-a-891912.html
Translated quotes:
Germany, sunny but cold
10 cm more snow excepted in the alpine regions
Poland
30 cm snow within the last 24 hours
PGE electric reports wide spread power failures
Czechoslovakia
CKT News agency reported 40 cm snow during the last 24 hours
 
Last edited:
WHICH DID NOT HAPPEN.

It's not a temp graph, dumbass. It's a deviation-from-average graph. The fact that Greenland is still cold doesn't mean the deviation-from-average is wrong.

So it`s no wonder he did not want to include the link to the blog page where he got that picture from.

Given that the blog supports everything I said, I'm confused as to what you're babbling about. But since it's no doubt linked to this senseless obsession with me, I won't waste time on it.

I'm just laughing my ass off at the self-proclaimed "arctic weather expert" who doesn't know what a negative arctic oscillation does, and who can't read simple charts. But then, you are just a tech. You set up the machines, and then the smart people used the machines and interpreted the results.

You've got the delusion of competency that a lot of techs get, thinking that you're a scientist because you could hitch up a cable. That leads you to ending up more ignorant than the average layman. A layman might know he's lacking knowledge, but since you think you know it all, you see no need to educate yourself and correct your errors.
 
Last edited:
Wonder if mamooth ever wondered why the areas always portrayed as the warmist on idiot warmist charts are always areas with the fewest points for data gathering?

Here we go again. Ever hear of a satellite? Most of the temperature data today is from satellites.

Except the satellite data don't show the warming you guys claim so you don't use it.
 
It's not a temp graph, dumbass. It's a deviation-from-average graph. The fact that Greenland is still cold doesn't mean the deviation-from-average is wrong.

It is a projected deviation from average map based on computer model output and it failed...check the actual temps and compare them to the projected output.
 
So is it your claim that NCEP, part of the National Weather Service, is in on the vast conspiracy? That they've been doctoring maps of Greenland so evil people like me can spread the misinformation?

I just mention that because, contrary to PolarBear's strange conspiracy theory that a liberal blog fabricated the picture with photoshop, you can in fact see the letters "NCEP" right on it.
W.t.F. is it with you and your "conspiracy theory" fetish.
I caught you lying when you posted a c-generated jpg from a blog that was a forecast which never materialized and confronted you with it + the actual satellite images for that region and that date.
You don`t even know the meaning of the word "theory" as in "conspiracy theory". There is no such thing.
It`s just a Hollywood movie title you dimwit.
You of course would have to Google what the definition is..I`ll help you out:
In modern science, the term "theory" refers to scientific theories, a well-confirmed type of explanation of nature, made in a way consistent with scientific method, and fulfilling the criteria required by modern science
And a "conspiracy" is:
An agreement to perform together an illegal, wrongful, or subversive act.
There is no such thing as a "conspiracy theory" .
Only idiots which confuse Hollywood movies with reality use that phrase.
And a bunch of idiots like you would not be smart enough to pull off a conspiracy to begin with.
Did you find out in the meantime what an inversion layer is ?
Or do you still insist "Chinese aerosols" block enough sunlight to cool the globe ?
Did you find out how to calibrate a "pollen count proxy thermometer"?
ER10.png

You should, because you insist using it.
 
Last edited:
I caught you lying when you posteda c-generated jpg

So now you're walking back your claim it was an airbrushed photoshop job. It's a shame you're now trying to pretend you didn't make such a claim.

Also, that's a very strange definition of "lie" you're using. How is posting a forecast a lie? You seem to be using a different version of English than the standard one.
No I`m not "walking back".
That was not a satellite picture.
Download that silly picture you posted and check out the first bytes from 00 to 000020 with a hex editor and see for yourself.
But how could you?
Somebody who confuses a Hollywood movie title "conspiracy theory" with a theory and a conspiracy would be too stupid to know what a "hex editor" is either...let alone using it.
Hex address 00000 to 000020

43 52 45 41 54 4F 52 3A CREATOR:
20 67 64 2D 6A 70 65 67 gd-jpeg
20 76 31 2E 30 20 28 75 v1.0 (u
73 69 6E 67 20 49 4A 47 sing IJG
20 4A 50 45 47 20 76 36 JPEG v6
32 29 2C 20 71 75 61 6C 2), qual
69 74 79 20 3D 20 31 30 ity = 10
30 0A FF DB 00 43 00 01 0

and gd- version 1.0 to versions v6.2 is an open source image editor that can do what any other photo-shop image doctoring program can do.
That digital fingerprint tells me that this image has been retouched TWICE.
This is what the digital fingerprint of a satellite picture looks like that has not been "touched up":
web_intl_acttemps_world_600.jpg


Hex address 00000 to 000020
FF D8 FF E0 00 10 4A 46 ÿØÿà JF
49 46 00 01 01 01 00 48 IF H
00 48 00 00 FF FE 00 0C H ÿþ
31 33 36 34 39 33 36 34 13649364
30 30 FF DB 00 43 00 14 00ÿÛ C

Every picture has a digital fingerprint which can be read with a hex editor.
above hex 020 is the make of the camera and the date when the picture was taken:
20 00 4E 49 4B 4F 4E 20 NIKON
43 4F 52 50 4F 52 41 54 CORPORAT
49 4F 4E 00 4E 49 4B 4F ION NIKO
4E 20 44 31 20 00 00 00 N D1
01 2C 00 00 00 01 00 00 ,
01 2C 00 00 00 01 56 65 , Ve
72 2E 31 2E 30 35 00 00 r.1.05
32 30 30 32 3A 30 37 3A 2002:07:
And when you alter this picture in any way it shows up how you did it in 00 to 020
ÿØÿà JF IF HH ÿþ 13649364 is a factory specific code for an image scanner, which I`m too lazy to look up..but it`s clear that the "Weather Channel" did not alter the original Sat-image.

So unless you are clever enough to pull off a "conspiracy theory" to fool non-fools which you fancy calling "deniers"
Try again dimwit !
 
Last edited:
No I`m not "walking back".

Please clarify. At first, you said it was airbrushed through photoshop. That is, you strongly implied the data was deliberately manipulated/forged.

Are you accusing NCEP of forging data, or not?

That was not a satellite picture.

That's nice. But since I never said or implied it was, just what are you babbling about? I have no idea what this particular conspiracy theory of yours is all about.
 
By the way, this is a display of actual temp deviations for March. It's from station data, as opposed to a forecast. Looks like the forecast was correct.

g20130328_1025_15182_1.png


You can go over to the KNMI Climate Explorer site and make the chart yourself from the site raw data, if you'd like.

Climate Explorer: Starting point

Yeah, I could have uploaded my own chart to the cloud so I could put it here, but that seems pointless, given such a chart already exists on a blog. The point is that the actual station data blows away the "but ... but ... the prediction was wrong!" claim.
The point is that you posted a forecast which was not a satellite picture as a satellite picture, left off every thing the blogger who published that picture wrote on the same page and now you still insist that the forecast was right...while it was way off as it turned out .
sshot4cf.png

sshot1vp.png

The forecast jpg T-map was generated on March 18th @18:00 Z and was for for the next 5 following days.
The color coding was for deg C DEVIATIONS from the hockey stick "historic average" and you posted it, trying to pass it off as a satellite picture and as actual temperatures.
31913newsandrewcfs1wk50.jpg


Also, that's a very strange definition of "lie" you're using. How is posting a forecast a lie? You seem to be using a different version of English than the standard one.
Fuck are you ever twisted..! You got caught in a lie and then accuse me of calling a forecaster a liar because his forecast was wrong.
B.t.w. I`m not a "hard core conservative" and vote liberal in some elections, but liars like you discredit whatever sympathies middle of the road voters have for Democrats...because some of the liars like you organized neo-fascist mobs that smear and slander all opposition, including Democrats who don`t toe the line that wacko-extremists like you drew in the sand.
Herr Dr.Goebbels would be quite pleased if he knew how nicely his seeds are sprouting today.
P.S.:
You still have not told us which nuclear reactors you "used to run" and how to calibrate a tree ring or pollen count proxy thermometer.
We gave up on "Saigon,...the journalist in Finland". It`s going on 2 months and in the over 300 posts he spammed us since then he never addressed any direct questions.
You are doing the same and bury it with more spam, hoping that nobody can find it later.
 
Last edited:
PolarBear, the forecast was accurate, as the data confirmed. Reposting the same temperature charts yet another time is obviously a cowardly evasion on your part, since I've always been speaking of temperature differential, not temperature. I know it's cold in Greenland, but that's not the issue. The issue is it wasn't as cold as it usually was.

You called me a liar simply because I posted an accurate forecast that disagreed with your religious beliefs. You know I was correct, but being that your cult defines me as the enemy, you are emotionally incapable of admitting I was correct. Your cult orders you to lie about me, so you lie about me. That's the real lesson we learn here. Being that you'll lie so big about a matter so small, no one can trust a word you say on any topic.


You have the same posting style as saigon...though less refined....so who is the sock?
 
PolarBear, the forecast was accurate, as the data confirmed. Reposting the same temperature charts yet another time is obviously a cowardly evasion on your part, since I've always been speaking of temperature differential, not temperature. I know it's cold in Greenland, but that's not the issue. The issue is it wasn't as cold as it usually was.

You called me a liar simply because I posted an accurate forecast that disagreed with your religious beliefs. You know I was correct, but being that your cult defines me as the enemy, you are emotionally incapable of admitting I was correct. Your cult orders you to lie about me, so you lie about me. That's the real lesson we learn here. Being that you'll lie so big about a matter so small, no one can trust a word you say on any topic.

1.) Temperature is not one of my religious beliefs, nor do I know of any religion that is based on temperatures
2.) We are now well into Arctic sun rise. It`s April the 3rd and the sun is up for 14 hours each day already and the forecast you posted as an actual temperature is still wrong:
Greenland Weather Map

3.a)...:
Reposting the same temperature charts yet another time is obviously a cowardly evasion
I took a screenshot from the actual temp-map from the same date when you posted your bogus sat-picture because I knew that the actual map would no longer be there when you argue for the rest of the year that you did not lie.
3.b) The current map is a gif image and if you post a web page implanted gif with the HTML editor this forum uses the gif does not "play" but only shows the first gif of the series...here is the current one..its Gif#1 which are the isobars...that`s all you get if you right-click on an embedded gif

Greenland.pressure.6.cc23.gif


and here is the screenshot I uploaded from today, :
todayl.png


Still the same temperatures like the "cowardly evasion".
Now you have me carrying out secret "occult orders" ..."to lie about you".
All over sudden I`m part of a conspiracy while only yesterday you equated a wrong weather forecast as a "Met-office conspiracy theory".
since I've always been speaking of temperature differential, not temperature
That`s another lie!
You mocked all the posters who were commenting about the current spring time temperatures in their region and said how ridiculous they were looking in their own little backyard and posted that picture as "the big picture" of the entire arctic region as CURRENT ARCTIC TEMPERATURES.

You picked it of a blog and deliberately did not post the link to it, thinking we are all as dumb as you are and can`t find out where you got it from and in what context the blogger posted it...nor did you quote a single word that blogger posted with that picture.
And you call people who trapped you in your fucking lies "liars" following "occult orders to discredit you".
Fuck you are not just a liar you are a psychotic liar
Here is what you posted:

http://www.usmessageboard.com/environment/286367-wonder-where-chris-is.html#post7028146
The non-cultists understand that their backyard isn't the world.
Note the colder-than-normal USA and hotter-than-normal arctic. They're cancelling their ski races in Greenland because the snow has all melted. It's due to a very strong negative Arctic Oscillation, possibly a record breaker. Extremely high pressure over Greenland, which diverts the jet stream south, allowing Arctic air to blow south, and for warm air to come north to replace it
Your picture was from that source: climatecentral.org/images/sized/images/uploads/news/3_19_13_news_andrew_cfs1wk-500x368.jpg
Andrew_Freedman_Politco_Headshot-50x50.JPG

By Andrew Freedman
There is no mention of "They're cancelling their ski races in Greenland because the snow has all melted"

or " Extremely high pressure over Greenland, which diverts the jet stream south, allowing Arctic air to blow south, and for warm air to come north to replace it."

Matter of fact he said:
"The blocking High this year has been located near Greenland, whereas in March 2012, a dome of High pressure parked itself across the eastern third of the lower 48 states for weeks on end. "
Nowhere does he even mention the jet stream
And the picture you grabbed from there was the forecast generated on March 18th:
/images/sized/images/uploads/news/3_19_13_news_andrew_cfs1wk-500x368.jpg

3_19_13_news_andrew_cfs1wk-500x368.jpg


Which he replaced since you`ve been there last with a different one:
/images/uploads/news/3_19_13_news_andrew_gfsGreenlandhigh.jpg
3_19_13_news_andrew_gfsGreenlandhigh-500x375.jpg


The stuff that you made up:
"They're cancelling their ski races in Greenland because the snow has all melted
(it`s still -25C and colder)
and the ...allowing Arctic air to blow south, and for warm air to come north to replace it."

Was not forecast by the blogger and what YOU MADE UP ALL BY YOURSELF failed to happen.
He also revised his "anomalies" down to +6.4 for almost the entire region.

Fuck I pity the people who have to do business with you .
You are like these bitches who ram a parked car and tell their auto insurance agent you got rammed and the other driver ran away.
Are you related to Jodi Arias?
 
Last edited:
Wonder Where Chris is? My guess is his two year stint on unemployment ran out and he's greeting people and checking receipts at Wal-Mart.
 

Forum List

Back
Top