as a WAG (wild ass guess)
There's your problem, assuming your bad guesses have something to do with reality.
the easiest explanation is to give you guys partial credit for your 'it moves around' answer.
So precisely what about that simple concept is giving you so much trouble? If you can't grasp even the basics, it's going to be hard to take anything you say seriously.
your problem is you never use mathematical literacy to see if anything makes sense. pressure at sea level is from the mass of air above, pressure under water doubles at about 10 metres, oceans cover about 2/3rds of the globe so I added half again. I believe that 15 metres of ocean easily contains as much mass as the atmosphere, especially when you consider that any land mass above sea level displaces the same volume of air but of course I am trying to be conservative with my estimates. many of the ocena heat content graphs, especially in early days, dealt with the first 300 metres. 300m/15m = 20. you could add in the difference for specific heat capacity (another factor of 4) if you want. for me it is enough to know that any temperature translation from water to air is greater than one order of magnitude, and probably closer to two or more.
your other point is that warm water moves from one area to the next. I agree. but you are saying that the total ocean heat content goes up and down by sloshing water from one place to another? what????? either the energy is there or it isnt. moving the energy about doesnt increase or decrease it. one stack of 100 dollar bills= 4 stacks of 25 dollar bills= 10 stacks of 10 dollar bills.
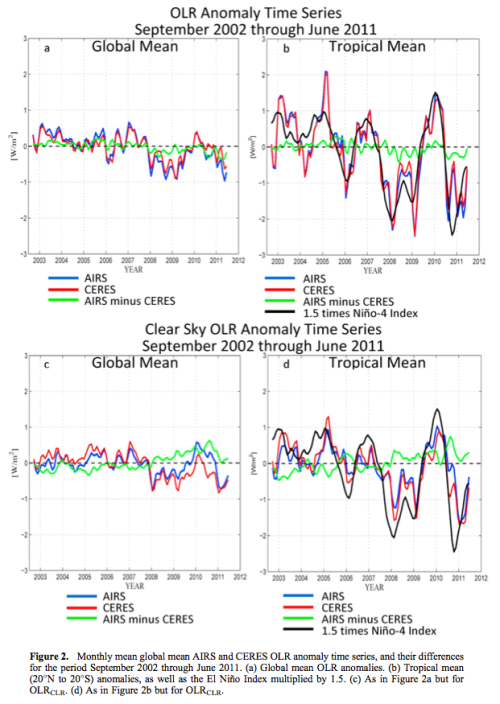
it is easy to understand how the oceans could be gradually gaining OHC. but they are supposedly going up and down by fairly large amounts, over short periods. that energy has to go in or come out through the surface. we should be able to look at satellite data for any of the spikes and see a rapid and large change in radiation from the surface but it isnt there.
as I said before, I think it is poor spacial coverage and poor algorithms for analyzing what data is available that produces unrealistic ocean heat content graphs with absolutely nonsensical estimates of error.