- Banned
- #1
This is the abstract of "A review of global ocean temperature observations: Implications for ocean heat content estimates and climate change"
by J. P. Abraham, M. Baringer, N. L. Bindoff, T. Boyer, L. J. Cheng, J. A. Church, J. L. Conroy, C. M. Domingues, J. T. Fasullo, J. Gilson, G. Goni, S. A. Good, J. M. Gorman, V. Gouretski, M. Ishii, G. C. Johnson, S. Kizu, J. M. Lyman, A. M. Macdonald, W. J. Minkowycz, S. E. Moffitt, M. D. Palmer, A. R. Piola, F. Reseghetti, K. Schuckmann, K. E. Trenberth, I. Velicogna and J. K. Willis
published in Reviews of Geophysics, Volume 51, Issue 3, pages 450–483, 3rd Quarter 2013
http://onlinelibrary.wiley.com/doi/10.1002/rog.20022/abstract
http://onlinelibrary.wiley.com/doi/10.1002/rog.v51.3/issuetoc
Abstract
[1] The evolution of ocean temperature measurement systems is presented with a focus on the development and accuracy of two critical devices in use today (expendable bathythermographs and conductivity-temperature-depth instruments used on Argo floats). A detailed discussion of the accuracy of these devices and a projection of the future of ocean temperature measurements are provided. The accuracy of ocean temperature measurements is discussed in detail in the context of ocean heat content, Earth's energy imbalance, and thermosteric sea level rise. Up-to-date estimates are provided for these three important quantities. The total energy imbalance at the top of atmosphere is best assessed by taking an inventory of changes in energy storage. The main storage is in the ocean, the latest values of which are presented. Furthermore, despite differences in measurement methods and analysis techniques, multiple studies show that there has been a multidecadal increase in the heat content of both the upper and deep ocean regions, which reflects the impact of anthropogenic warming. With respect to sea level rise, mutually reinforcing information from tide gauges and radar altimetry shows that presently, sea level is rising at approximately 3 mm yr^−1 with contributions from both thermal expansion and mass accumulation from ice melt. The latest data for thermal expansion sea level rise are included here and analyzed.
**********************************************************************
I was going to start this thread with the abstract from Murphy 2009 that I just cited to Westwall, but it doesn't seem to have much (as far as can be told from the abstract) beyond 2000. Murphy does give a heating rate of 1.1 Wm^-2 that closely matches the satellite info that Mamooth has put up repeatedly.
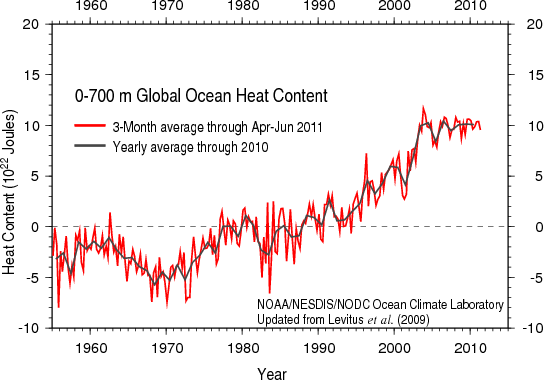
So, as I stated several times: the FACT that direct measurements show the Earth is accumulating solar energy at an increasing fact should REALLY mark the complete end of these IDIOTIC attempts to claim that global warming isn't taking place.
The only real question all along has been "Where is the heat going?" Since even before 1998, more than 90% of the trapped energy was going in to the oceans, it was always a prime candidate. Now loads of data from multiple studies show the heat that had been warming the surface at a good clip is very likely to be getting stashed in the deep oceans due to changes in ENSO circulation patterns.
by J. P. Abraham, M. Baringer, N. L. Bindoff, T. Boyer, L. J. Cheng, J. A. Church, J. L. Conroy, C. M. Domingues, J. T. Fasullo, J. Gilson, G. Goni, S. A. Good, J. M. Gorman, V. Gouretski, M. Ishii, G. C. Johnson, S. Kizu, J. M. Lyman, A. M. Macdonald, W. J. Minkowycz, S. E. Moffitt, M. D. Palmer, A. R. Piola, F. Reseghetti, K. Schuckmann, K. E. Trenberth, I. Velicogna and J. K. Willis
published in Reviews of Geophysics, Volume 51, Issue 3, pages 450–483, 3rd Quarter 2013
http://onlinelibrary.wiley.com/doi/10.1002/rog.20022/abstract
http://onlinelibrary.wiley.com/doi/10.1002/rog.v51.3/issuetoc
Abstract
[1] The evolution of ocean temperature measurement systems is presented with a focus on the development and accuracy of two critical devices in use today (expendable bathythermographs and conductivity-temperature-depth instruments used on Argo floats). A detailed discussion of the accuracy of these devices and a projection of the future of ocean temperature measurements are provided. The accuracy of ocean temperature measurements is discussed in detail in the context of ocean heat content, Earth's energy imbalance, and thermosteric sea level rise. Up-to-date estimates are provided for these three important quantities. The total energy imbalance at the top of atmosphere is best assessed by taking an inventory of changes in energy storage. The main storage is in the ocean, the latest values of which are presented. Furthermore, despite differences in measurement methods and analysis techniques, multiple studies show that there has been a multidecadal increase in the heat content of both the upper and deep ocean regions, which reflects the impact of anthropogenic warming. With respect to sea level rise, mutually reinforcing information from tide gauges and radar altimetry shows that presently, sea level is rising at approximately 3 mm yr^−1 with contributions from both thermal expansion and mass accumulation from ice melt. The latest data for thermal expansion sea level rise are included here and analyzed.
**********************************************************************
I was going to start this thread with the abstract from Murphy 2009 that I just cited to Westwall, but it doesn't seem to have much (as far as can be told from the abstract) beyond 2000. Murphy does give a heating rate of 1.1 Wm^-2 that closely matches the satellite info that Mamooth has put up repeatedly.
So, as I stated several times: the FACT that direct measurements show the Earth is accumulating solar energy at an increasing fact should REALLY mark the complete end of these IDIOTIC attempts to claim that global warming isn't taking place.
The only real question all along has been "Where is the heat going?" Since even before 1998, more than 90% of the trapped energy was going in to the oceans, it was always a prime candidate. Now loads of data from multiple studies show the heat that had been warming the surface at a good clip is very likely to be getting stashed in the deep oceans due to changes in ENSO circulation patterns.
Last edited: