What hiatus?

On the warm water volume and its changing relationship with ENSO | CU Sea Level Research Group

On the warm water volume and its changing relationship with ENSO

Abstract
ract Interannual equatorial Pacific 20°C isotherm depth variability since 1980 is dominated by two empirical orthogonal function (EOF) modes: The ‘tilt’ mode, having opposite signs in the eastern and western equatorial Pacific and in phase with zonal wind forcing and El Niño/Southern Oscillation (ENSO) indices; and a second EOF mode of one sign across the Pacific. Because the tilt mode is of opposite sign in the eastern and western equatorial Pacific while the second EOF mode is of one sign, the second mode has been associated with the warm water volume (WWV), defined as the volume of water above the 20°C isotherm from 5°S–5°N, 120°E–80W°. Past work suggested that the WWV led the tilt mode by about 2–3 seasons, making it an ENSO predictor. But after 1998 the lead has decreased and WWV-based predictions of ENSO have failed. We constructed a sea level-based WWV proxy back to 1955 and before 1973 it also exhibited a smaller lead. Analysis of data since 1980 showed that the decreased WWV lead is related to a marked increase in the tilt mode contribution to the WWV and a marked decrease in second mode EOF amplitude and its contribution. Both pre-1973 and post-1998 periods of reduced lead were characterized by “mean” La Niña-like conditions including a westward displacement of the anomalous wind forcing. According to recent theory, and consistent with observations, such westward displacement increases the tilt mode contribution to the WWV and decreases the second mode amplitude and its WWV contribution.

The full text is freely available in several formats at the link above.
 
IanC said:
I would like to point out that from late Feb to late March there has been a 1.4C increase in that part of the ocean. according to honest abe water has 4000 times the SH of air. and in the tradition of SkS we could say that that is the equivalent of a 5000C increase in atmospheric temperature. in one month, no less.

it is easy to see how CO2 interference in radiative transfer could do that, right? hahahahaha

Ian seems more confused, not understand that warm water is _moving_, not suddenly being created.


I was certainly hoping someone would try to make that point.

ocean heat content goes up and down, in increments that are too large to be accounted for. when the oceans are cooling where does the heat escape to? it is certainly not radiating from the surface because we would be able to see and measure it. where did it go? is something else eating the global warming that the oceans ate? turtles all the way down I guess. I am sure there will be another ad hoc excuse manufactured if that problem becomes publicized to the point of embarrassment.
 
I was certainly hoping someone would try to make that point.

Odd, that doesn't sound like someone in search of the truth.

ocean heat content goes up and down, in increments that are too large to be accounted for.

What does that mean? "Too large to be accounted for"??? What happens? Do we run out of units?

when the oceans are cooling where does the heat escape to? it is certainly not radiating from the surface because we would be able to see and measure it. where did it go? is something else eating the global warming that the oceans ate?

As the data clearly show, the ocean has done damn little cooling in the last several decades. On a regional basis, however, energy most certainly leaves the ocean for the atmosphere. Aside from the broad phenomena by which warm ocean waters moderate less temperate climates (consider the Gulf Stream and northern Europe or the Kurushio and western Canada), there is the more visible effect known alternately as hurricanes and typhoons. To suggest that we have no evidence of energy ever leaving the oceans is quite an ignorant one Ian. Until I got to your closing line I assumed you were being facetious.

turtles all the way down I guess.

Funny, but considering your deep and profound practice of ignoring mountains of evidence, I'd have pictured YOU as the old lady in Hawking's audience.

I am sure there will be another ad hoc excuse manufactured if that problem becomes publicized to the point of embarrassment.

We are not the ones embarrassed here Ian.
 
Last edited:
images


global-ocean-temperature-0-700m.gif


diff_hadsst.jpg


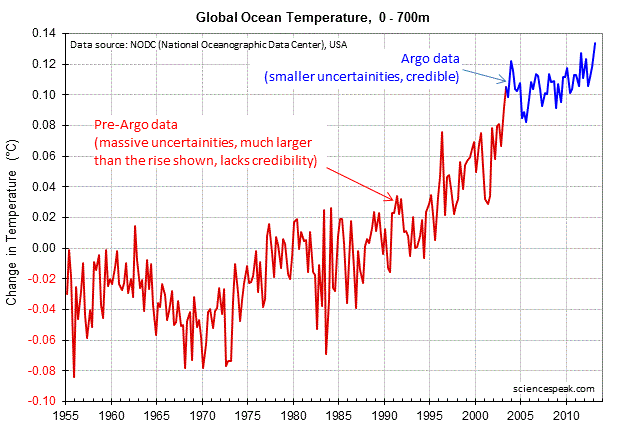
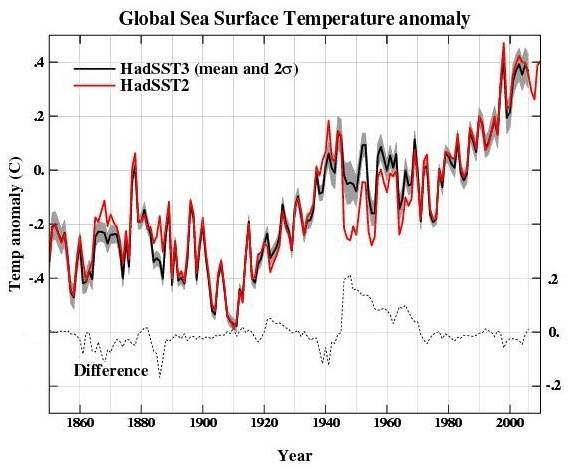
here are a few graphs. there are lots of spikes in global ocean temps, both up and down. you yourself said the specific heat of water is more than two orders of magnitude higher than the atmosphere. so a 0.1C change in ocean temp is similar to a 10C change in the atmosphere? I think we would wonder where the energy came from or went to if the atmosphere changed that much, dont you? must have been a whole lot of hurricanes that we didnt notice.
 
Here's a discussion and some data concerning that drop in sea level in 2011.

NASA Satellites Detect Pothole on Road to Higher Seas

Edited: 2011-08-23

Our colleagues at JPL have also been interested in how the global mean sea level is affected by the ENSO (i.e., El Niño and La Niña). They find that GRACE measurements helped to identify the distribution of abnormally high rainfall over land resulting from the recent strong La Niña. This temporary transfer of large volumes of water from the oceans to the land surfaces also helps explain the large drop in global mean sea level. But they also expect the global mean sea level to begin climbing again.

Like mercury in a thermometer, ocean waters expand as they warm. This, along with melting glaciers and ice sheets in Greenland and Antarctica, drives sea levels higher over the long term. For the past 18 years, the U.S./French Jason-1, Jason-2 and Topex/Poseidon spacecraft have been monitoring the gradual rise of the world's ocean in response to global warming.

While the rise of the global ocean has been remarkably steady for most of this time, every once in a while, sea level rise hits a speed bump. This past year, it's been more like a pothole: between last summer and this one, global sea level actually fell by about a quarter of an inch, or half a centimeter.

So what's up with the down seas, and what does it mean? Climate scientist Josh Willis of NASA's Jet Propulsion Laboratory, Pasadena, Calif., says you can blame it on the cycle of El Niño and La Niña in the Pacific.

earth20110823-640.jpg

2011_rel2: GMSL and Multivariate ENSO Index
Edited: 2011-07-29 Share

Discussion
The Multivariate ENSO Index (MEI) is the unrotated, first principal component of six observables measured over the tropical Pacific (see NOAA ESRL MEI, Wolter & Timlin, 1993,1998). To compare the global mean sea level to the MEI time series, we removed the mean, linear trend, and seasonal signals from the 60-day smoothed global mean sea level estimates and normalized each time series by its standard deviation. The normalized values plotted above show a strong correlation between the global mean sea level and the MEI, with the global mean sea level often lagging changes in the MEI. Since the MEI has recently sharply increased (coming out of a strong La Niña), we expect the global mean sea level estimates to also reverse their recent downward trend and begin to increase as the La Niña effects wane.

CU Sea Level Research Group | University of Colorado

I thought Obama lowered the oceans?
 
I don't see it Ssidd

sl_ns_global.png

Congratulations, once again you prove that you can't read a graph. The slow down in the rate of sea level rise is as clear as day on your graph. To bad you are to damned stupid to read it.

Ocean engineer indeed.
 
IanC said:
I would like to point out that from late Feb to late March there has been a 1.4C increase in that part of the ocean. according to honest abe water has 4000 times the SH of air. and in the tradition of SkS we could say that that is the equivalent of a 5000C increase in atmospheric temperature. in one month, no less.

it is easy to see how CO2 interference in radiative transfer could do that, right? hahahahaha

Ian seems more confused, not understand that warm water is _moving_, not suddenly being created.


I was certainly hoping someone would try to make that point.

ocean heat content goes up and down, in increments that are too large to be accounted for. when the oceans are cooling where does the heat escape to? it is certainly not radiating from the surface because we would be able to see and measure it. where did it go? is something else eating the global warming that the oceans ate? turtles all the way down I guess. I am sure there will be another ad hoc excuse manufactured if that problem becomes publicized to the point of embarrassment.

Just like the turtles...there are excuses all the way down.
 
images


global-ocean-temperature-0-700m.gif


diff_hadsst.jpg


here are a few graphs. there are lots of spikes in global ocean temps, both up and down. you yourself said the specific heat of water is more than two orders of magnitude higher than the atmosphere. so a 0.1C change in ocean temp is similar to a 10C change in the atmosphere? I think we would wonder where the energy came from or went to if the atmosphere changed that much, dont you? must have been a whole lot of hurricanes that we didnt notice.

He can't read graphs. Maybe you could draw him a picture of some sort...perhaps with smiling bunnies, or happy puppies...or maybe kittens and puppies being run through a meat grinder are more to his embittered taste.
 
Last edited:
I said the specific heat capacity of water is roughly 4,000 times that of air BY VOLUME. You guys need to pay a little more attention to the details.

I'm quite certain I have significantly more experience making and reading graphs than either of you two.

I find it interesting that your "not credible" pre-ARGO data matches the credible ARGO data in slope, deviation and sectorized RMS by the look of it. Is that just a coincidence?
 
Last edited:
here are a few graphs. there are lots of spikes in global ocean temps, both up and down. you yourself said the specific heat of water is more than two orders of magnitude higher than the atmosphere. so a 0.1C change in ocean temp is similar to a 10C change in the atmosphere? I think we would wonder where the energy came from or went to if the atmosphere changed that much, dont you? must have been a whole lot of hurricanes that we didnt notice.

As I corrected you above, I said the ratio was roughly 4000 by volume. By mass, it's about four fold. 0.1 -> 0.4. Roughly.

And, again, as Mamooth pointed out, the rise in temperature in that deep water is NOT from new or radically increased heating. It is from altered circulation patterns subducting warm surface waters along the continental margins and replacing them with nice cold water from the depths. This gives the appearance of slowed surface warming yet in fact is not due to any change in the radiative imbalance and actually reduces the heat loss of the system as a whole - it will INCREASE the radiative imbalance. This is fairly poetic justice. You guys fall all over yourselves claiming global warming has ended when in fact the very changes you tout as evidence of our redemption are evidence of no such thing and are, in fact, only making things worse.
 
Last edited:
I said the specific heat capacity of water is roughly 4,000 times that of air BY VOLUME. You guys need to pay a little more attention to the details.

I'm quite certain I have significantly more experience making and reading graphs than either of you two.

I find it interesting that your "not credible" pre-ARGO data matches the credible ARGO data in slope, deviation and sectorized RMS by the look of it. Is that just a coincidence?


ya know, I keep trying to prod you into thinking for yourself but you never take the bait.

as a WAG (wild ass guess) I would say that the mass of the atmosphere is equivalent to about 15 metres of the oceans. so a 0.1C change in the first 300m translates to a 2C change in the atmosphere. oops, add in a factor of four for specific heat, 8C. considerably more if you go down to 700m or 2000m. and all that energy has to pass through the surface. even spread out over the vast area of the ocean's surface, I'm guessing that flux is well over 100w, in either direction depending on the spike. I kinda think we would notice.

but wait!!!! you guys have a magic answer! its not new warmer (or cooler) water, it just moved from somewhere else. funny but I thought the graphs saidGlobal. if I have a hundred bucks in my jeans and I move some into different pockets dont I still only have a hundred bucks?

the easiest explanation is to give you guys partial credit for your 'it moves around' answer. perhaps it is just sampling error due to poor spacial coverage. but that would make the stated error bars ridiculously exaggerated. just for fun, does anyone want to guess how many ARGO readings per year a volume of water the size of Lake Superior gets if measured at the same rate as the oceans? hahahahahaha
 
And do you have any idea how much temperature variation by latitude and longitude you'll find in the typical "Lake Superior-sized" piece of ocean?, particularly below 700 meters? The primary value of the ARGO data is depth. The most common XBT goes to 2500 feet, but we have millions of such traces. Sippican's deepest XBT probe goes to 6,000 feet but it's roughly three times the price of the shallower model and has a greater impact on the dropping vessel (slower for longer).

Admitting your mistake in the form of condescension doesn't get you very far. The world's oceans, as a whole, are getting warmer. The planet as a whole is getting warmer. The cessation of surface warming you've been so excited about seems to be a result of internal heat transfers. Take your "partial credit" and shove it where the sun don't shine.
 
Last edited:
And do you have any idea how much temperature variation by latitude and longitude you'll find in the typical "Lake Superior-sized" piece of ocean?, particularly below 700 meters? The primary value of the ARGO data is depth. The most common XBT goes to 2500 feet, but we have millions of such traces. Sippican's deepest XBT probe goes to 6,000 feet but it's roughly three times the price of the shallower model and has a greater impact on the dropping vessel (slower for longer).

Admitting your mistake in the form of condescension doesn't get you very far. The world's oceans, as a whole, are getting warmer. The planet as a whole is getting warmer. The cessation of surface warming you've been so excited about seems to be a result of internal heat transfers. Take your "partial credit" and shove it where the sun don't shine.

Round and round and round she goes...find the pea. If you had the mental acuity required to view yourself from the skeptic point of view, you would abandon this board out of sheer embarrassment and humiliation.
 
On the warm water volume and its changing relationship with ENSO | CU Sea Level Research Group

On the warm water volume and its changing relationship with ENSO

Abstract
ract Interannual equatorial Pacific 20°C isotherm depth variability since 1980 is dominated by two empirical orthogonal function (EOF) modes: The ‘tilt’ mode, having opposite signs in the eastern and western equatorial Pacific and in phase with zonal wind forcing and El Niño/Southern Oscillation (ENSO) indices; and a second EOF mode of one sign across the Pacific. Because the tilt mode is of opposite sign in the eastern and western equatorial Pacific while the second EOF mode is of one sign, the second mode has been associated with the warm water volume (WWV), defined as the volume of water above the 20°C isotherm from 5°S–5°N, 120°E–80W°. Past work suggested that the WWV led the tilt mode by about 2–3 seasons, making it an ENSO predictor. But after 1998 the lead has decreased and WWV-based predictions of ENSO have failed. We constructed a sea level-based WWV proxy back to 1955 and before 1973 it also exhibited a smaller lead. Analysis of data since 1980 showed that the decreased WWV lead is related to a marked increase in the tilt mode contribution to the WWV and a marked decrease in second mode EOF amplitude and its contribution. Both pre-1973 and post-1998 periods of reduced lead were characterized by “mean” La Niña-like conditions including a westward displacement of the anomalous wind forcing. According to recent theory, and consistent with observations, such westward displacement increases the tilt mode contribution to the WWV and decreases the second mode amplitude and its WWV contribution.

The full text is freely available in several formats at the link above.
You haven`t even got the slightest clue what the paper you posted is all about. How does any of this substantiate that the deeper layers are getting warmer?
All they have been investigating is how the "tilt mode" cancels out the contribution of the Warm Water Volume, (the 2.nd mode)
According to recent theory, and consistent with observations, such westward displacement increases the tilt mode contribution to the WWV and decreases the second mode amplitude and its WWV contribution.
After all that`s what an orthogonal function is all about, 2 vectors v and w which have a product of ZERO.
This so called "tilt mode", (v) the first mode, is not a function of increased temperature but is caused by equatorial trade winds.
The second mode, the WWV (w) is defined as shallow water above the 20 C isotherm in a very specific region, not globally.
It only extends from the surface down to ~ 150 meters :
sst_prof_03.jpg

That was yet another typical "Abraham3" post. You had no idea what any of it meant but used it as usual to fake your non-existent knowledge of math & physics.
 
I said the specific heat capacity of water is roughly 4,000 times that of air BY VOLUME. You guys need to pay a little more attention to the details.

I'm quite certain I have significantly more experience making and reading graphs than either of you two.

I find it interesting that your "not credible" pre-ARGO data matches the credible ARGO data in slope, deviation and sectorized RMS by the look of it. Is that just a coincidence?


ya know, I keep trying to prod you into thinking for yourself but you never take the bait.

as a WAG (wild ass guess) I would say that the mass of the atmosphere is equivalent to about 15 metres of the oceans. so a 0.1C change in the first 300m translates to a 2C change in the atmosphere. oops, add in a factor of four for specific heat, 8C. considerably more if you go down to 700m or 2000m. and all that energy has to pass through the surface. even spread out over the vast area of the ocean's surface, I'm guessing that flux is well over 100w, in either direction depending on the spike. I kinda think we would notice.

but wait!!!! you guys have a magic answer! its not new warmer (or cooler) water, it just moved from somewhere else. funny but I thought the graphs saidGlobal. if I have a hundred bucks in my jeans and I move some into different pockets dont I still only have a hundred bucks?

the easiest explanation is to give you guys partial credit for your 'it moves around' answer. perhaps it is just sampling error due to poor spacial coverage. but that would make the stated error bars ridiculously exaggerated. just for fun, does anyone want to guess how many ARGO readings per year a volume of water the size of Lake Superior gets if measured at the same rate as the oceans? hahahahahaha


He can't think for himself. That's the point, him, the admiral, trolling blunder, olfraud, they ALL are merely drone propagandists spewing out whatever their masters tell them to.
They haven't had an original thought since they were born...or created in the case of our multitudinous enviro socks!:lol:
 
as a WAG (wild ass guess)

There's your problem, assuming your bad guesses have something to do with reality.

the easiest explanation is to give you guys partial credit for your 'it moves around' answer.

So precisely what about that simple concept is giving you so much trouble? If you can't grasp even the basics, it's going to be hard to take anything you say seriously.
 
He can't think for himself. That's the point, him, the admiral, trolling blunder, olfraud, they ALL are merely drone propagandists spewing out whatever their masters tell them to.
They haven't had an original thought since they were born...or created in the case of our multitudinous enviro socks!:lol:

With some denialists, we've literally been able to observe their mental capabilities declining over the months. That indicates either substance abuse or senility.
 
That was yet another typical "Abraham3" post. You had no idea what any of it meant but used it as usual to fake your non-existent knowledge of math & physics.

Not just fake knowledge of math and physics bear, he claims to be a f'ing ocean engineer. How rich is that?
 
With some denialists, we've literally been able to observe their mental capabilities declining over the months. That indicates either substance abuse or senility.

Those aren't denialists hairball....that's a mirror you are looking at.
 
On the warm water volume and its changing relationship with ENSO | CU Sea Level Research Group

On the warm water volume and its changing relationship with ENSO

Abstract
ract Interannual equatorial Pacific 20°C isotherm depth variability since 1980 is dominated by two empirical orthogonal function (EOF) modes: The ‘tilt’ mode, having opposite signs in the eastern and western equatorial Pacific and in phase with zonal wind forcing and El Niño/Southern Oscillation (ENSO) indices; and a second EOF mode of one sign across the Pacific. Because the tilt mode is of opposite sign in the eastern and western equatorial Pacific while the second EOF mode is of one sign, the second mode has been associated with the warm water volume (WWV), defined as the volume of water above the 20°C isotherm from 5°S–5°N, 120°E–80W°. Past work suggested that the WWV led the tilt mode by about 2–3 seasons, making it an ENSO predictor. But after 1998 the lead has decreased and WWV-based predictions of ENSO have failed. We constructed a sea level-based WWV proxy back to 1955 and before 1973 it also exhibited a smaller lead. Analysis of data since 1980 showed that the decreased WWV lead is related to a marked increase in the tilt mode contribution to the WWV and a marked decrease in second mode EOF amplitude and its contribution. Both pre-1973 and post-1998 periods of reduced lead were characterized by “mean” La Niña-like conditions including a westward displacement of the anomalous wind forcing. According to recent theory, and consistent with observations, such westward displacement increases the tilt mode contribution to the WWV and decreases the second mode amplitude and its WWV contribution.

The full text is freely available in several formats at the link above.
You haven`t even got the slightest clue what the paper you posted is all about. How does any of this substantiate that the deeper layers are getting warmer?
All they have been investigating is how the "tilt mode" cancels out the contribution of the Warm Water Volume, (the 2.nd mode)
According to recent theory, and consistent with observations, such westward displacement increases the tilt mode contribution to the WWV and decreases the second mode amplitude and its WWV contribution.
After all that`s what an orthogonal function is all about, 2 vectors v and w which have a product of ZERO.
This so called "tilt mode", (v) the first mode, is not a function of increased temperature but is caused by equatorial trade winds.
The second mode, the WWV (w) is defined as shallow water above the 20 C isotherm in a very specific region, not globally.
It only extends from the surface down to ~ 150 meters :
sst_prof_03.jpg

That was yet another typical "Abraham3" post. You had no idea what any of it meant but used it as usual to fake your non-existent knowledge of math & physics.

It says we do in fact have an El Nino on the way.
 
Last edited:

Forum List

Back
Top