
http://upload.wikimedia.org/wikipedia/commons/f/f3/Hoover-dam-lake-mead.JPG
Lake Mead
In slightly longer than a decade, Nevada's Lake Mead — which sits down river from Lake Powell on the Colorado River — has seen its total volume drop by more than 60 percent. Persistant drought and increased demand have wreaked havoc on water levels, sometimes draining three feet of depth in a month. Now, the lake is listed at about 1,100 feet above sea level, a foot below the previous all-time low set in 1937. With demand not letting up and climate change warming things up, it doesn't look good for Lake Mead. Water managers have the option of releasing water from Lake Powell to raise Lake Mead, but that doesn't solve the problem of not having enough water in the system in the first place
7 lakes and rivers that are drying up: Lake Mead | MNN - Mother Nature Network
Yeah? So? Lake Mead has been that low before as you would have figured out had you done a simple search so once again this is nothing new.
* Lake Mead Water Levels
Don't you sometimes feel cheated when GoldiRocks sends us on these wild goose chases because he's panicky and scared and there's NOT a monster under the bed? Can we split the cost for a night light??
Ever wonder where the water in Lake Mead has gone?
It went HERE !!!
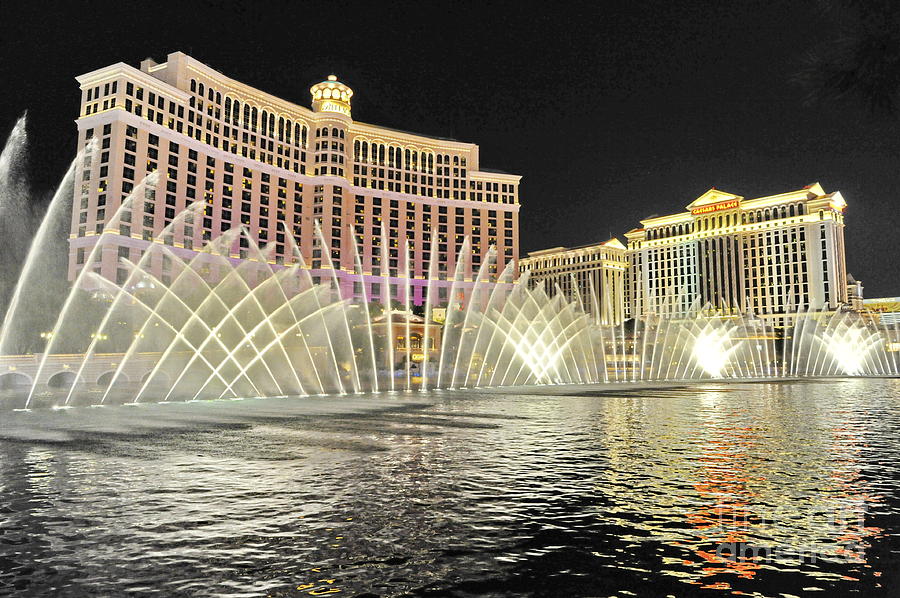
AND HERE !!!

Somehow GoldiRocks doesn't get the function of a man-made water reservoir and seems to think that opening and closing the gate has less of an effect than the 1 degF rise in temp we've seen since we were born.. But that's because he reads scary stories from Mother Earth News before bedtime..
Low Water - Lake Mead National Recreation Area
As a resevoir, Lake Mead is designed to fluctuate in order to provide the southwest with a reliable source of water during times of drought, such as is being experienced now.
In some years, Lake Mead receives much more than the minimum amount of water from the Upper Basin, but the amount of water released from Lake Mead does not vary much from year to year. The water level in Lake Mead is lower than it has been in over 40 years. The water is going down because the Colorado River runoff over the last decade starting in 1998 has been far below normal.
Water: Lake Mead Is at Record Low Levels. Is the Southwest Drying Up? | TIME.com
What’s causing Lake Mead to dry up—and what does it mean for the Southwest? The one undeniable cause is simple growth—Las Vegas has grown from 25,000 people in 1950 to some 2 million today. That means more lawns, more laundry, more swimming pools, more car washes—in general, more straws sucking the water out of Lake Mead. And of course Las Vegas isn’t the only area in the Southwest to experience booming growth over the past few decades. From Denver to Phoenix to Los Angeles, the once lightly populated West has exploded, even as farmers in the region draw more water from the system to irrigate the desert.
But the scary thing is that the territory might be more vulnerable to drought than it seemed during the 20th century—a time period that may have been unusually wet on a historical scale. A 2007 panel organized by the National Research Council found evidence that mega-droughts had occurred in the Southwest more frequently than had been thought, and that “drought episodes are a recurrent and integral feature of the region’s climate.”
Then there’s climate change, an X factor for future water supplies. It’s difficult to gauge what impact, if any, global warming may have had on the current drought and on dropping water levels. As always, it’s virtually impossible to filter out climate change as a cause for a natural disaster amid all the noise and static of other factors. But as the recent report from the government U.S. Global Change Research Program shows, the Southwest is already rapidly warming, reducing the spring mountain snowpack that helps feed the rivers of the region. We’re likely to see increasing temperatures in the future, with more frequent drought and increasingly scarce water supplies. (See the rather alarming graph above.) Climate change won’t be the only cause behind the drying of the West, but could make a bad situation much, much worse.
Ahhhh yes the US Global Change Research Program with it "warming rapidly" assfarts. Even tho "it’s virtually impossible to filter out climate change as a cause for a natural disaster amid all the noise and static of other factors."
Like those Las Vegas attractions above.. But GOLDIROCKS can hear it coming....
Last edited:


