
"There are three kinds of lies; there's lies, damned lies, and statistics."- Twain
Navigation
Install the app
How to install the app on iOS
Follow along with the video below to see how to install our site as a web app on your home screen.

Note: This feature currently requires accessing the site using the built-in Safari browser.
More options
You are using an out of date browser. It may not display this or other websites correctly.
You should upgrade or use an alternative browser.
You should upgrade or use an alternative browser.
Tree Ring proxies- RIP
- Thread starter IanC
- Start date
- Thread starter
- #22
"There are three kinds of lies; there's lies, damned lies, and statistics."- Twain
One of the main problems with climate science is that they neither seek out or accept advice from statistians. They often use novel methodologies that are incorrect for the purpose.
I thought they were mostly using ice core samples.
In the early days, scientists would hitch a ride on a ship and scoop up water in a canvas bag. They'd take the bag below deck and measure the temperature with a mercury thermometer.
Since very recently, we've been using satellite readings. Different methodologies lead to different results.
In the early days, scientists would hitch a ride on a ship and scoop up water in a canvas bag. They'd take the bag below deck and measure the temperature with a mercury thermometer.
Since very recently, we've been using satellite readings. Different methodologies lead to different results.
- Thread starter
- #24
Interesting that you use the 'wildly differant' shapes as though that were some sort of evidence. Since each proxy is a measure of a differant quantity, that means some would go up, some down, with increasing or decreasing temperature, rainfall, or other factors.
Ian, the scientists are doing careful deliberate work, you skeptics have destroyed any credibility you ever had by careless statements, and by the use of 'evidence' that has been completely destroyed by careful research.
Up to 2000, you were all stating that there was no warming, that it was all fudged data. After everyone could see that there was indeed some pretty strong warming, then you stated that it was natural varition from natural causes, but cannot name those causes. Today, you are stating that there is going to be cooling in the future, yet cannot name why, or how much.
The scientists studying this issue, state there is going to be warming, and by at least 2 C by the end of this century. This year, neutral ENSO, decline in TSI, looks like it will be the warmest on record. Some cooling.
Deflection Old Rocks. Talk about your 73 proxies not straw man positions that you give to the wildly diverse groups that you clump together as 'skeptics'.
The recent large change to the Arctic portion of Pages2K was due in most part to one proxy that was flipped upsidedown into the correct orientation (while leaving another similar proxy in the wrong orientation). Many, or most of these proxies are arbitrarily used or selected by their usefulness to a preconceived conclusion.
I can't help but notice that you are running away from a topic you brought up. Again.
You love to link to press releases but when someone wants to discuss the details you turn turtle.
- May 20, 2009
- 144,519
- 66,928
- 2,330
Interesting that you use the 'wildly differant' shapes as though that were some sort of evidence. Since each proxy is a measure of a differant quantity, that means some would go up, some down, with increasing or decreasing temperature, rainfall, or other factors.
Ian, the scientists are doing careful deliberate work, you skeptics have destroyed any credibility you ever had by careless statements, and by the use of 'evidence' that has been completely destroyed by careful research.
Up to 2000, you were all stating that there was no warming, that it was all fudged data. After everyone could see that there was indeed some pretty strong warming, then you stated that it was natural varition from natural causes, but cannot name those causes. Today, you are stating that there is going to be cooling in the future, yet cannot name why, or how much.
The scientists studying this issue, state there is going to be warming, and by at least 2 C by the end of this century. This year, neutral ENSO, decline in TSI, looks like it will be the warmest on record. Some cooling.
We're saying there's no warming, because there's been no warming for 2 decades
- Apr 1, 2011
- 170,026
- 47,214
- 2,180
Yeah, I've been saying its a fraud since at least 1995.more exposed fraud..........AGW is a hoax. Said it nearly 20 years ago.
One of the main problems with climate science is that they neither seek out or accept advice from statistians.
Do you have some substantiation for that assertion?
- Thread starter
- #28
One of the main problems with climate science is that they neither seek out or accept advice from statistians.
Do you have some substantiation for that assertion?
for one, the Wegman Report laid it out pretty concisely.
- Thread starter
- #29
True face of climate s hockey stick graph revealed - environment - 07 March 2013 - New Scientist
Shaun Marcott of Oregon State University in Corvallis and colleagues have compiled 73 such proxies from around the world, all of which reach back to the end of the last glacial period, 11,300 years ago. During this period, known as the Holocene, the climate has been relatively warm – and civilisation has flourished.
"Most global temperature reconstructions have only spanned the past 2000 years," says Marcott.
Marcott's graph shows temperatures rising slowly after the ice age, until they peaked 9500 years ago. The total rise over that period was about 0.6 °C. They then held steady until around 5500 years ago, when they began slowly falling again until around 1850. The drop was 0.7 °C, roughly reversing the previous rise.
Then, in the late 19th century, the graph shows temperatures shooting up, driven by humanity's greenhouse gas emissions.
Hmmmmmmm................ 73 differant proxies.
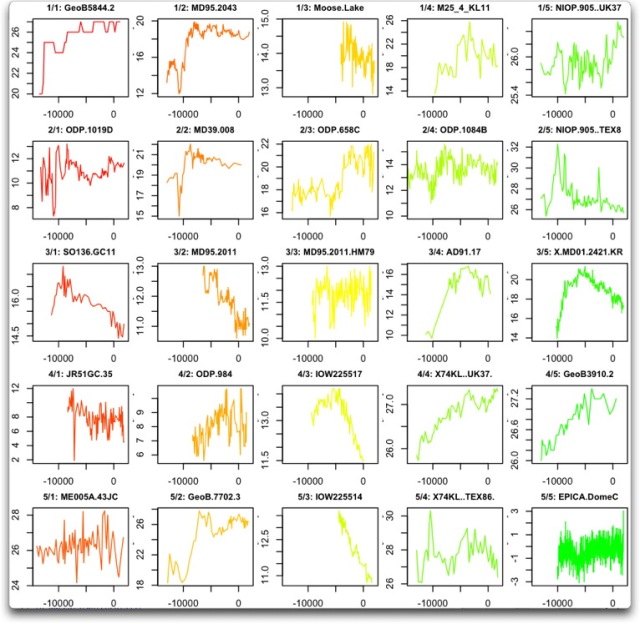
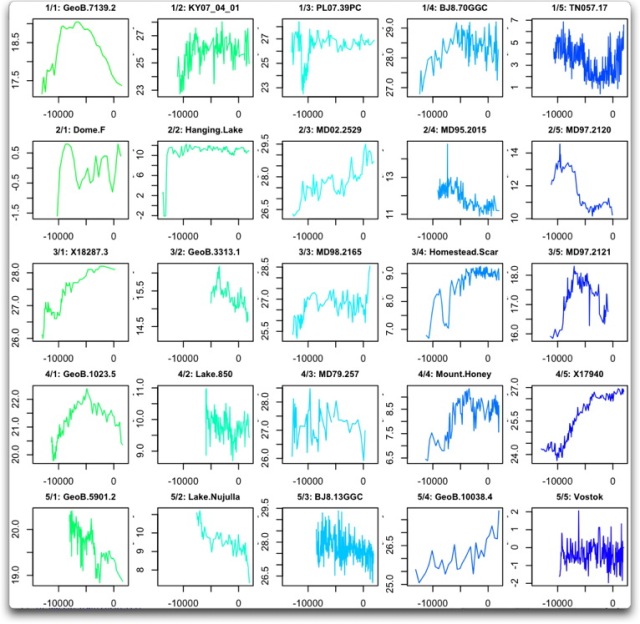
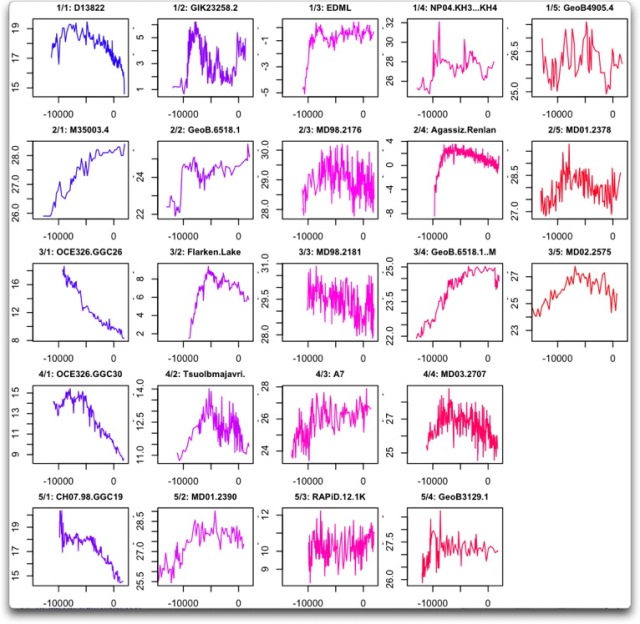
which one of the 73 proxies do you consider to be the smoking gun?
more on the Marcott proxies--
only 9 extend into the period 1950+, when 'climate change' hit its stride.


none of those eight have a hockey stick, which brings us to the last one-

this just makes it into post 1950 era. the last two data points are from 1940 and 1960. rapid warming out of the LIA to 1940, then a half degree C plunge to 1960.
I agree with Marcott, who said the modern portion of his reconstruction was "not robust".
Similar threads
- Replies
- 102
- Views
- 7K
Latest Discussions
- Replies
- 35
- Views
- 116
Forum List
-
-
-
-
-
Political Satire 8085
-
-
-
-
-
-
-
-
-
-
-
-
-
-
-
-
-
-
-
ObamaCare 781
-
-
-
-
-
-
-
-
-
-
-
Member Usernotes 471
-
-
-
-
-
-
-
-
-
-