Hockey Stick 30 years of junk science

Sunsettommy

Diamond Member
Mar 19, 2018
14,896
12,529
2,400
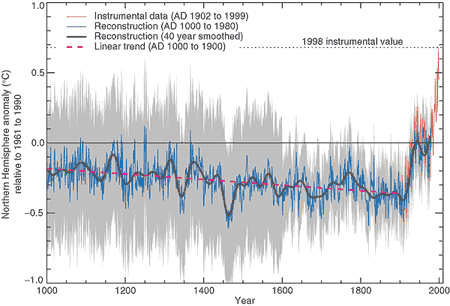
A paper by Dr. Mann et al, was published in 1998 making outlandish claims (covering only the Northern Hemisphere) that crept into the 2001 IPCC report despite not being validated or reproduced by anyone.

Because of the dishonest support by the IPCC, it got undeserved support because NO ONE has yet posted a paper reproducing it thus a paper sailed through without knowing if it was good or bad.

Eventually the paper was exposed as junk by THIS PAPER in 2005 that set off a firestorm.

Today only silly warmists cling to this massive failure despite that it contradicted decades of research, that it covers only the continental Northern hemisphere.

His main proxy, Bristlecone Pine tree data was taken from a 1993 paper by Isdo and Graybill, as shown HERE

McKitrick stated:

"A very brief summary of the problems of the hockey stick would go like this. Mann’s algorithm, applied to a large proxy data set, extracted the shape associated with one small and controversial subset of the tree rings records, namely the bristlecone pine cores from high and arid mountains in the US Southwest. The trees are extremely long-lived, but grow in highly contorted shapes as bark dies back to a single twisted strip. The scientists who published the data (Graybill and Idso 1993) had specifically warned that the ring widths should not be used for temperature reconstruction, and in particular their 20th century portion is unlike the climatic history of the region, and is probably biased by other factors."

bolding mine

The paper is wrong in so many ways.....................
Only honest ancient proxy researcher of the lot was Marcott. He emphasized that his study (some of the same proxies used by others) did not have ANY temporal resolution beyond a couple hundred years when the data preparation was done. And only MINIMAL temporal resolution over a 500 year period.

So they are NOT measuring ancient temperatures and finding trends anywhere NEAR the modern record. It's all just looking at a highly filtered low resolution running mean.

You can't deduce CRAP about monthly, yearly, decadal variations from ANY of them.

But the DISHONEST ones like Mann -- simply spliced the modern record with DAILY temporal resolution right onto the sparse and variance free ancient records. That's actually fraudulent to ANY reasonable scientist.
 
Marcott has a stated average resolution of 120 years, while most thermometers have a resolution in minutes......

Proxy and Temperature data don't match at all.
 
Trying to get any of the alarmists here to understand spatial resolution is a errand in futility. I've been trying for several years here now to teach some to no avail. They simply can not understand how placing today going backwards into a 500 year average (the average of most long term proxies) would wipe out their little warming blip, unlike Mann's deception.
 
Last edited:
Don't you deniers ever get tired of posting the same debunked lies????

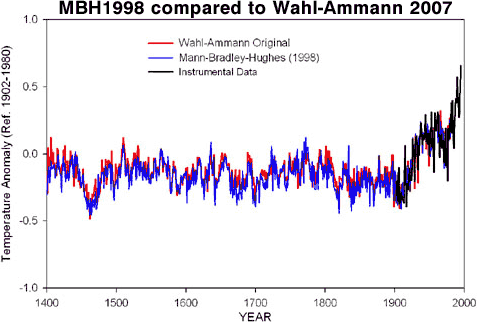
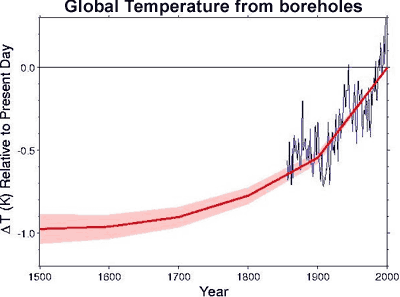
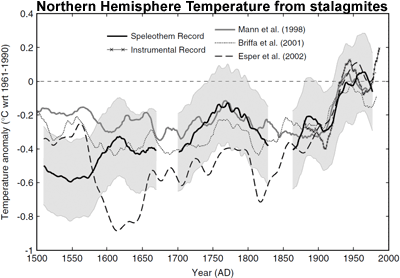
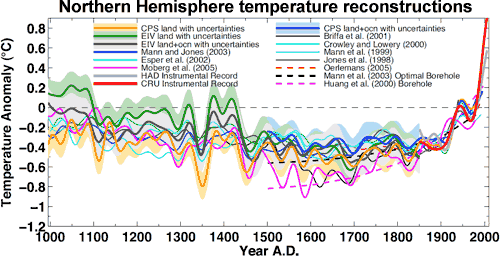
Mann's hockey stick has been confirmed over and over again by many different proxies as well as direct instrument measurement.

hockey_stick_TAR.gif


MBH1999_Wahl_2007.gif


Hockey_Stick_borehole.gif


Hockey_Stick_Stalagmite.gif


NH_Temp_Reconstruction.gif


Wait a second " direct instrument measurement "


Say What??????


Bhahahahahahahaha
 
Don't you deniers ever get tired of posting the same debunked lies????

Mann's hockey stick has been confirmed over and over again by many different proxies as well as direct instrument measurement.

hockey_stick_TAR.gif


MBH1999_Wahl_2007.gif


Hockey_Stick_borehole.gif


Hockey_Stick_Stalagmite.gif


nt
I see your using the Karl Et AL output data for your graphs. Have you removed the intentional bias that was applied? I believe it was 0.48degC that was used to change the last 100 years upward and hide the MEWP and RWP..

I also noticed that you also attached the empirical (and heavily adjusted upward) record to the proxy record backwards. You do realize that the last 100 years in the bottom graph should be reduced to a single point after an average was made... Don't you?

You made the same failed and deceptive lies that Hansen did along with all of his other followers, who lie to try and give him credibility... WHat do you call a group of people who use the same deception techniques over and over again after they have been shown it is deception?
 
Last edited:
Don't you deniers ever get tired of posting the same debunked lies????

Mann's hockey stick has been confirmed over and over again by many different proxies as well as direct instrument measurement.

hockey_stick_TAR.gif


MBH1999_Wahl_2007.gif


Hockey_Stick_borehole.gif


Hockey_Stick_Stalagmite.gif


NH_Temp_Reconstruction.gif


Wait a second " direct instrument measurement "


Say What??????


Bhahahahahahahaha
Direct measurement only goes back to about the early 1800's...

He is so full of crap it isn't funny..


I would like to give him the benefit of the doubt and maybe it was a typo or he was not thinking clearly ...
 
upload_2018-4-26_20-2-18.png


Lets see if EDTHECYNIC can post up the spatial resolutions of each and every paper that YOU listed from just this one graphic... The longest one is how far back you must go from today to make the present day average plot point.
 
Don't you deniers ever get tired of posting the same debunked lies????

Mann's hockey stick has been confirmed over and over again by many different proxies as well as direct instrument measurement.

hockey_stick_TAR.gif


MBH1999_Wahl_2007.gif


Hockey_Stick_borehole.gif


Hockey_Stick_Stalagmite.gif


nt
I see your using the Karl Et AL output data for your graphs. Have you removed the intentional bias that was applied? I believe it was 0.48degC that was used to change the last 100 years upward and hide the MEWP and RWP..

I also noticed that you also attached the empirical (and heavily adjusted upward) record to the proxy record backwards. You do realize that the last 100 years in the bottom graph should be reduced to a single point after an average was made... Don't you?

You made the same failed and deceptive lies that Hansen did along with all of his other followers, who lie to try and give him credibility... WHat do you call a group of people who use the same deception techniques over and over again after they have been shown it is deception?
Global warming deniers.
 
Wait a second " direct instrument measurement "


Say What??????


Bhahahahahahahaha
Direct measurement only goes back to about the early 1800's...

He is so full of crap it isn't funny..
Two idiots who can't even read a chart, no wonder they are STUPID enough to be deniers!!!

Clearly the graph lists HAD Instrumental Record (solid gray) and CRU Instrumental Record (solid red) as lines on the graph and as you can clearly see those lines begin around 1850. Many of the data lines do not run the full 1,000 years, but you two are not observant enough to see that, which is why you are so easily deceived by your fellow lying global warming deniers.

upload_2018-4-26_20-2-18-png.190189
 
This is what it should (approximately) look like, properly pointed at 250 year resolution.

View attachment 190193

Edits in yellow highlight are mine
No, that's what it looks like when you simply photoshop the real graph!

How do you [get] readings accurate to a tenth of a degree on a data set that's 1,000 years old?
That has been explained to you many times in many threads and yet you still play dumb.
What happens if you average 10 and 11, you get an average of 10.5 accurate to a tenth.
Deniers pretend NOT to understand simple arithmetic but claim to be the smartest people in the universe. :cuckoo:
 
Wait a second " direct instrument measurement "


Say What??????


Bhahahahahahahaha
Direct measurement only goes back to about the early 1800's...

He is so full of crap it isn't funny..
Two idiots who can't even read a chart, no wonder they are STUPID enough to be deniers!!!

Clearly the graph lists HAD Instrumental Record (solid gray) and CRU Instrumental Record (solid red) as lines on the graph and as you can clearly see those lines begin around 1850. Many of the data lines do not run the full 1,000 years, but you two are not observant enough to see that, which is why you are so easily deceived by your fellow lying global warming deniers.

upload_2018-4-26_20-2-18-png.190189


What scientist in their right mind would take more then a passing glance of combining proxies with actual data ????


Once again fool you said the bullshit hockey stick graph was backed up with actual instrumentation ... that is a lie
 
Don't you deniers ever get tired of posting the same debunked lies????

Mann's hockey stick has been confirmed over and over again by many different proxies as well as direct instrument measurement.

hockey_stick_TAR.gif


MBH1999_Wahl_2007.gif


Hockey_Stick_borehole.gif


Hockey_Stick_Stalagmite.gif


NH_Temp_Reconstruction.gif

First of all you ignored the evidence in post #1.

Second, you post THIS comment with ZERO source links for the charts.

Third, Dr. Mann's paper was for about 25% of the planets surface since it was for the Northern Hemisphere land surface only.

Fourth, grafting good resolution modern temperature data unto low resolution proxy data trendline is scientific malpractice, that only ignorant warmists would wet their pants over. It is unthinkable for an honest scientist to do this.

Fifth, all those so called replications are being done by his inner circle of friends using the same group of data Dr. Mann used. There is no true independent confirmation.
 
This is what it should (approximately) look like, properly pointed at 250 year resolution.

View attachment 190193

Edits in yellow highlight are mine
No, that's what it looks like when you simply photoshop the real graph!
Well... Ignorance is what I expected....

So you do not understand why this is a fabrication and deceptive... Thanks for proving your a shill who doesn't know the first thing about the issue.
 

Forum List

Back
Top