Billy_Bob
Diamond Member
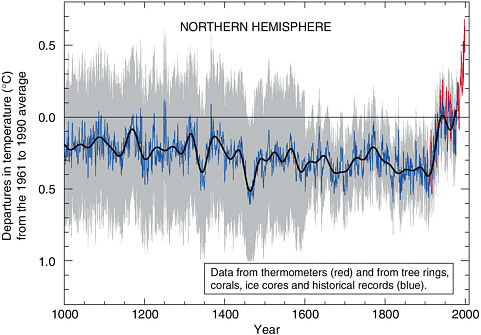
^^^^^ this what ignorant and stupidity look like when mixed in an alarmist. They don't know even the basics of the problem but will gladly spout deception as fact.Never underestimate the stupidity of the deniers. That is their specialty. The fact that they are still arguing the Mann graph after it has been verified multiple times demonstrates their basic dishonesty and idiocy.
Give it a rest... it's way over your head.. And we get that... Context is something no alarmist grasps..
Last edited:

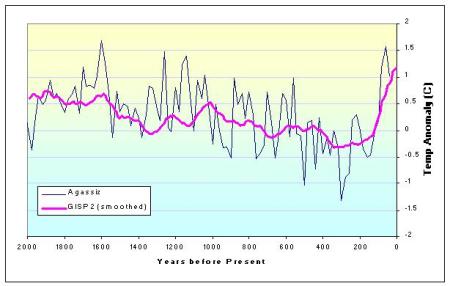
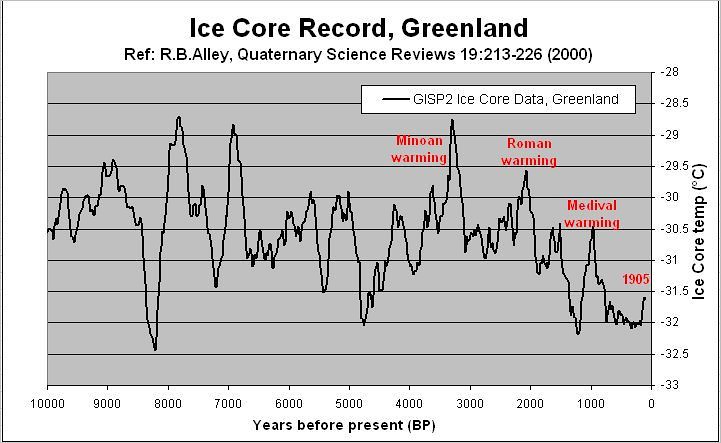 GISP2 Greenland Ice Core Data, RBAlley (2000)