For Crick- New Pages2k Data Paper

We know that's the canonical dogma of the CultOfMcIntyre. However, the CultOfMcIntyre has a long history of just making shit up, which is why nobody outside the cult pays any attention to them.


the authors of the Gergis et al obviously disagree with you -

"
Karoly’s first technical response (June 7 Melbourne) to Neukom’s confession was a surprisingly strong endorsement of criticism of non-detrended correlation, going as far as to even agree with me by name:

Thanks for the info on the correlations for the SR reconstructions during the 1911-90 period for detrended and full data. I think that it is much better to use the detrended data for the selection of proxies, as you can then say that you have identified the proxies that are responding to the temperature variations on interannual time scales, ie temp-sensitive proxies, without any influence from the trend over the 20th century. This is very important to be able to rebut the criticism is that you only selected proxies that show a large increase over the 20th century ie a hockey stick .

The same argument applies for the Australasian proxy selection. If the selection is done on the proxies without detrending ie the full proxy records over the 20th century, then records with strong trends will be selected and that will effectively force a hockey stick result. Then Stephen Mcintyre criticism is valid.I think that it is really important to use detrended proxy data for the selection, and then choose proxies that exceed a threshold for correlations over the calibration period for either interannual variability or decadal variability for detrended data. I would be happy for the proxy selection to be based on decadal correlations, rather than interannual correlations, but it needs to be with detrended data, in my opinion. The criticism that the selection process forces a hockey stick result will be valid if the trend is not excluded in the proxy selection step.

Neukom replied immediately (8:55 June 7 Melbourne) that he agreed, but warned that peril lay that way, since they had very few proxies that met even such a minimal standard:

I agree, but we don’t have enough strong proxy data with significant correlations after detrending to get a reasonable reconstruction….
"

the last sentence sums up this area of climate science
 
more on Gergis12, the precursor to the australasian portion of PAGES2K.

Data Torture in Gergis2K Climate Audit

"
Gergis et al 2012

As is well-known to CA readers, Gergis et al did ex post screening of their network by correlation against their target Australasian region summer temperature. Screening reduced the network from 62 series to 27. For a long time, climate blogs have criticized ex post screening as a bias-inducing procedure -a bias that is obvious, but which has been neglected in academic literature. For the most part, the issue has been either ignored or denied by specialists.

Gergis et al 2012, very unusually for the field, stated that they intended to avoid screening bias by screening on detrended data, describing their screening process as follows:

For predictor selection, both proxy climate and instrumental data were linearly detrended over the 1921-1990 period to avoid inflating the correlation coefficient due to the presence of the global warming signal present in the observed temperature record. Only records that were significantly (p<0.05) correlated with the detrended instrumental target over the 1921-1990 period were selected for analysis. This process identified 27 temperature-sensitive predictors for the SONDJF warm season.

Unfortunately for Gergis and coauthors, that’s not what they actually did. Their screening was done on undetrended data. When screening was done in the described way, only 8 or so proxies survived. Jean S discovered this a few weeks after publication of the Gergis et al article on May 17, 2012. Two hours after Jean S’ comment at CA, coauthor Neukom notified Gergis and Karoly of the problem.

Gergis and coauthors, encouraged by Gavin Schmidt and Michael Mann, attempted to persuade the Journal of Climate editors that they should be allowed to change the description of their methodology to what they had actually done. However, the editors did not agree, challenging the Gergis coauthors to show the robustness of their results. The article was not retracted. The University of Melbourne press statement continues to say that it was published on May 17, 2012, but has been submitted for re-review (and has apparently been under review for over two years now.)
"

even if you dont like McIntyre, I challenge anyone who reads the articles to not come away with a fuller understanding of how paloereconstructions are carried out.
 
hahahaha. Kaufman just revised yet another proxy that was used upside-down in PAGES2K Arctic.

it is funny how these guys 'find' the errors all by themselves after Steve McIntyre points it out on Climate audit. Scientists are actually supposed to acknowledge the party that discovers a mistake. climate scientists seem to ignore this common practise, at least when it comes to McIntyre. I think it makes them gag. hahahahaha
 
Humans aren't supposed to make the assumptions about other humans that deniers consistently make about climate scientists. I think it indicates they're stupid and jealous. hahahahahah
 
Fer christ's sake Ian. Are you 12?

BTW, have any of these changes altered the conclusion to which the data lead?
 
John Cook


John is the Climate Communication Fellow for the Global Change Institute at the University of Queensland. He originally obtained a Bachelor of Science at the University of Queensland, achieving First Class Honours with a major in physics. He co-authored the 2011 bookClimate Change Denial: Heads in the Sand with Haydn Washington, and the 2013 college textbook Climate Change Science: A Modern Synthesis with Tom Farmer. He also lead-authored the paper Quantifying the Consensus on anthropogenic global warming in the scientific literature, which was tweeted by President Obama and was awarded the best paper published in Environmental Research Letters in 2013.

Global Warming and Climate Change skepticism examined

Whereas YOU, Ian, you.... did what? You post your puerile comments on this website. VERY impressive.
[/QUOTE]
 
Last edited:
From Nature, Geoscience;

Continental-scale temperature variability during the past two millennia – Ahmed et al. (2013) “Past global climate changes had strong regional expression. To elucidate their spatio-temporal pattern, we reconstructed past temperatures for seven continental-scale regions during the past one to two millennia. The most coherent feature in nearly all of the regional temperature reconstructions is a long-term cooling trend, which ended late in the nineteenth century. At multi-decadal to centennial scales, temperature variability shows distinctly different regional patterns, with more similarity within each hemisphere than between them. There were no globally synchronous multi-decadal warm or cold intervals that define a worldwide Medieval Warm Period or Little Ice Age, but all reconstructions show generally cold conditions between ad 1580 and 1880, punctuated in some regions by warm decades during the eighteenth century. The transition to these colder conditions occurred earlier in the Arctic, Europe and Asia than in North America or the Southern Hemisphere regions. Recent warming reversed the long-term cooling; during the period ad 1971–2000, the area-weighted average reconstructed temperature was higher than any other time in nearly 1,400 years.”Moinuddin Ahmed, Kevin J. Anchukaitis, Asfawossen Asrat, Hemant P. Borgaonkar, Martina Braida, Brendan M. Buckley, Ulf Büntgen, Brian M. Chase, Duncan A. Christie, Edward R. Cook, Mark A. J. Curran, Henry F. Diaz, Jan Esper, Ze-Xin Fan, Narayan P. Gaire, Quansheng Ge, Joëlle Gergis, J Fidel González-Rouco, Hugues Goosse, Stefan W. Grab, Nicholas Graham, Rochelle Graham, Martin Grosjean, Sami T. Hanhijärvi, Darrell S. Kaufman + et al. Nature Geoscience(2013), doi:10.1038/ngeo1797.


Kaufman's original paper. this thread is about the corrections made to this paper, and the mistakes left unfixed. try to get up to speed Old Rocks.

even the uncorrected paper had many of the areas around the globe with a warmer MWP than at present

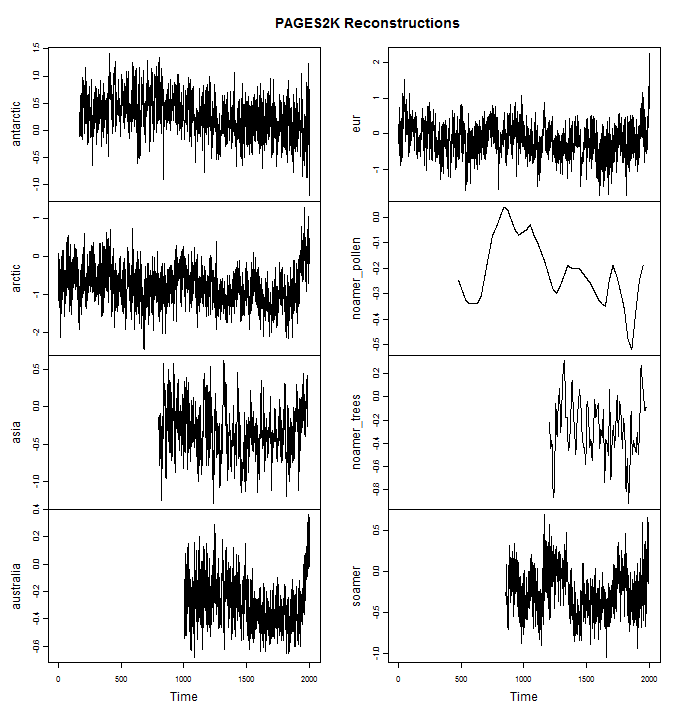
pages-reconstructions.png


Antarctica: This is a composite of 11 isotope series (mostly d18O). It includes some new data (e.g. Steig’s new WAIS series) and some long unavailable data (Ellen Mosley-Thompson’s Plateau Remote). It shows a long-term decline with nothing exceptional in the 20th century. Steig has recently characterized the recent portion of Antarctic isotope as “unusual”, but this is really stretching the facts to the point of disinformation. I’ll post separately on this.

Arctic: This is a somewhat expanded version of the Kaufman data, unsurprising since Kaufman seems to have been the leader of the program. It shows an increase from 1800 to 1950, with leveling off since 1950. Its modern values are higher than medieval values. It is heavy on varvology (22 varve series), but, like Kaufman et al, also has ice cores (16) and tree rings (13, including Briffa’s Yamal) plus a few others. They use Korttajarvi, but Kaufman has issued one correction on this already in 2009 and avoided use of the contaminated portion. We’ve discussed Arctic d18O values from time to time, observing that their 20th century values are rather unexceptional. My surmise is that the varve data, which, as discussed in other CA threads, is highly problematic, is the main contributor to the modern-medieval differential in the PAGES reconstruction.

Asia: This reconstruction is based entirely on tree rings (229 series), all, interestingly, used in a positive orientation. 20th century values are elevated but the reconstruction lacks the distinctive blade of, for example, the Gergis stick. The majority of the tree ring data is unarchived: chronologies have been included in the PAGES2K data, but the underlying measurement remains unarchived.

Australia: this is the Gergis reconstruction. There are only two long series (both tree ring). As is well known, Gergis picked data according to ex post correlation to temperature (contrary to the representation in the disappeared article). The present network is little changed from the network in the disappeared article, with the precise differences remaining to be explained. The network is about half tree ring data and about half is short coral (nearly all O18) data. The blade in the Gergis stick comes almost entirely from coral O18 data – for which corresponding medieval information is lacking. The reconstruction is thus a sort-of splice of low-amplitude tree ring data with high amplitude coral O18. Coral specialist literature nearly always uses Sr data as a measure of temperature. The 20th century increase in coral Sr data is much less than O18 data: however, Gergis screened out the Sr data and almost exclusively used coral O18 data.

Europe: The network is 10 tree ring series and one documentary. I don’t know at present how the series were chosen. Most of the increase in the reconstruction took place prior to 1950. Late 20th century values equal and then exceed mid-century values. It will be interesting to see whether sustained ring widths will be maintained with these particular chronologies during warmer temperatures.

North America.
There are two North American reconstructions. A reconstruction using pollen is at 30 year intervals and ends in 1950. It shows elevated temperatures in the late first millennium that exceed the most recent values in the series. The other reconstruction uses tree rings. It includes many series from the MBH98 dataset, including the Graybill bristlecone chronologies. Although the tree ring data is accurately dated, the reconstruction is only reported at 10-year intervals. Although the data set includes new data reaching into the present century, the reconstruction is shown only to 1974.

South America: This network is particularly hard to understand. It shows particularly low medieval values relative to the modern period – a point that is relevant to assertions on medieval-modern differential. The network also uses intrumental data. It has two long ice core series from Quelccaya, which, as previously noted, appear (according to the SI) to have been inverted, a decision which, if correct, would rather detract from conclusions about modern-medieval differential drawn from this reconstruction, given that the medieval portion of the reconstruction only has a few contributors, of which Quelccaya is prominent.


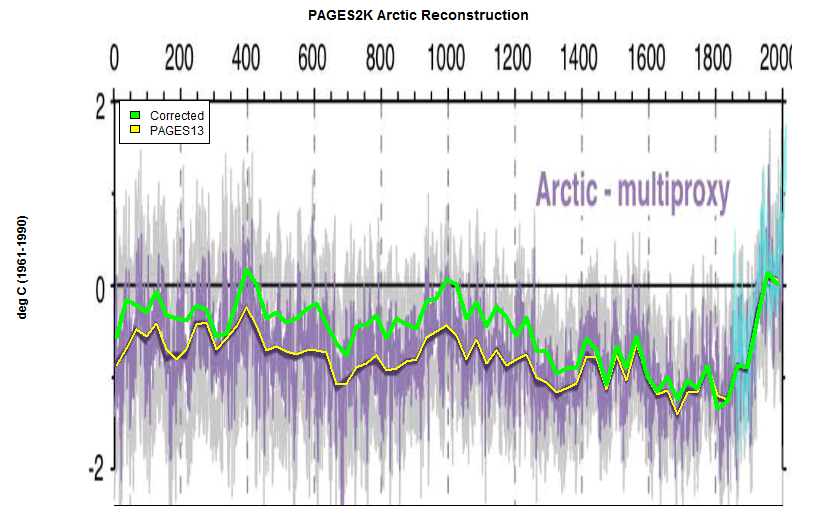
after prodding to the authors and the Journal from McIntyre, the digital corrected version of the Arctic reconstruction was released (but no one had the courtesy of notifying McIntyre, as per usual). here is the comparison between the first and corrected versions (although there are other mistakes still to be fixed)-

arctic_si_annotated.png


this shows both the 5th and 11th centuries as having higher average temps, although I would only call them roughly equivalent. one more kick to the nutsack of the MWP and LIA deniers.

ever notice that when mistakes are corrected, or updated proxies are included, that the results always show less of a hockeystick and more of a MWP? if the other upsidedown proxy is fixed and the much larger and inclusive new dendro proxy was used instead of the problematic Gaspe then there would be another 0.25-0.5C added to the MWP.

"ever notice that when mistakes are corrected, or updated proxies are included, that the results always show less of a hockeystick and more of a MWP? if the other upsidedown proxy is fixed and the much larger and inclusive new dendro proxy was used instead of the problematic Gaspe then there would be another 0.25-0.5C added to the MWP".

why do you dislike proper scientific methods Crick? why are you OK with leaving in obvious mistakes? you think I am childish for laughing at this sorry state of affairs but I would rather be amused at Kaufman clenching his teeth and fixing yet another mistake (with no mention of McIntyre, who pointed it out) than get pissed off at how slowly important papers get fixed, if they ever get fixed at all.

Do you think Mikey should mann-up and fix his upsidedown Tiljander cores?

I dont actually expect you to respond to any of my questions. you dont have the honesty or the integrity.


edit- because many might not actually read the box quote I will repost the graph in it.

arctic_si_annotated.png


this is a large change due to an upsidedown proxy. does it change the conclusion? of course it changes the conclusion. why have data if it doesnt affect the conclusion. the latest change wont be accompanied by a new graph from the authors as it is just listed as a 'correction'.
 
Last edited:
John Cook


John is the Climate Communication Fellow for the Global Change Institute at the University of Queensland. He originally obtained a Bachelor of Science at the University of Queensland, achieving First Class Honours with a major in physics. He co-authored the 2011 bookClimate Change Denial: Heads in the Sand with Haydn Washington, and the 2013 college textbook Climate Change Science: A Modern Synthesis with Tom Farmer. He also lead-authored the paper Quantifying the Consensus on anthropogenic global warming in the scientific literature, which was tweeted by President Obama and was awarded the best paper published in Environmental Research Letters in 2013.

Global Warming and Climate Change skepticism examined

Whereas YOU, Ian, you.... did what? You post your puerile comments on this website. VERY impressive.
[/QUOTE]


hahahahahahaha

2014-02-25-dc3a7593.png


guys like Gleik have to make shit up. all I have to do is simply paste up what Cook says about himself!!!!

hahahahahahahaha
 
Humans aren't supposed to make the assumptions about other humans that deniers consistently make about climate scientists. I think it indicates they're stupid and jealous. hahahahahah
why do you hate science so much? You say you are full into the science, and then you behave 180 degrees opposite from what the field is about. how is that?
 
Last edited:
Bump for our newest AGW apologist, threegoofs.

I haven't reread the thread. Another upsidedown proxy was corrected last fall but I don't think a new graph was produced.
 
Bump for our newest AGW apologist, threegoofs.

I haven't reread the thread. Another upsidedown proxy was corrected last fall but I don't think a new graph was produced.

Whats the point here? Paper was published. Conclusions overwhelmingly support older analysis, like MBH98, Marcott, and a score of others.

Looks like the criticism comes from blogs. And blogs written by former mining executives that were 'mostly on the equity side of the business'. Dont see any significant challenges to the paper brought in the scientific literature in the years following.

It confirms, in a pretty definitive fashon, what we already know. The earth has had a relatively stable climate that has been cooler than what we have seen over the last 50 years or so. And to extrapolate even more, the projections for what temperature will be over the next couple hundred years far exceed anything we have seen in the holocene.

Thats a pretty significant conclusion. And all the blog whining wont change it.
 
After rereading this thread I can guarantee that it holds a trove of information on paleoreconstructions. PAGES2K, Gergis2012 (with correspondence between the Journal and authors), with comments and links to many proxy 'problems'.
 
from the latest CA article on PAGES2K-
"
Discussion

Because of the heavy weighting of Kaufman et al 2009 proxies, the McKay and Kaufman conclusion that the “decadal-scale variability in the revised [PAGES2K] reconstruction is quite similar to that determined by Kaufman et al.” is, as advertised above, more of a tautology rather evidence of robustness of the result in the additional data.

At the end of the day, any proxy reconstruction is either a linear combination of the underlying proxies (or can be closely approximated by such a linear combination.) Over the years, I’ve consistently urged that the effective weights be shown for novel methods. Had this been done, I doubt that the above weights would have been the result, since it’s hard to believe that the Arctic2K authors intentionally adopted the above weights. Jean S has done some experiments and there are definitely alternative weighting schemes that can result from slightly varied implementations of paico.

As CA readers are aware, I remain dubious that material benefits arise from putting relatively simple datasets into increasingly complicated and poorly understood multivariate methods and remain of the opinion that there are better opportunities for improving analysis by first comparing like proxies across regions and comparisons of unlike proxies within a region, prior to venturing into the assimilation of unlike proxies in different regions. But this recommendation has been mostly rejected by specialists in the field, who remain committed to dumping data into black boxes, but who get huffy when resulting defects are criticized.

Finally nearly all the difference between the PAGES2K-2013 and the revised result arises from a single proxy (Hvitarvatn, used upside down in the earlier version.) Some readers have expressed surprise at the idea that specialists could use proxies upside down, observing that their interpretation as temperature proxies must be very tenuous if even specialists didn’t know which way was up. Particularly in a multi-author Nature article, subsequently relied upon by IPCC. I agree with this and have written numerous articles critical of varvology, proxies that have become widely used in post-AR4 multiproxy studies. I think that there may well be usable information in this data, but as long as thick varves are interpreted by some specialists as evidence of cold and by other specialists as evidence of warmth, the first order of business for assessment is to reconcile varve thickness data before dumping the data into a multiproxy composite, rather than after.
" The Kaufman Tautology Climate Audit


yet crick and his ilk believe fully, believe deeply, that reconstructions are not only correct but precise.


This is an important idea. Leaders in the field of climate science cannot even standardize the orientation of many of the proxies! Yet they pour a bunch into black box blender of a methodology and spit out a graph with error bars of tenths of a degree. Just how useful are proxies that can be used right side up or upsidedown, depending on the particular need at the time?
 
After rereading this thread I can guarantee that it holds a trove of information on paleoreconstructions. PAGES2K, Gergis2012 (with correspondence between the Journal and authors), with comments and links to many proxy 'problems'.

Yeah, I bet.

(Warning -ANALOGY ALERT!)

Lots of amateur speculations on the spot on the MRI complaining about how all the radiologists are misdiagnosis get the cancer.
 
from the latest CA article on PAGES2K-
"
Discussion

Because of the heavy weighting of Kaufman et al 2009 proxies, the McKay and Kaufman conclusion that the “decadal-scale variability in the revised [PAGES2K] reconstruction is quite similar to that determined by Kaufman et al.” is, as advertised above, more of a tautology rather evidence of robustness of the result in the additional data.

At the end of the day, any proxy reconstruction is either a linear combination of the underlying proxies (or can be closely approximated by such a linear combination.) Over the years, I’ve consistently urged that the effective weights be shown for novel methods. Had this been done, I doubt that the above weights would have been the result, since it’s hard to believe that the Arctic2K authors intentionally adopted the above weights. Jean S has done some experiments and there are definitely alternative weighting schemes that can result from slightly varied implementations of paico.

As CA readers are aware, I remain dubious that material benefits arise from putting relatively simple datasets into increasingly complicated and poorly understood multivariate methods and remain of the opinion that there are better opportunities for improving analysis by first comparing like proxies across regions and comparisons of unlike proxies within a region, prior to venturing into the assimilation of unlike proxies in different regions. But this recommendation has been mostly rejected by specialists in the field, who remain committed to dumping data into black boxes, but who get huffy when resulting defects are criticized.

Finally nearly all the difference between the PAGES2K-2013 and the revised result arises from a single proxy (Hvitarvatn, used upside down in the earlier version.) Some readers have expressed surprise at the idea that specialists could use proxies upside down, observing that their interpretation as temperature proxies must be very tenuous if even specialists didn’t know which way was up. Particularly in a multi-author Nature article, subsequently relied upon by IPCC. I agree with this and have written numerous articles critical of varvology, proxies that have become widely used in post-AR4 multiproxy studies. I think that there may well be usable information in this data, but as long as thick varves are interpreted by some specialists as evidence of cold and by other specialists as evidence of warmth, the first order of business for assessment is to reconcile varve thickness data before dumping the data into a multiproxy composite, rather than after.
" The Kaufman Tautology Climate Audit


yet crick and his ilk believe fully, believe deeply, that reconstructions are not only correct but precise.


This is an important idea. Leaders in the field of climate science cannot even standardize the orientation of many of the proxies! Yet they pour a bunch into black box blender of a methodology and spit out a graph with error bars of tenths of a degree. Just how useful are proxies that can be used right side up or upsidedown, depending on the particular need at the time?

Then show us some reconstructions that do not make such mistakes that - we would have to assume - do not support AGW or the IPCC and, instead, support your position, whatever the hell that might be.

I grow tired of denier nit picking that seems to go on forever without a SINGLE case in which alternative work without those nitpicking errors can be provided and which support different conclusions.
 
Don't waste your time Ian. threeturds is a troll and will never be anything but a troll. I have shown him plenty of links that refute his propaganda and he ignores everything.

in other words he's a paid propagandist who is here to talk AT people. Not with people.
 
Don't waste your time Ian. threeturds is a troll and will never be anything but a troll. I have shown him plenty of links that refute his propaganda and he ignores everything.

in other words he's a paid propagandist who is here to talk AT people. Not with people.
Again, thanks for noting my professional demeanor and skills. Glad it comes across so well.

The 'plenty of links' are vomitus from denier blogs. Not science. It's like someone showing me creationist links and telling me it disproves human evolution.
 

Forum List

Back
Top