The religion of the left: Climate Change

Because of it's atmosphere. Mars has a thin atmosphere composed of about 95 percent carbon dioxide, with the remainder being mostly diatomic nitrogen. Traces of water vapour also occur. Mars has a mean surface air temperature estimated at 210 K (−63 °C, or −82 °F), and surface pressures hover near 6 millibars.

What'd you say is surface air pressure is on Mars? 6mB? What is the air pressure on the Earth? 1,013.2 at sea level. Atmospheric density on Mars is one-sixtieth of Earth's. The Earth is 149.6 million kilometers from the sun. Mars is 228 million kilometers from the sun. Remember your distance squared law. Mars receives 44% of the Earth's insolation. You think that any of those points might have something to do with the temperature differential or are you going to stick with the idea that you've somehow shown CO2 is not a greenhouse gas?

This is the sort of thing that causes you to fail as any sort of science-knowledgeable poster.
 
Last edited:
What'd you say is surface air pressure is on Mars? 6mB? What is the air pressure on the Earth? 1,013.2 at sea level. Atmospheric density on Mars is one-sixtieth of Earth's. The Earth is 149.6 million kilometers from the sun. Mars is 228 million kilometers from the sun. Remember your distance squared law. Mars receives 44% of the Earth's insolation. You think that any of those points might have something to do with the temperature differential or are you going to stick with the idea that you've somehow shown CO2 is not a greenhouse gas?

This is the sort of thing that causes you to fail as any sort of science-knowledgeable poster.
So you what you are really proving is that basing conclusions soley on CO2 concentrations is a fallacy and it is. That's why the majority of the last 10,000 years on earth was warmer than the present with less CO2, why previous interglacials were warmer than present with less CO2 and why the planet cooled with significantly higher levels of CO2.

I'm 50 steps ahead of you at all times.
 
This is the sort of thing that causes you to fail as any sort of science-knowledgeable poster.
1676391423879.png
 
So you what you are really proving is that basing conclusions soley on CO2 concentrations is a fallacy and it is. That's why the majority of the last 10,000 years on earth was warmer than the present with less CO2, why previous interglacials were warmer than present with less CO2 and why the planet cooled with significantly higher levels of CO2.

I'm 50 steps ahead of you at all times.
HAHAHAHAAAAhaaahaaa...

Remember the IPCC's radiative forcing factors diagram? Was CO2 the only thing on there?
 
HAHAHAHAAAAhaaahaaa...

Remember the IPCC's radiative forcing factors diagram? Was CO2 the only thing on there?
I've asked you several times to use that diagram to explain why the previous interglacial was 2C warmer with 120 ppm less CO2 or how the planet cooled for millions of years with CO2 greater than 600ppm The fact that you can't means it might as well be the only thing there. Because the purpose of numbers in that diagram is to prove CO2 is the only thing that can cause warming to occur.

But do feel free to tell me which radiative forcing numbers on that diagram were responsible for the planet being warmer for the majority of the last 10,000 years than recent decades. I'm all ears.
I knew it was a mistake to have ever resumed talking to you. Go bother someone else with your obsessions. Todd seems to enjoy you though I don't think he deserves you.
 
I knew it was a mistake to have ever resumed talking to you. Go bother someone else with your obsessions. Todd seems to enjoy you though I don't think he deserves you.
Growth filled communities should explore all sides of an issue to arrive at objective truth. That's all I'm doing.
 
I knew it was a mistake to have ever resumed talking to you. Go bother someone else with your obsessions. Todd seems to enjoy you though I don't think he deserves you.
The reality is there is nothing on that diagram that can explain why it was warmer for the majority of the last 10,000 years with less CO2 or why the last interglacial was warmer with less CO2 or why the planet cooled for millions of years with CO2 greater than 600 ppm.

That's why you are upset. It's not my fault you believe a lie. I'm just exposing the lie using empirical climate data. Something you don't have and can't explain. So cry me a river.
 
Very
1200px-20200324_Global_average_temperature_-_NASA-GISS_HadCrut_NOAA_Japan_BerkeleyE.svg.png


Graphs showing correlation of measured global average temperature, from five different scientific organizations. Graphs of datasets from five scientific organizations were vertically adjusted, if needed, to a common reference/base period 1951-1980: 1. NASA GISS NAVIGATION PAGE: https://data.giss.nasa.gov/gistemp/graphs_v4/ NASA GISS SOURCE: https://data.giss.nasa.gov/gistemp/...imates_based_on_Land_and_Ocean_Data/graph.txt Data: 1880- Base: 1951-1980 2. : SOURCE: HadCRUT.5.0.1.0: Met Office Hadley Centre observations datasets Choose "HadCRUT.5.0.1.0 analysis", "Summary Series", "Global (NH+SH)/2", "Annual". (Link invokes download window; earlier years pointed to text file) Data: 1850- Base: 1961-1990 3. NCDC NOAA SOURCE: https://www.ncdc.noaa.gov/cag/global/time-series/globe/land_ocean/12/12/1880-2022/data.csv (manually change year in URL 2021-->2022-->2023 etc.) Data: 1880- Base: 1901-2000 4. JAPAN METEOROLOGICAL OFFICE DESCRIPTION PAGE: Global Average Surface Temperature Anomalies / TCC SOURCE: https://ds.data.jma.go.jp/tcc/tcc/products/gwp/temp/list/csv/year_wld.csv Data: 1891- Base=1991-2020 (changed from 1981-2010) 5. BERKELEY EARTH SOURCE: http://berkeleyearth.lbl.gov/auto/Global/Land_and_Ocean_summary.txt Data: 1850- Base: 1951-1980
Try applying more than a cherry picked @150 years of "data". Maybe several hundred millions worth or so ...

Global-Temperature-and-CO2-levels-over-600-million-years-Source-MacRae-2008.ppm
 
Try applying more than a cherry picked @150 years of "data". Maybe several hundred millions worth or so ...

Global-Temperature-and-CO2-levels-over-600-million-years-Source-MacRae-2008.ppm
Can you point out to me on your graphic where the human use of fossil fuels caused a 50% increase in atmspheric CO2 levels? I'm looking at this on a 27" monitor and that last 100 million years of your graph occupies about 1". So, the span since the beginning of the Industrial Revolution would cover 173/100,000,000 or 0.00000173 inches or roughly 2 ten-thousandths of a single pixel. So, what do you think this graph will tell us about the last 170 years?
 
Can you point out to me on your graphic where the human use of fossil fuels caused a 50% increase in atmspheric CO2 levels? I'm looking at this on a 27" monitor and that last 100 million years of your graph occupies about 1". So, the span since the beginning of the Industrial Revolution would cover 173/100,000,000 or 0.00000173 inches or roughly 2 ten-thousandths of a single pixel. So, what do you think this graph will tell us about the last 170 years?
It's fairly straightforward and clear.

For past 600 million years there is no clear linkage between CO2 levels and average global temps, at least as far as CO2 being a cause of such going up or down. If anything, global temps have a major effect upon CO2 levels.

It shows that for about half of this time, global temps have been rather stable at about 22 degree C., and when it has plunged below that, likely reflecting ice ages, CO2 has lagged in decline, likely showing the drop of flora and fauna that occurs with ice ages. However, CO2 has remained above our current level during those periods of flux.

Note the scale on the left goes as high as 8000 ppm for CO2 and max in Earth's past on this timeline looks to have been about 7000ppm, yet life continued to exist, Earth didn't "burn up".
CO2 levels began to take a sharp drop about 150 million years ago, from a peak of around 2000+ ppm to about 300ppm just about 170 years ago. Global temperatures remained stable and at about 22 C until about 30 million years ago when they begin to drop dramatically and that graph line goes below the recent CO2 one.

Your 50% increase of @past 170 years, from about 280 to 410 ppm, barely brings the CO2 bar up to shy of halfway towards that 1000 ppm line. The scale we are looking at covers a cycle of ice ages/glaciations and non-glaciations;
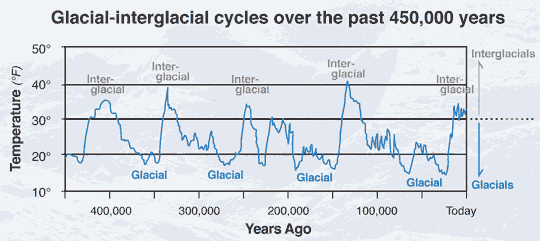
This chart should help provide perspective of more recent times;
ice_ages2.gif


Both charts are readily understandable to anyone with a high school education whom also passed the basic science courses.
Perhaps you didn't pass such and therein lies your challenge in understanding the science and math involved on this topic.
 
It's fairly straightforward and clear.

For past 600 million years there is no clear linkage between CO2 levels and average global temps, at least as far as CO2 being a cause of such going up or down. If anything, global temps have a major effect upon CO2 levels.
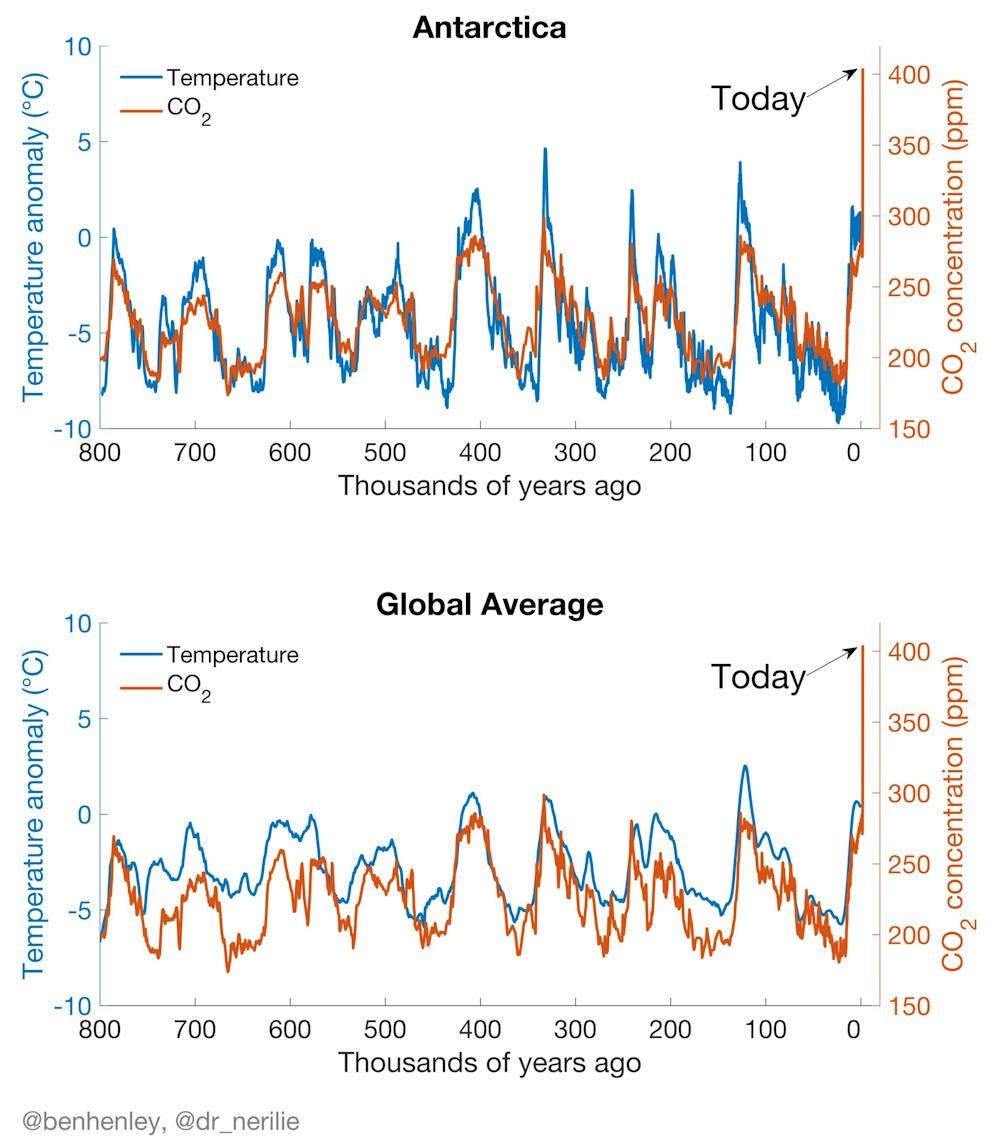
As I'm certain you've heard before it works both ways. If you increase temperatures, CO2 solubility in the oceans is reduced and increases its levels in the atmosphere. AND, if you increase CO2's levels in the atmosphere, it warms the planet by trapping infrared heat, as it is doing now. The reason you see so little correlation at the scales you're looking at is the glacial pace at which change is taking place. Surely you've seen this graphic or ones like it which show a very strong correlation between temperature and CO2:
file-20170606-3681-1kf3xwv.jpg


It shows that for about half of this time, global temps have been rather stable at about 22 degree C., and when it has plunged below that, likely reflecting ice ages, CO2 has lagged in decline, likely showing the drop of flora and fauna that occurs with ice ages. However, CO2 has remained above our current level during those periods of flux.
Let's have a good look at your graphic.
Global-Temperature-and-CO2-levels-over-600-million-years-Source-MacRae-2008.ppm

Notice what CO2 does when temperature's drop in the late Ordovician. It drops. And through the late Devonian, the entire carboniferous and the majority of the Permian, chilling temperatures lead a very large drop in CO2. Finally, in the last Jurassic and early Cretaceous, we again see a correlation between dropping temperatures and dropping CO2 levels. So there is a significant correlation even at this scale and with processes as slow as are these.
Note the scale on the left goes as high as 8000 ppm for CO2 and max in Earth's past on this timeline looks to have been about 7000ppm, yet life continued to exist, Earth didn't "burn up".
As I hope you have heard on many occasions, the problem is not the absolute CO2 level or the absolute temperature but the RATE at which either changes. When it take 50 million years for temperatures to change 5C, no one is going to notice. When it takes one 250,000th that much time to make the same change, life will not have a chance to adapt and will suffer. That is the case today.
CO2 levels began to take a sharp drop about 150 million years ago, from a peak of around 2000+ ppm to about 300ppm just about 170 years ago. Global temperatures remained stable and at about 22 C until about 30 million years ago when they begin to drop dramatically and that graph line goes below the recent CO2 one.
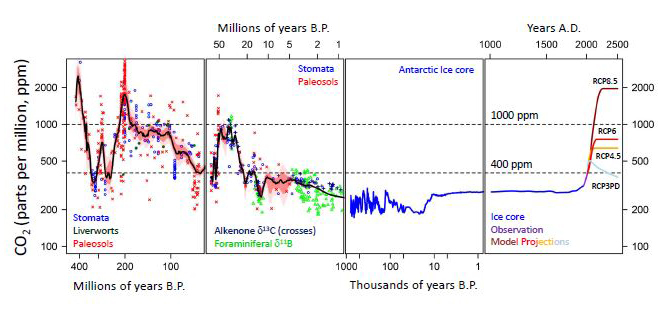
Homo Sapiens first appeared on this planet approximately 200,000 years ago. For more than a million years - five times further back than that - CO2 levels have never gotten above 300 ppm. They are now at 420, a level not seen for the last 20 million years according to these data.

See the graphic above for the first 800,000 years. See below for the remainder.
Co2-levels-historic.jpg

Your 50% increase of @past 170 years, from about 280 to 410 ppm, barely brings the CO2 bar up to shy of halfway towards that 1000 ppm line. The scale we are looking at covers a cycle of ice ages/glaciations and non-glaciations;
This chart should help provide perspective of more recent times;
ice_ages2.gif
Odd that though you were talking about CO2 concentrations you provided a graph which showed none. I prefer mine, that show a strong correlation between temperature and CO2 and clearly illustrate that CO2 has been stable at 250-300 ppm for well over the last million years, long before modern humans ever appeared.
Both charts are readily understandable to anyone with a high school education whom also passed the basic science courses.
Perhaps you didn't pass such and therein lies your challenge in understanding the science and math involved on this topic.
I have a BSc in Ocean Engineering and spent a lot of my professional life producing and publishing data graphics. I think I can keep up. YOU might explain why you chose that final graph when it doesn't show the parameter you were just talking about. I'm pretty certain I know, but maybe you ought to develop the testicles to admit it to the rest of us. You know... like a man.
 
Last edited:
if you increase CO2's levels in the atmosphere, it warms the planet by trapping infrared heat, as it is doing now.
Yes, but by a third of the value your high priests claim. So there's no problem. In fact it's better for the planet and humanity.
 
Odd that though you were talking about CO2 concentrations you provided a graph which showed none. I prefer mine, that show a strong correlation between temperature and CO2 and clearly illustrate that CO2 has been stable at 250-300 ppm for well over the last million years, long before modern humans ever appeared.
Then you should really enjoy these.

1673744930146.png


glacial mininum and interglacial maximum.jpg
 
As I'm certain you've heard before it works both ways. If you increase temperatures, CO2 solubility in the oceans is reduced and increases its levels in the atmosphere. AND, if you increase CO2's levels in the atmosphere, it warms the planet by trapping infrared heat, as it is doing now. The reason you see so little correlation at the scales you're looking at is the glacial pace at which change is taking place. Surely you've seen this graphic or ones like it which show a very strong correlation between temperature and CO2:
file-20170606-3681-1kf3xwv.jpg


Let's have a good look at your graphic.
Global-Temperature-and-CO2-levels-over-600-million-years-Source-MacRae-2008.ppm

Notice what CO2 does when temperature's drop in the late Ordovician. It drops. And through the late Devonian, the entire carboniferous and the majority of the Permian, chilling temperatures lead a very large drop in CO2. Finally, in the last Jurassic and early Cretaceous, we again see a correlation between dropping temperatures and dropping CO2 levels. So there is a significant correlation even at this scale and with processes as slow as are these.

As I hope you have heard on many occasions, the problem is not the absolute CO2 level or the absolute temperature but the RATE at which either changes. When it take 50 million years for temperatures to change 5C, no one is going to notice. When it takes one 250,000th that much time to make the same change, life will not have a chance to adapt and will suffer. That is the case today.

Homo Sapiens first appeared on this planet approximately 200,000 years ago. For more than a million years - five times further back than that - CO2 levels have never gotten above 300 ppm. They are now at 420, a level not seen for the last 20 million years according to these data.

See the graphic above for the first 800,000 years. See below for the remainder.
Co2-levels-historic.jpg


Odd that though you were talking about CO2 concentrations you provided a graph which showed none. I prefer mine, that show a strong correlation between temperature and CO2 and clearly illustrate that CO2 has been stable at 250-300 ppm for well over the last million years, long before modern humans ever appeared.

I have a BSc in Ocean Engineering and spent a lot of my professional life producing and publishing data graphics. I think I can keep up. YOU might explain why you chose that final graph when it doesn't show the parameter you were just talking about. I'm pretty certain I know, but maybe you ought to develop the testicles to admit it to the rest of us. You know... like a man.
Look at all of those "saw tooth" like warming and cooling trends. How is it that you can ignore and eliminate natural variability as a cause for the recent warming trend?
 
Faith. In order to be accepted into the religion of Global Warming you have to ignore what your brain and your senses that tell you when it's freaking cold and trust pagan priests like Al Gore who have no scientific background. Welcome to the middle ages.
 
Faith. In order to be accepted into the religion of Global Warming you have to ignore what your brain and your senses that tell you when it's freaking cold and trust pagan priests like Al Gore who have no scientific background. Welcome to the middle ages.
I've got a better idea. Put some trust in the people who DO have scientific backgrounds. They are all completely convinced that global warming is real, a real threat and a result of human fossil fuel combustion.

Go to AR6 Climate Change 2021: The Physical Science Basis — IPCC and do some reading.

 
I've got a better idea. Put some trust in the people who DO have scientific backgrounds...
I do.

Scientists come to opposite conclusions about the causes of recent climate change depending on which datasets they consider. For instance, the panels on the left lead to the conclusion that global temperature changes since the mid-19th century have been mostly due to human-caused emissions, especially carbon dioxide (CO2), i.e., the conclusion reached by the UN IPCC reports. In contrast, the panels on the right lead to the exact opposite conclusion, i.e., that the global temperature changes since the mid-19th century have been mostly due to natural cycles, chiefly long-term changes in the energy emitted by the Sun.


1632186412722.png


Both sets of panels are based on published scientific data, but each uses different datasets and assumptions. On the left, it is assumed that the available temperature records are unaffected by the urban heat island problem, and so all stations are used, whether urban or rural. On the right, only rural stations are used. Meanwhile, on the left, solar output is modeled using the low variability dataset that has been chosen for the IPCC’s upcoming (in 2021/2022) 6th Assessment Reports. This implies zero contribution from natural factors to the long-term warming. On the right, solar output is modeled using a high variability dataset used by the team in charge of NASA’s ACRIM sun-monitoring satellites. This implies that most, if not all, of the long-term temperature changes are due to natural factors.

Here is the link to the full paper.
ShieldSquare Captcha
 
As I'm certain you've heard before it works both ways. If you increase temperatures, CO2 solubility in the oceans is reduced and increases its levels in the atmosphere. AND, if you increase CO2's levels in the atmosphere, it warms the planet by trapping infrared heat, as it is doing now. The reason you see so little correlation at the scales you're looking at is the glacial pace at which change is taking place. Surely you've seen this graphic or ones like it which show a very strong correlation between temperature and CO2:
file-20170606-3681-1kf3xwv.jpg


Let's have a good look at your graphic.
Global-Temperature-and-CO2-levels-over-600-million-years-Source-MacRae-2008.ppm

Notice what CO2 does when temperature's drop in the late Ordovician. It drops. And through the late Devonian, the entire carboniferous and the majority of the Permian, chilling temperatures lead a very large drop in CO2. Finally, in the last Jurassic and early Cretaceous, we again see a correlation between dropping temperatures and dropping CO2 levels. So there is a significant correlation even at this scale and with processes as slow as are these.

As I hope you have heard on many occasions, the problem is not the absolute CO2 level or the absolute temperature but the RATE at which either changes. When it take 50 million years for temperatures to change 5C, no one is going to notice. When it takes one 250,000th that much time to make the same change, life will not have a chance to adapt and will suffer. That is the case today.

Homo Sapiens first appeared on this planet approximately 200,000 years ago. For more than a million years - five times further back than that - CO2 levels have never gotten above 300 ppm. They are now at 420, a level not seen for the last 20 million years according to these data.

See the graphic above for the first 800,000 years. See below for the remainder.
Co2-levels-historic.jpg


Odd that though you were talking about CO2 concentrations you provided a graph which showed none. I prefer mine, that show a strong correlation between temperature and CO2 and clearly illustrate that CO2 has been stable at 250-300 ppm for well over the last million years, long before modern humans ever appeared.

I have a BSc in Ocean Engineering and spent a lot of my professional life producing and publishing data graphics. I think I can keep up. YOU might explain why you chose that final graph when it doesn't show the parameter you were just talking about. I'm pretty certain I know, but maybe you ought to develop the testicles to admit it to the rest of us. You know... like a man.
Your first two charts show a veery loose connection and one that trends with global temps affecting the CO2 level, not the opposite which is the base claim of ACC/AGW. Also, you are focused on the past million years or so while the first chart I presented showed for 800+ million years and that showed both temps and CO2 far higher than what we have, or have seen in past two centuries. Your first two charts would amount to a bump of about a millimeter or two up against the far right edge of the chart I presented ~ barely noticeable flux. Basically you are focused on pennies and getting worked up over a change of one or two cents while I and others are focused on dollars and see no major change on that scale worth any alarm.

That second chart I presented was to show the pattern of flux over past half a million years and the somewhat regular cycle of "ice ages", about four of such glaciations with a fifth on the verge of "soon"; and that about 4/5ths of the timeline is spent going into, out of, or embedded in much colder weather/climate than we see at this time. Data from other sources shows that we can go from warm inter-glacial into a steep plunge toward glacial and suddenly and more frequent freezing temps within a century or less. Underscoring the concern some of us have that ill considered geoengineering could 'backfire' and trigger far more 'cooling' than most of us would like to see (i.e. sudden plunge to another ice age). (BTW, also shows some more interesting weather/climate change over more than twice the timespan of your two charts.)

A reminder that current ppm (parts per million) of CO2 is a ratio of 1/2,500 of the rest of the atmosphere. Put another way, that's one part CO2 for 2,499 parts Nitrogen, Oxygen, Argon, etc. = dry atmosphere, and we aren't counting the near ten percent additional of water vapor, the REAL GHG factor, or about another 250 +/- ppm for every one ppm of CO2.

More significant is that only in recent @ 50 million years has CO2 dropped below 500ppm compared to the 1000-2000 ppm range of the previous @250 million years. That drop started long before we homo sapiens sapiens came onstage. Which, BTW, many say was more like 300-400,000 years ago (FWIW).

As for your claim of "BSc in Ocean Engineering", this is the internet and anyone can make up anything about their 'credentials'.;
Internet_dog.jpg


Now if you want to throw in the issue of "testicles" and "like a man" into this discussion, than if you really believe that it's human caused CO2 emissions that are 'ruining the Earth' than you should be the one to "man up", do the noble thing, and show some ethics and honesty by no-longer personally producing any CO2. Please save all of us by recycling your karma and useless body and "Save Earth" in the process.
 

Forum List

Back
Top