New Little Ice Age

Because they use "adjusted" temperatures? Go figure.
No, because you can't admit you've been had. They use the exact same "adjusted" numbers the deniers use to say there has been no warming since 1998. The only difference is the deniers know you will parrot their lies without ever checking their numbers. Which you, in fact, did! LOL :cuckoo:


1998 is clearly an outlier, but was touted as the proof of global warming by a very vocal group of Alarmists.

The trend line, ignoring 1998, was up from the late 70's forward until about 2001 when it plateaued and then showed a slight decrease until very recently.

The last several months have been showing an increase again. Not in Indiana. Around here it's been freakishly cold. About 20 degrees off the normal highs. SUCKS!

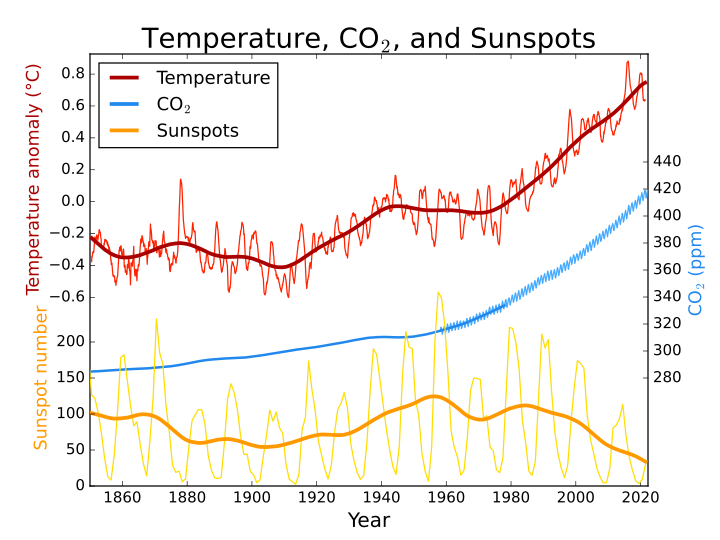
The increase of CO2 has been constant to increasing.

The increase in CO2 has been constant. ENSO and the solar cycle have not. Natural variation accounts for the so called platueing. In fact, the last ten years should have been colder, given a lessor TSI, and a strong La Nina in 2007 and 2008.

The increase in temperature has been constant and accelerating if you do a line for the mean of all the temps for the last 150 years.
 
Factfinder, the post concerning the temps for this year was from Roy Spencer. He has been one of the critics of global warming data. Yet he states that the past three months have shown a very strong upturn tempertures on the global scale.


His criticism of the data could relate to the fact that it is changed post collection by Dr. Hansen and crowd.

Stating that temperatures have increased during the last 3 months is simply reading and commenting on the unaltered data. Reading the unaltered data from the past is what caused the criticism of the altered data presented by the Dr. Hansens of the world.

Really? Dr. Hansen is falsifying the data? Then why are the Europeans, the Russians, and the Japanese getting the same data? Very little differance in their data from ours, and they have their own satellites and instruments.
 
Because they use "adjusted" temperatures? Go figure.
No, because you can't admit you've been had. They use the exact same "adjusted" numbers the deniers use to say there has been no warming since 1998. The only difference is the deniers know you will parrot their lies without ever checking their numbers. Which you, in fact, did! LOL :cuckoo:

The statement backed by the numbers is that the warming has been declining from its peak of 1998.

Whadda ya think u r some kinda spinmeister? :eek:

1998 was an extreme in natural variation. The last ten years have been just the opposite. We should have had some cold years because of the solar minimum and strong La Nina. We did not get them. What we have had since 1998 is the ten warmest years on record.

The solar minimum did not reach trough till last year. We still had plenty of solar activity from 1998 till last year. It has been quiet since.

This correlates nicely with the behavior of the PDO, the polar region expansion and goes a long way in explaining the early snows and general cooling.
 
SpaceWeather.com -- News and information about meteor showers, solar flares, auroras, and near-Earth asteroids

midi163.gif


Sunspot number: 0
Updated 16 Oct 2009

Spotless Days
Current Stretch: 15 days
2009 total: 227 days (79%)
Since 2004: 738 days
Typical Solar Min: 485 days
explanation | more info
Updated 16 Oct 2009
 
Global monthly average lower troposphere temperature above oceans since 1979, according to University of Alabama at Huntsville, USA. This graph uses data obtained by the National Oceanographic and Atmospheric Administration (NOAA) TIROS-N satellite, interpreted by Dr. Roy Spencer and Dr. John Christy, both at Global Hydrology and Climate Center, University of Alabama at Huntsville, USA. The thick line is the simple running 37 month average, nearly corresponding to a running 3 yr average. The cooling and warming periods directly influenced by the 1991 Mt. Pinatubo volcanic eruption and the 1998 El Niño, respectively, are clearly visible. Please note that the temperature scale is slightly different from the scale used in the two diagrams below. Last month shown: September 2009. Last diagram update: 13 October 2009.

climate4you OceanTemperaturesAndSeaLevel

More from Dr. Spencer. Doesn't look like a cooling ocean to me.
 
SpaceWeather.com -- News and information about meteor showers, solar flares, auroras, and near-Earth asteroids

midi163.gif


Sunspot number: 0
Updated 16 Oct 2009

Spotless Days
Current Stretch: 15 days
2009 total: 227 days (79%)
Since 2004: 738 days
Typical Solar Min: 485 days
explanation | more info
Updated 16 Oct 2009

But the temps continue to rise. Hmm............ TSI low, moderate, so far, El Nino, rapidly increasing GHGs, and the temps continue to rise. Could it be that the amount of absorbed heat because of increased GHGs is more than making up for the miniscule drop in TSI? Nah, never let reality intrude on one's ideology!
 
i dont even have to buy a coat for the little ice age season around here, it only get into the 60's, im loving the little ice age period its a whole lot better than that thing theyve been calling "Summer"
 
The amount of CO2 in the atmosphere grows every day, every minute, every second. Soon we will have doubled the amount of CO2 in the atmosphere.

The sun is at its lowest level of activity in 80 years, and yet we are still losing 6.1% of the polar ice cap every decade.


Doubled the amount o CO2 in the atmosphere? It was at 7000 ppm not all that long ago in geological terms and now it is at about 400 ppm. What constant are you dreaming of?

You correctly point out that the Sun's output is lower right now than it has been in some decades. You omit that this level is a very, very recent phenomenom. You then present a multidecadenal measure of ice loss which was measured when the Sun's output was at its highest ever level as measured by instrument or proxy.

This is disingeuous and resembles a swindle-like lie.

It is this type of sleight-of-hand presentation of cherry picked, falsly connected and deliberately omitted facts that causes skeptics to question the tripe put forth by the politicians.

Are you parroting this misleading line or are you one of the swindlers?

This is to ask, "Are you a gullible fool or a decietful swindler?"
 
SpaceWeather.com -- News and information about meteor showers, solar flares, auroras, and near-Earth asteroids

midi163.gif


Sunspot number: 0
Updated 16 Oct 2009

Spotless Days
Current Stretch: 15 days
2009 total: 227 days (79%)
Since 2004: 738 days
Typical Solar Min: 485 days
explanation | more info
Updated 16 Oct 2009
tsi_vs_temp.gif


From the same source, a longer track of data graphed. What needs to be considered is that in about 1978, the method of data collection was augmented by satellites.

Through the nineties, it appears that the annual averages rise to comparatively higher peaks, but around 2000, these peaks have dropped off.

The second half of the 17th Century flatlines on the bottom of what appears to be the measurable scale. The 18th and 19th Centuries vascillate at a level noticably above that and the 20th Century is the highest, again, by a noticable margin.

This seems to correlate nicely with the temperature rises. A constantly rising TSI and a contantly rising temperature.

With the advent of satellite collection of TSI data, the correlation becomes less pronounced on a decadenal scale, but still seems to hold up.

The recent fall off of TSI, the last 10 or so years, seems to be reflected by temps also.

http://chartsgraphs.files.wordpress.com/2009/09/tsi_1611_2009_11yr_ma.png
 
Last edited:
The amount of CO2 in the atmosphere grows every day, every minute, every second. Soon we will have doubled the amount of CO2 in the atmosphere.

The sun is at its lowest level of activity in 80 years, and yet we are still losing 6.1% of the polar ice cap every decade.


Doubled the amount o CO2 in the atmosphere? It was at 7000 ppm not all that long ago in geological terms and now it is at about 400 ppm. What constant are you dreaming of?

You correctly point out that the Sun's output is lower right now than it has been in some decades. You omit that this level is a very, very recent phenomenom. You then present a multidecadenal measure of ice loss which was measured when the Sun's output was at its highest ever level as measured by instrument or proxy.

This is disingeuous and resembles a swindle-like lie.

It is this type of sleight-of-hand presentation of cherry picked, falsly connected and deliberately omitted facts that causes skeptics to question the tripe put forth by the politicians.

Are you parroting this misleading line or are you one of the swindlers?

This is to ask, "Are you a gullible fool or a decietful swindler?"

Seems to me that with all of those statements, at best only partly true, that the same should be asked of you, Code. And it was about 530 million years ago that the atmospheric level of CO2 was at 7000 ppm.

And it is not "tripe" by politicians. The concerns about a climate change driven by the GHGs are being put forward by scientists.

The bullshit that you spew is the talking point of politicians that are doing their best to prevent any action that would cut into the bottom line of the present energy companies.
 
Interesting. It was not until 1935 that there was a 'large' rise in TSI, large as from 1365.4 to 1366.2. That is a rise of less than one tenth of one percent.

Yet the temperature started rising in 1915. And peaked in 1935. But the TSI peaked in 1955. At which time the temps were declining. Hmmmmm.......... I see, temps on earth cause rise and decline in the TSI? Just using the same logic as you have used so many times claiming that CO2 follow temperature. Has just as much validity.

Temps started up again about 1970, but the TSI started rising in 1975. Hmmm........

TSI dropped again in 1985, but the temps just keep right on rising. And so it continues today. Except where we should have had sharp drop in temps due to normal variations in TSI and ENSO, we have only a platueing at a level of warmth previously not seen in the last 150 years.

Seems that your graph disagrees with all of your premises.
 
The sun has always been taken as serious factor in climate. However, if we are having the beginning of a Maunder Minimum, then why are we still having years in the top ten for warmth?

Because we've only been keeping records for barely 120 years and out of those 120 years, we've only been accurate 60 of them and that's just nationally, which is all I care about.

In addition, 2008 was a cooler than average year across most of the country.
 
WikiAnswers - How is Carbon dioxide a greenhouse gas

Now, here's an important point that global warming scientists don't mention. Though carbon dioxide definitely absorbs IR, it only absorbs IR in two very narrow ranges of wavelengths, one between 2.5 and 3 microns, and another between 4 and 5 microns. This is a small percentage of the total IR emitted by the surface. I don't know exactly how small (because I can't find any source for the wavelength distribution of IR emitted from the surface), but it's probably less than 10%, and perhaps as low as 4%. And even in those ranges, CO2 has to compete with water vapor, which also absorbs 2.5-3-micron IR. So, even if carbon dioxide in the atmosphere increased a thousand-fold, and even if there was no water vapor, there is a limit to how much IR CO2 can absorb, and that limit is 10% (or less) of all the IR emitted from the surface. And of that 10%, over half of it still ends up escaping into space.
 
Cold Facts on Global Warming

However, in hard science journals, the graph above would be considered dishonest, because the y-axis starts at 290 instead of zero. This misleads the reader into thinking that CO2 levels have undergone a huge increase when in fact, CO2 levels have only increased by 23.7% since 1900. When the data are plotted honestly, with the y axis starting at zero, the true scope of the change becomes clear.

global-co2-levels.png
 
SpaceWeather.com -- News and information about meteor showers, solar flares, auroras, and near-Earth asteroids

midi163.gif


Sunspot number: 0
Updated 16 Oct 2009

Spotless Days
Current Stretch: 15 days
2009 total: 227 days (79%)
Since 2004: 738 days
Typical Solar Min: 485 days
explanation | more info
Updated 16 Oct 2009
tsi_vs_temp.gif


From the same source, a longer track of data graphed. What needs to be considered is that in about 1978, the method of data collection was augmented by satellites.

Through the nineties, it appears that the annual averages rise to comparatively higher peaks, but around 2000, these peaks have dropped off.

The second half of the 17th Century flatlines on the bottom of what appears to be the measurable scale. The 18th and 19th Centuries vascillate at a level noticably above that and the 20th Century is the highest, again, by a noticable margin.

This seems to correlate nicely with the temperature rises. A constantly rising TSI and a contantly rising temperature.

With the advent of satellite collection of TSI data, the correlation becomes less pronounced on a decadenal scale, but still seems to hold up.

The recent fall off of TSI, the last 10 or so years, seems to be reflected by temps also.

http://chartsgraphs.files.wordpress.com/2009/09/tsi_1611_2009_11yr_ma.png
What a load of crap!
This is a graph that plots temp along with sunspots and CO2 so the relationship can clearly be seen.
720px-Temp-sunspot-co2.svg.png
 
The amount of CO2 in the atmosphere grows every day, every minute, every second. Soon we will have doubled the amount of CO2 in the atmosphere.

The sun is at its lowest level of activity in 80 years, and yet we are still losing 6.1% of the polar ice cap every decade.


Doubled the amount o CO2 in the atmosphere? It was at 7000 ppm not all that long ago in geological terms and now it is at about 400 ppm. What constant are you dreaming of?

You correctly point out that the Sun's output is lower right now than it has been in some decades. You omit that this level is a very, very recent phenomenom. You then present a multidecadenal measure of ice loss which was measured when the Sun's output was at its highest ever level as measured by instrument or proxy.

This is disingeuous and resembles a swindle-like lie.

It is this type of sleight-of-hand presentation of cherry picked, falsly connected and deliberately omitted facts that causes skeptics to question the tripe put forth by the politicians.

Are you parroting this misleading line or are you one of the swindlers?

This is to ask, "Are you a gullible fool or a decietful swindler?"

I love the girations you go through to ignore the facts.

The polar ice cap is melting at a rate of 6.1% per decade, and we have almost doubled the amount of CO2 in the atmosphere in the last 200 years.

And the Sun is at its lowest level of activity in 80 years.

Nice try, though.


Once again, you are citing a recent fall off of TSI and linking it to a reduction in ice that occurred prior to the fall-off.

Once again, the TSI is still at a historic high compared to the last 300 years.

Once again, even at the reduced level of TSI today, the 11 year moving average is higher than it was at any point in the record before about 1920 all the way back to about 1620.

The increase of the TSI pre-dates the Industrial Revolution by about 100 years and the resulting warming pre-dates any increase in CO2 that could possibly have resulted from the Industrial Revolution.

By the by, the Ice Extent in the Arctic has been increasing or stable lately.

So, to re-cap, the CO2 increases consistanly and the TSI varies slightly. The very slight variation in the TSI seems to be reflected in both the temperature and the Ice Extent while the vey consistanly increasing CO2 seems to have little or no impact on anything except the guages at Mauna Loa.

Now then, tell me again how the decrease in TSI across the last 3 years affected Arctic Sea Ice Extent 40 years ago.

http://chartsgraphs.files.wordpress.com/2009/09/tsi_1611_2009_11yr_ma.png
 
Last edited:

Forum List

Back
Top