Old Rocks
Diamond Member
Doubled the amount o CO2 in the atmosphere? It was at 7000 ppm not all that long ago in geological terms and now it is at about 400 ppm. What constant are you dreaming of?
You correctly point out that the Sun's output is lower right now than it has been in some decades. You omit that this level is a very, very recent phenomenom. You then present a multidecadenal measure of ice loss which was measured when the Sun's output was at its highest ever level as measured by instrument or proxy.
This is disingeuous and resembles a swindle-like lie.
It is this type of sleight-of-hand presentation of cherry picked, falsly connected and deliberately omitted facts that causes skeptics to question the tripe put forth by the politicians.
Are you parroting this misleading line or are you one of the swindlers?
This is to ask, "Are you a gullible fool or a decietful swindler?"
I love the girations you go through to ignore the facts.
The polar ice cap is melting at a rate of 6.1% per decade, and we have almost doubled the amount of CO2 in the atmosphere in the last 200 years.
And the Sun is at its lowest level of activity in 80 years.
Nice try, though.
Once again, you are citing a recent fall off of TSI and linking it to a reduction in ice that occurred prior to the fall-off.
Once again, the TSI is still at a historic high compared to the last 300 years.
Once again, even at the reduced level of TSI today, the 11 year moving average is higher than it was at any point in the record before about 1920 all the way back to about 1620.
The increase of the TSI pre-dates the Industrial Revolution by about 100 years and the resulting warming pre-dates any increase in CO2 that could possibly have resulted from the Industrial Revolution.
By the by, the Ice Extent in the Arctic has been increasing or stable lately.
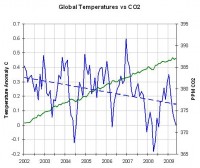
So, to re-cap, the CO2 increases consistanly and the TSI varies slightly. The very slight variation in the TSI seems to be reflected in both the temperature and the Ice Extent while the vey consistanly increasing CO2 seems to have little or no impact on anything except the guages at Mauna Loa.
Now then, tell me again how the decrease in TSI across the last 3 years affected Arctic Sea Ice Extent 40 years ago.
http://chartsgraphs.files.wordpress.com/2009/09/tsi_1611_2009_11yr_ma.png
You interpret more than two deviations from the 29 year average as stable? I don't think I would want you on a team determining land stability in a slide zone.
LOL. Sure, the TSI is declining, we had a strong La Nina, and still since 1998 we have had the ten warmest years on record. Counting 1998, that is the ten warmest years on record in period of eleven years. And we are cooling???????????

And they were running freighters through the Northeast Passage forty years ago?