It's more than you have posted on the instantaneous radiative forcing of CO2. You have provided nothing but your ADMITTED uninformed opinion.Haha, look at you cherry picking blogs you dint understand from discredited deniers. Sad.
By the way, 1degC is not even in the range of the warming that will be caused by doubling the CO2 from before the industrial era. As honest people who follow the science understand.
Navigation
Install the app
How to install the app on iOS
Follow along with the video below to see how to install our site as a web app on your home screen.

Note: This feature currently requires accessing the site using the built-in Safari browser.
More options
You are using an out of date browser. It may not display this or other websites correctly.
You should upgrade or use an alternative browser.
You should upgrade or use an alternative browser.
Less than a billion years....probably a lot less....
- Thread starter justoffal
- Start date
Fort Fun Indiana
Diamond Member
- Mar 10, 2017
- 93,170
- 61,395
- 2,645
I don't need to post any of that. I defer to the scientists, not to uneducated slobs on message boards.It's more than you have posted on the instantaneous radiative forcing of CO2. You have provided nothing but your ADMITTED uninformed opinion.
View attachment 862445
But they add in climate sensitivity. I am discussing the instantaneous radiative forcing of CO2. Which they have but are hiding from you.Because i don't have to do that. The scientific community does all the work for me. I don't have to search for blogs I never read and don't understand by discredited deniers.
So until you can provide something from them on that Dr. Spencer stands unrefuted.
I don't need to post any of that. I defer to the scientists, not to uneducated slobs on message boards.
Fort Fun Indiana
Diamond Member
- Mar 10, 2017
- 93,170
- 61,395
- 2,645
I don't believe your lies, sorry. Publish your science. If it is worth anything more than hearty laughter, I will see it.But they add in climate sensitivity. I am discussing the instantaneous radiative forcing of CO2. Which they have but are hiding from you.
So until you can provide something from them on that Dr. Spencer stands unrefuted.
"Now, you might be surprised to learn that the amount of warming directly caused by us adding extra CO2 to the atmosphere is, by itself, relatively weak. It has been calculated theoretically that, if there are no other changes in the climate system, a doubling of the atmospheric CO2 concentration would cause about 1 deg C of surface warming. This is NOT a controversial statement…it is well understood by climate scientists. As of early 2019, we were about 50% of the way toward a doubling of atmospheric CO2." Dr. Roy SpencerI don't believe your lies, sorry. Publish your science. If it is worth anything more than hearty laughter, I will see it.
- Mar 3, 2006
- 7,215
- 2,566
- 315
We have been thru one this one and I debunked your Spencer try.
But even the Denier Spencer Cutely/Deceptively uses the phrase "if CO2 By Itself," fully knowing it also drives how much Water Vapor it causes.. Causes More he goes on to mention. (unquoted)
Same with Methane as it snowballs it's feedback from and into more warming.
SO CO2 "IF ONLY Viewed by itself" is a DISINGENUOUS TRY.
Those 3 GHGs drive virtually ALL the warming triggered by... CO2.
Deceptive Scvmbag Citation by Ding.
It might work on Fort Fun, but Not Me.
I understand the climate System.
- - - - -- - - - -- - - -- - - -
The above was November 14 and dingo just keeps repeating Misleading and obsolete passages.
Just like his Biggest Lie: "Normal Interglacial."
Ding is a Mentally Ill Conspiracist.
`
"...the amount of warming directly caused by us adding extra CO2 to the atmosphere is, by itself, relatively weak. It has been calculated theoretically that, if there are no other changes in the climate system, a doubling of the atmospheric CO2 concentration would cause about 1 deg C of surface warming. This is NOT a controversial statement…it is well understood by climate scientists. As of early 2019, we were about 50% of the way toward a doubling of atmospheric CO2..."
GW 101 - Roy Spencer, PhD.
But even the Denier Spencer Cutely/Deceptively uses the phrase "if CO2 By Itself," fully knowing it also drives how much Water Vapor it causes.. Causes More he goes on to mention. (unquoted)
Same with Methane as it snowballs it's feedback from and into more warming.
SO CO2 "IF ONLY Viewed by itself" is a DISINGENUOUS TRY.
Those 3 GHGs drive virtually ALL the warming triggered by... CO2.
Deceptive Scvmbag Citation by Ding.
It might work on Fort Fun, but Not Me.
I understand the climate System.
- - - - -- - - - -- - - -- - - -
The above was November 14 and dingo just keeps repeating Misleading and obsolete passages.
Just like his Biggest Lie: "Normal Interglacial."
Ding is a Mentally Ill Conspiracist.
`
Captain Caveman
Platinum Member
What was/is now your own personal carbon footprint and what have you personally done to reduce it?I don't believe your lies, sorry. Publish your science. If it is worth anything more than hearty laughter, I will see it.
Zhong-Haigh-2013 did the work on instantaneous radiative forcing of CO2. So that's two references for the instantaneous radiative forcing of CO2 to your none.We have been thru one this one and I debunked your Spencer try.
But even the Denier Spencer Cutely/Deceptively uses the phrase "if CO2 By Itself," fully knowing it also drives how much Water Vapor it causes.. Causes More he goes on to mention. (unquoted)
Same with Methane as it snowballs it's feedback from and into more warming.
SO CO2 "IF ONLY Viewed by itself" is a DISINGENUOUS TRY.
Those 3 GHGs drive virtually ALL the warming triggered by... CO2.
Deceptive Scvmbag Citation by Ding.
It might work on Fort Fun, but Not Me.
I understand the climate System.
- - - - -- - - - -- - - -- - - -
The above was November 14 and dingo just keeps repeating Misleading and obsolete passages.
Just like his Biggest Lie: "Normal Interglacial."
Ding is a Mentally Ill Conspiracist.
`
"Now, you might be surprised to learn that the amount of warming directly caused by us adding extra CO2 to the atmosphere is, by itself, relatively weak. It has been calculated theoretically that, if there are no other changes in the climate system, a doubling of the atmospheric CO2 concentration would cause about 1 deg C of surface warming. This is NOT a controversial statement…it is well understood by climate scientists. As of early 2019, we were about 50% of the way toward a doubling of atmospheric CO2." Dr. Roy Spencer
- Mar 3, 2006
- 7,215
- 2,566
- 315
We have been thru one this one and I debunked your Spencer try
Where is Repeating REFUTED arguments in your Triangle ypou Sick little Mental case?
Same with Methane as it snowballs it's feedback from and into more warming.
SO CO2 "IF ONLY Viewed by itself" is a DISINGENUOUS TRY.
Those 3 GHGs drive virtually ALL the warming triggered by... CO2.
Deceptive Scvmbag Citation by Ding.
It might work on Fort Fun, but Not Me.
I understand the climate System.
`
- - - - -- - - - -- - - -- - - -
The above was November 14 and dingo just keeps repeating Misleading and obsolete passages.
Just like his Biggest Lie: "Normal Interglacial."
Ding is a Mentally Ill Conspiracist.
`
Where is Repeating REFUTED arguments in your Triangle ypou Sick little Mental case?
But even the Denier Spencer Cutely/Deceptively uses the phrase "if CO2 By Itself," fully knowing it also drives how much Water Vapor it causes.. Causes More he goes on to mention. (unquoted)"...the amount of warming directly caused by us adding extra CO2 to the atmosphere is, by itself, relatively weak. It has been calculated theoretically that, if there are no other changes in the climate system, a doubling of the atmospheric CO2 concentration would cause about 1 deg C of surface warming. This is NOT a controversial statement…it is well understood by climate scientists. As of early 2019, we were about 50% of the way toward a doubling of atmospheric CO2..."
GW 101 - Roy Spencer, PhD.
Same with Methane as it snowballs it's feedback from and into more warming.
SO CO2 "IF ONLY Viewed by itself" is a DISINGENUOUS TRY.
Those 3 GHGs drive virtually ALL the warming triggered by... CO2.
Deceptive Scvmbag Citation by Ding.
It might work on Fort Fun, but Not Me.
I understand the climate System.
`
- - - - -- - - - -- - - -- - - -
The above was November 14 and dingo just keeps repeating Misleading and obsolete passages.
Just like his Biggest Lie: "Normal Interglacial."
Ding is a Mentally Ill Conspiracist.
`
Zhong-Haigh-2013 did the work on instantaneous radiative forcing of CO2. So that's two references for the instantaneous radiative forcing of CO2 to your none.We have been thru one this one and I debunked your Spencer try
Where is Repeating REFUTED arguments in your Triangle ypou Sick little Mental case?
But even the Denier Spencer Cutely/Deceptively uses the phrase "if CO2 By Itself," fully knowing it also drives how much Water Vapor it causes.. Causes More he goes on to mention. (unquoted)
Same with Methane as it snowballs it's feedback from and into more warming.
SO CO2 "IF ONLY Viewed by itself" is a DISINGENUOUS TRY.
Those 3 GHGs drive virtually ALL the warming triggered by... CO2.
Deceptive Scvmbag Citation by Ding.
It might work on Fort Fun, but Not Me.
I understand the climate System.
`
- - - - -- - - - -- - - -- - - -
The above was November 14 and dingo just keeps repeating Misleading and obsolete passages.
Just like his Biggest Lie: "Normal Interglacial."
Ding is a Mentally Ill Conspiracist.
`
- Mar 3, 2006
- 7,215
- 2,566
- 315
Zhong-Haigh-2013 did the work on instantaneous radiative forcing of CO2. So that's two references for the instantaneous radiative forcing of CO2 to your none.

That's it? A tiny wittle climate Model from.. nowhere.
No context at all.
No link, no nothing.
And we don't know where we are on his graph.
While of course we have the earths Actual CO2 and Temp before and in the 10 HOTTEST Years since 2013.
Reality screwed your NON-refutation of Anything.
`
That's it? A tiny wittle climate Model from.. nowhere.
No context at all.
No link, no nothing.
And we don't know where we are on his graph.
While of course we have the earths Actual CO2 and Temp before and in the 10 HOTTEST Years since 2013.
Reality screwed your NON-refutation of Anything.
`
- Mar 3, 2006
- 7,215
- 2,566
- 315
So where is your little UNLINKED, UNCONTEXTED (as to where we are on it) Graph-from-Nowhere on your OFF TOPIC Triangle?
I Justifiably questioned your Unlinked/Uncontexted post from nowhere, and pointed out the Actual data/10 Hottest Years since it was conceived. OUCH.
So Unable to Answer (again), YOU are again Image-Trolling like EMH.
`
Zhong-Haigh-2013 is a valid citation, dummy, and showed the instantaneous radiative forcing of CO2 at 400 ppm, 800 ppm and 1600 ppm. It took a doubling of CO2 to get the same incremental response.So where is your little UNLINKED, UNCONTEXTED (as to where we are on it) Graph-from-Nowhere on your OFF TOPIC Triangle?
I Justifiably questioned your UNlinked/uncontexted post from nowhere, and pointed out out the actual data/10 Hottest Years since it was conceived.
So Unable to Answer (again), YOU are again Image-Trolling like EMH
`[/B]
Last edited:
- Mar 3, 2006
- 7,215
- 2,566
- 315
Zhong-Haigh-2013 is a valid citation, dummy, and showed the instantaneous radiative forcing of CO2 at 400 ppm, 800 ppm and 1600 ppm. It took a doubling of CO2 to get the same incremental response.
And here's why you didn't link/context it.
You just stole it from some other denier, or possibly cherry picked from the study I link below.
You are DISHONESTLY withholding (or Ignorant of) contrary info OF COURSE. (the other two graphs from the sequence: Figures 6b and 6c. which are not logarithmic.)
I realized it was a conspicuously tiny graph from a unlinked/uncontexted larger study.
Red Alert. Just find it.
Zhong-Haig 2013
"..More recently the saturation issue has been resurrected in Attempts to Deny the existence of Anthropogenic Climate Change. Very clear explanations (e.g. by Archer, 2007;Pierrehumbert, 2011) have been given of the basic physics as to why these arguments are flawed. Here we show in detail how, although the very centre of the 15μm band does become saturated, greenhouse trapping by CO2 at other wavelengths is far from saturation and that, as its concentration exceeds approximately 800ppmv1, its effect actually increases at a rate faster than logarithmic."..."
From Full Study:
(See contrary graphs 6b, 6c, from the full Fig 6 graphic that ding's 6a was dishonestly poached from).
And THAT is how it's done.
Ding is knowingly DISHONEST and Misleading.
But I am much smarter than he and GUT him every time. Every link/search makes me learn more.
Bl0 me!
EDIT: Note the now CAUGHT Loser below with NO TOPICAL COMEBACK.
Ding will probably keep posting to cover ANOTHER LOSS of His. The usual.
`
Last edited:
If you could write a coherent paragraph I might be able to understand you.And here's why you didn't link/context it.
You just stole it from some other denier, or possibly cherry picked from the study I link below.
You are DISHONESTLY withholding contrary info OF COURSE. (the other two graphs from the sequence: Figures 6b and 6c. which are not logarithmic.)
I realized it was conspicuously a tiny graph from a unlinked/uncontexted larger study.
Red Alert. Just find it.
Zhong-Haig 2013
"..More recently the saturation issue has been resurrected in Attempts to Deny the existence of Anthropogenic Climate Change. Very clear explanations (e.g. by Archer, 2007;Pierrehumbert, 2011) have been given of the basic physics as to why these arguments are flawed. Here we show in detail how, although the very centre of the 15μm band does become saturated, greenhouse trapping by CO2 at other wavelengths is far from saturation and that, as its concentration exceeds approximately 800ppmv1, its effect actually increases at a rate faster than logarithmic."..."
From Full Study:
(See contrary graphs 6b, 6c, to go with your cherry picked/UNCONTEXTED 6a.
and THAT is how it's done.
You are knowingly DISHONEST and Misleading.
But I am much smarter than anyone else here, and GUT you every time.
Bl0 me!
`
TCR tends to be notably lower than ECS. The Intergovernmental Panel on Climate Change (IPCC) fifth assessment report, completed in 2014, gave a likely ECS range of 1.5C to 4.5C of warming for a doubling of atmospheric CO2 concentrations, but a likely TCR of only 1C to 2.5C.And here's why you didn't link/context it.
You just stole it from some other denier, or possibly cherry picked from the study I link below.
You are DISHONESTLY withholding (or Ignorant of) contrary info OF COURSE. (the other two graphs from the sequence: Figures 6b and 6c. which are not logarithmic.)
I realized it was a conspicuously tiny graph from a unlinked/uncontexted larger study.
Red Alert. Just find it.
Zhong-Haig 2013
"..More recently the saturation issue has been resurrected in Attempts to Deny the existence of Anthropogenic Climate Change. Very clear explanations (e.g. by Archer, 2007;Pierrehumbert, 2011) have been given of the basic physics as to why these arguments are flawed. Here we show in detail how, although the very centre of the 15μm band does become saturated, greenhouse trapping by CO2 at other wavelengths is far from saturation and that, as its concentration exceeds approximately 800ppmv1, its effect actually increases at a rate faster than logarithmic."..."
From Full Study:
(See contrary graphs 6b, 6c, from the full Fig 6 graphic that ding's 6a was dishonestly poached from).
And THAT is how it's done.Ding is knowingly DISHONEST and Misleading.But I am much smarter than he and GUT him every time. Every link/search makes me learn more.Bl0 me!
EDIT: Note the now CAUGHT Loser below with NO TOPICAL COMEBACK.
Ding will probably keep posting to cover ANOTHER LOSS of His. The usual.
`
This is not something I'm up on: anyone know about it??
"
8. Correlation between the Temperature of the Earth and Earth’s Global Magnetic Field
Long-term coincidence between climatic temperatures of the Earth on the one hand and the global strength of the MF of the Earth on the other is a well-known and accepted fact.
Figure 10 and Figure 11 show the temperature and magnetic data sets. In Figure 12 these data are combined. After the last Ice Age, it took our planet 4000 years to reach the climatic temperature we have today. Periods with greater thermal heat releases from the interior of the Earth, especially in the Arctic Ocean, can cause a diminishing ability of the Arctic Ocean to properly participate in the process of cooling down the warm water masses of the Gulf Stream as well as to release frozen magnetic flux.
The coinciding data clearly indicate that the cause of ice ages is almost completely misunderstood and that Milankovitch cycles are far from enough to fully understand the cause-effect process (Milankovitch Cycles) . Figure 12 shows the red graph (Earth’s magnetic field) intensely following the temperature graph (black graph). As can be seen, the magnetic field does not coincide with the much faster variations in the temperature graph, meaning the ones varying from a couple of hundred years to a couple of thousand years.
The reason is that the strength of the magnetic field is determined by two factors:
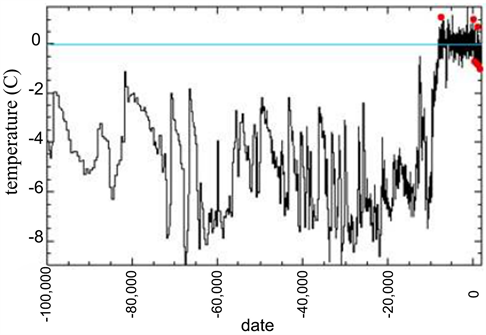
Figure 10. Temperature variation 100,000 years.
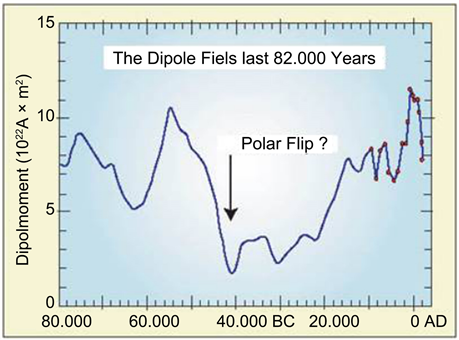
Figure 11. The dipole field for the past 82,000 years.
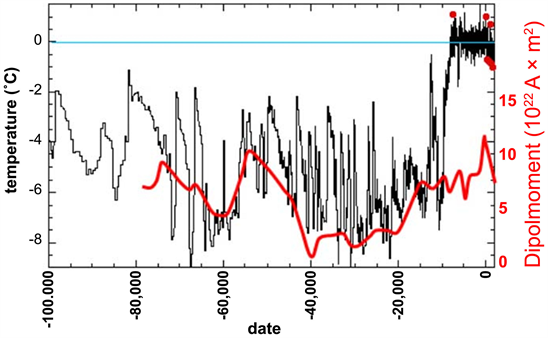
Figure 12. Atmospheric temperature and magnetic magnitude 0 - 80,000 years B.P.
· partly determined by either the heat flow and/or solar activity variations shown by (Henrik Svenmark) ;
· and partly determined by MNP in an area with various magnetic susceptibility. The fast, stray MNP causes the quick variation of the magnetic field.
...........................
11. Conclusion
In conclusion, there is no need for an electromagnetic inner dynamo theory to explain:
· the periods of the basic magnetic state,
· the integration process,
· the magnetic pole reversal,
· the magnetic anomalies,
· the movement of the magnetic poles,
· anything else...
We are dealing with a simple and completely natural ferromagnetic process in the Earth’s crust busted by the solar wind (and nothing more than that). Much points in one direction: areas containing thermal heat play a role in shaping the FMF of our planet (because these areas hold very great integrating forces on the local level as well as in relation to the global field). An unknown contribution to the cause of ice ages could very well be less emission of inner heat.
The largest contribution to climatic change (also these days) is most likely the correlation between solar activity and cosmic radiation reaching the Earth resulting in cloud formations as shown by Henrik Svensmark and his team (Henrik Svenmark; The Sun Allergy of Climate Researchers; Henrik Svensmark’s Research) . As the ocean accumulates heat, a delay in the cause-effect must be expected.
A consequence must be that periods of solar activity are not always brief (which means not only periods of 11 years or periods of a few hundred or thousand years) but also periodic solar activity cycles that last 100,000 years—before that 41,000 years and before that 15,000 years. This is required in order to be able to link the coincidence between climatic temperature and the Earth’s magnetic field.
 www.scirp.org
I've not seen much about this lately but it was given some news time in the 90s if I recall.
Greg
"
8. Correlation between the Temperature of the Earth and Earth’s Global Magnetic Field
Long-term coincidence between climatic temperatures of the Earth on the one hand and the global strength of the MF of the Earth on the other is a well-known and accepted fact.
Figure 10 and Figure 11 show the temperature and magnetic data sets. In Figure 12 these data are combined. After the last Ice Age, it took our planet 4000 years to reach the climatic temperature we have today. Periods with greater thermal heat releases from the interior of the Earth, especially in the Arctic Ocean, can cause a diminishing ability of the Arctic Ocean to properly participate in the process of cooling down the warm water masses of the Gulf Stream as well as to release frozen magnetic flux.
The coinciding data clearly indicate that the cause of ice ages is almost completely misunderstood and that Milankovitch cycles are far from enough to fully understand the cause-effect process (Milankovitch Cycles) . Figure 12 shows the red graph (Earth’s magnetic field) intensely following the temperature graph (black graph). As can be seen, the magnetic field does not coincide with the much faster variations in the temperature graph, meaning the ones varying from a couple of hundred years to a couple of thousand years.
The reason is that the strength of the magnetic field is determined by two factors:
Figure 10. Temperature variation 100,000 years.
Figure 11. The dipole field for the past 82,000 years.
Figure 12. Atmospheric temperature and magnetic magnitude 0 - 80,000 years B.P.
· partly determined by either the heat flow and/or solar activity variations shown by (Henrik Svenmark) ;
· and partly determined by MNP in an area with various magnetic susceptibility. The fast, stray MNP causes the quick variation of the magnetic field.
...........................
11. Conclusion
In conclusion, there is no need for an electromagnetic inner dynamo theory to explain:
· the periods of the basic magnetic state,
· the integration process,
· the magnetic pole reversal,
· the magnetic anomalies,
· the movement of the magnetic poles,
· anything else...
We are dealing with a simple and completely natural ferromagnetic process in the Earth’s crust busted by the solar wind (and nothing more than that). Much points in one direction: areas containing thermal heat play a role in shaping the FMF of our planet (because these areas hold very great integrating forces on the local level as well as in relation to the global field). An unknown contribution to the cause of ice ages could very well be less emission of inner heat.
The largest contribution to climatic change (also these days) is most likely the correlation between solar activity and cosmic radiation reaching the Earth resulting in cloud formations as shown by Henrik Svensmark and his team (Henrik Svenmark; The Sun Allergy of Climate Researchers; Henrik Svensmark’s Research) . As the ocean accumulates heat, a delay in the cause-effect must be expected.
A consequence must be that periods of solar activity are not always brief (which means not only periods of 11 years or periods of a few hundred or thousand years) but also periodic solar activity cycles that last 100,000 years—before that 41,000 years and before that 15,000 years. This is required in order to be able to link the coincidence between climatic temperature and the Earth’s magnetic field.
Earth’s Magnetic Field—The Key to Global Warming
It is commonly known that the climate debate suffers due to a lack of knowledge about the cause and effect relationship between a number of climatic temperature variations that have occurred in history without being able to blame human emission of greenhouse gas in any way. Only when we are...
I've not seen much about this lately but it was given some news time in the 90s if I recall.
Greg
Similar threads
- Replies
- 3
- Views
- 144
- Replies
- 6
- Views
- 264
- Replies
- 38
- Views
- 756
- Replies
- 11
- Views
- 389
Latest Discussions
- Replies
- 540
- Views
- 4K
- Replies
- 122
- Views
- 580
Forum List
-
-
-
-
-
Political Satire 8108
-
-
-
-
-
-
-
-
-
-
-
-
-
-
-
-
-
-
-
ObamaCare 781
-
-
-
-
-
-
-
-
-
-
-
Member Usernotes 471
-
-
-
-
-
-
-
-
-
-