Hansen says CO2 is NOT the prime driver in this paper

A point here. Were India and China to suddenly lower their emissions, we would get an immediate, decade, spike in temperatures. This is the Faustian Bargain Dr. Hansen described so well.

True, as aerosols tend to settle/condense out of the atmosphere over about a decade's worth of time, whereas the nominal and unqualified atmospheric half-life (residence) for CO2 is measured in centuries.
 
He wrote the paper 12 years after his now famous testimony before Congress where he laid out his famous three graphs showing what would happen with ever increasing CO2 levels. Remember? Scenario's A, B, and of course C. Even with the CO2 levels increasing FAR above even his worst guestimate the temps havn't come even close to his worst case scenario...in fact they havn't even come close to his BEST case scenario...

Congressional testimony in 1988, given that it usually takes around a year after completing a paper for it to actually appear in a Journal, you generally quit looking at new data for a paper once you begin writing the paper, and when working with co-authors the actual writing of the paper can take anywhere from a few months to a year and this paper was published in the year 2000, he more than likely started writing this paper within a decade of his congressional testimony - but that is a minor quibble.

As for the accuracy of the projection senario graphs he displayed at that congressional testimony, if anything, even the worst-case senario has proven to underestimate what we have actually seen happen over the last 24 years.
 
Rather than attempting to improperly parse the abstract, why not look at the contextual understandings provided by the actual text of the research paper?

"Global warming in the twenty-first century: An alternative scenario" - http://pubs.giss.nasa.gov/docs/2000/2000_Hansen_etal_2.pdf


of course it is important to realize that Dr Hansen's considerations took place back pre-2000 in an era when our planetary CO2 emissions were significantly lower than they currently are. If we had been prepared to act decisively and aggressively to tackle climate change back 12+ years ago, the more gradualist approach suggested by Hansen in this post, might well have had a shot at producing some good results, after a decade where the rate of emission increase has more than doubled it seems much more a case of wishful thinking on the part of Dr Hansen.


He wrote the paper 12 years after his now famous testimony before Congress where he laid out his famous three graphs showing what would happen with ever increasing CO2 levels. Remember? Scenario's A, B, and of course C. Even with the CO2 levels increasing FAR above even his worst guestimate the temps havn't come even close to his worst case scenario...in fact they havn't even come close to his BEST case scenario.

I think he realised he was wrong and was actually doing some good science there. Then all of a sudden the TEAM got into positions of power and voila, climatology entered the realm of the psychics.


CO2 is now the primary driver because we have dealt with non-CO2 GHG emissions by reducing them. There's absolutely nothing that is inconsistent with his view now and then.

What happened to the 50 or 200 year lag in the EFFECTs of altering GHGs? You want to ignore that now when it's convienient? If we've been successful in reducing NOx and SOx for instance, their effect on Ocean Acidification might not be measureable for another 50 years... So -- is the current slowing of temp rise due to our reduction of "the other" GHGs?
 
Last edited:
There may have been some regionally warm times associated with the RWP and there was definitely broader regional warming during the MWP, but neither of these seem to have been anything like the scale and magnitude of the current global warming.

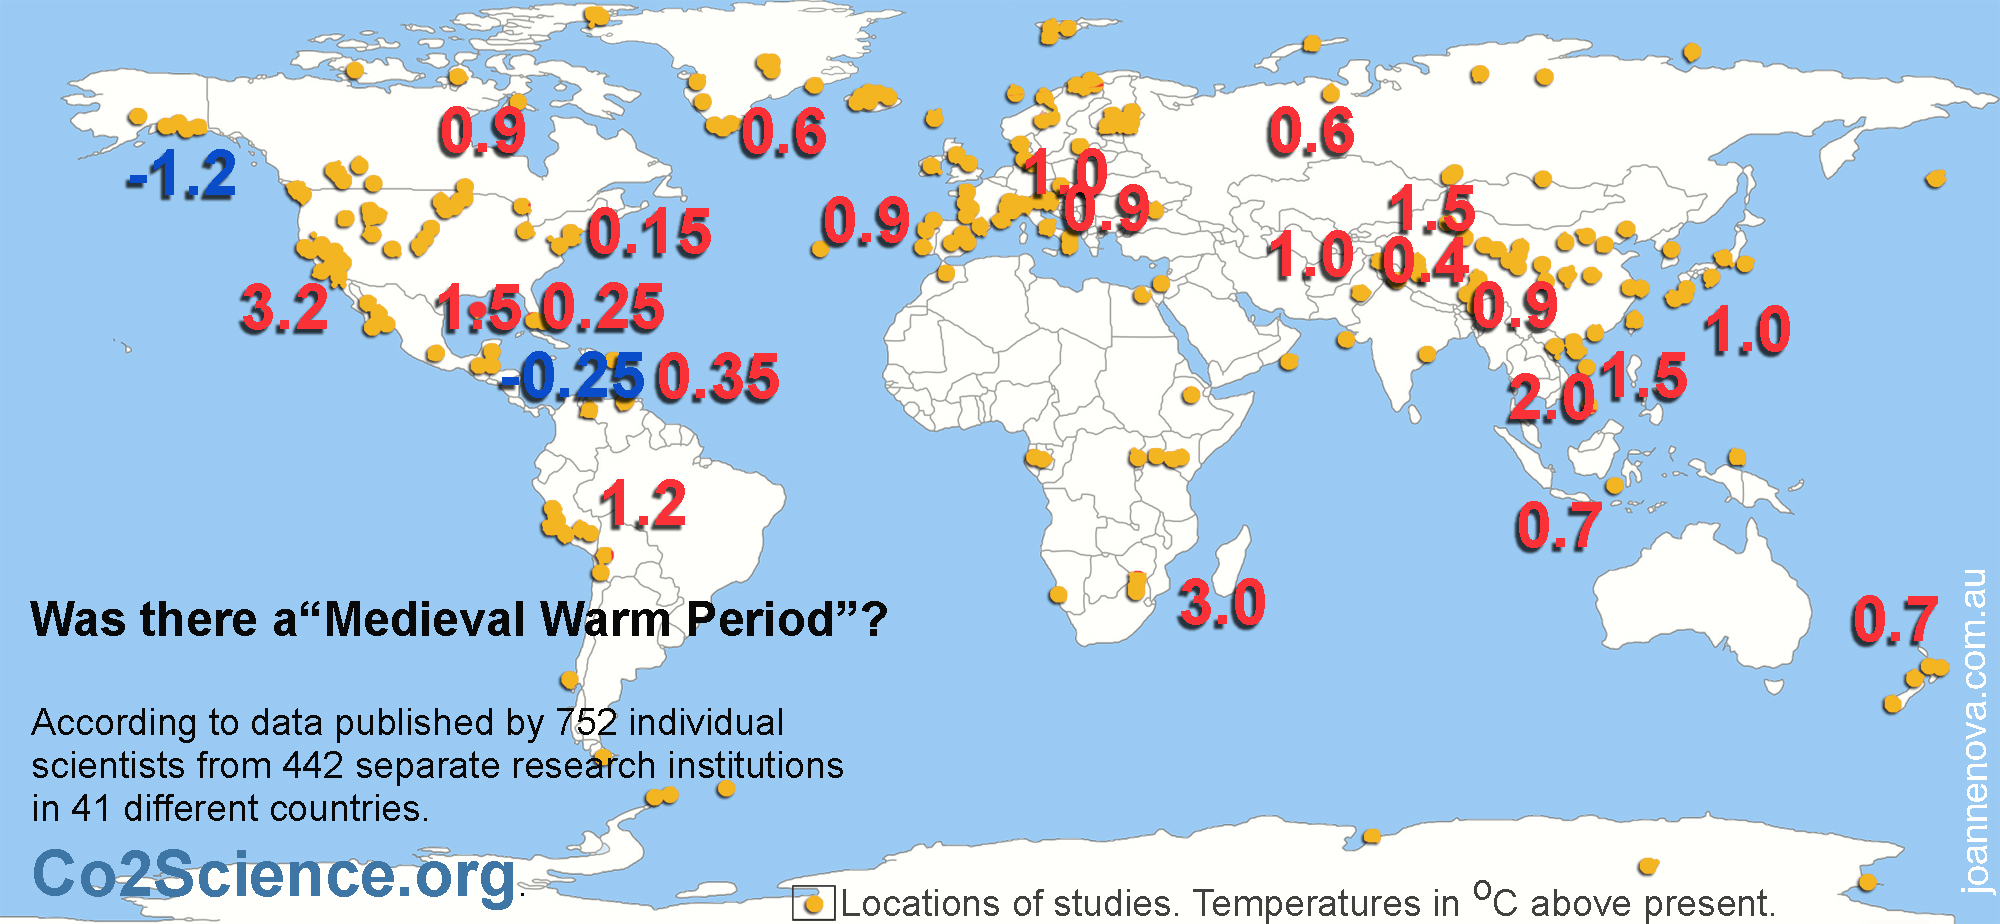
Really? Here is what the published, peer reviewed studies say the MWP looked like globally.

mwp-global-studies-map-i-1500.jpg


Here is a good interactive map. The color and shape of the symbol denotes whether the study was level I, II, or III and clicking on it will bring up the title of the study and the findings.

CO2 Science Medieval Warm Period Project Map
 
There may have been some regionally warm times associated with the RWP and there was definitely broader regional warming during the MWP, but neither of these seem to have been anything like the scale and magnitude of the current global warming.

Really? Here is what the published, peer reviewed studies say the MWP looked like globally.

According to a reconstruction created by a partisan political advocacy blog, and even so, it is not inconsistent with my portrayal above.

This is what equivilant global maps look like that that compare the published science regarding average annual temps now, and average annual temps at the height of the MWP.
(Courtesy of NOAA)

Medieval War Period
trakar-albums-agw-picture3532-temperature-pattern-mwp.gif


Current
trakar-albums-agw-picture3533-temp-pattern-1999-2008-noaa.jpg
 
Last edited:
He wrote the paper 12 years after his now famous testimony before Congress where he laid out his famous three graphs showing what would happen with ever increasing CO2 levels. Remember? Scenario's A, B, and of course C. Even with the CO2 levels increasing FAR above even his worst guestimate the temps havn't come even close to his worst case scenario...in fact they havn't even come close to his BEST case scenario.

I think he realised he was wrong and was actually doing some good science there. Then all of a sudden the TEAM got into positions of power and voila, climatology entered the realm of the psychics.


CO2 is now the primary driver because we have dealt with non-CO2 GHG emissions by reducing them. There's absolutely nothing that is inconsistent with his view now and then.

What happened to the 50 or 200 year lag in the EFFECTs of altering GHGs? You want to ignore that now when it's convienient? If we've been successful in reducing NOx and SOx for instance, their effect on Ocean Acidification might not be measureable for another 50 years... So -- is the current slowing of temp rise due to our reduction of "the other" GHGs?

Link for your 50 to 200 years?
 
I can dig up any amount of paleo climate and written history from many periods in mans history when there was greater warming than there is today and not one of the terrible things you all claim will happen ever did.

Please do (dig them up, that is), the best available evidence indicates that today's annual, globally averaged temperature, is warmer than any period in the last several million years. Modern humans have only existed for a few hundred thousand years. Given this, you are either looking at early, incomplete and inaccurate temperature data, or you have some revolutionary information regarding human evolution up your sleeve,...either way, I'd be interested in seeing any evidences you feel compellingly support your assertions.

You have tried so desperately to remove the RWP and the MWP from the historical record but sadly for you there are still people out there who read real books and they know the lies for what they are.

You are failing on an epic scale and it's going to be fun to watch the wheels come off.

There may have been some regionally warm times associated with the RWP and there was definitely broader regional warming during the MWP, but neither of these seem to have been anything like the scale and magnitude of the current global warming.


Here are a FEW of the peer reviewed papers that show the MWP to have been global.

"Abstract

Calcium carbonate can crystallize in a hydrated form as ikaite at low temperatures. The hydration water in ikaite grown in laboratory experiments records the δ18O of ambient water, a feature potentially useful for reconstructing δ18O of local seawater. We report the first downcore δ18O record of natural ikaite hydration waters and crystals collected from the Antarctic Peninsula (AP), a region sensitive to climate fluctuations. We are able to establish the zone of ikaite formation within shallow sediments, based on porewater chemical and isotopic data. Having constrained the depth of ikaite formation and δ18O of ikaite crystals and hydration waters, we are able to infer local changes in fjord δ18O versus time during the late Holocene. This ikaite record qualitatively supports that both the Medieval Warm Period and Little Ice Age extended to the Antarctic Peninsula."


ScienceDirect.com - Earth and Planetary Science Letters - An ikaite record of late Holocene climate at the Antarctic Peninsula

CO2 Science

ScienceDirect.com - Quaternary Research - 7000years of paleostorm activity in the NW Mediterranean Sea in response to Holocene climate events

CO2 Science

There are well over 100 more.
 
He wrote the paper 12 years after his now famous testimony before Congress where he laid out his famous three graphs showing what would happen with ever increasing CO2 levels. Remember? Scenario's A, B, and of course C. Even with the CO2 levels increasing FAR above even his worst guestimate the temps havn't come even close to his worst case scenario...in fact they havn't even come close to his BEST case scenario...

Congressional testimony in 1988, given that it usually takes around a year after completing a paper for it to actually appear in a Journal, you generally quit looking at new data for a paper once you begin writing the paper, and when working with co-authors the actual writing of the paper can take anywhere from a few months to a year and this paper was published in the year 2000, he more than likely started writing this paper within a decade of his congressional testimony - but that is a minor quibble.

As for the accuracy of the projection senario graphs he displayed at that congressional testimony, if anything, even the worst-case senario has proven to underestimate what we have actually seen happen over the last 24 years.


Really? Do tell. Show us any empirical data that supports that assertion. And please, use the UNALTERED (i.e. falsified) historical temperature data.
 
There may have been some regionally warm times associated with the RWP and there was definitely broader regional warming during the MWP, but neither of these seem to have been anything like the scale and magnitude of the current global warming.

Really? Here is what the published, peer reviewed studies say the MWP looked like globally.

According to a reconstruction created by a partisan political advocacy blog, and even so, it is not inconsistent with my portrayal above.

This is what equivilant global maps look like that that compare the published science regarding average annual temps now, and average annual temps at the height of the MWP.
(Courtesy of NOAA)

Medieval War Period
trakar-albums-agw-picture3532-temperature-pattern-mwp.gif


Current
trakar-albums-agw-picture3533-temp-pattern-1999-2008-noaa.jpg


Yes, I particularly enjoy how Hansen makes the Arctic so hot with no temperature readings to support them. One weather station in a 1,200 kilometer area. Wow, that's precision.

And you wonder why you've lost the argument.
 
...This is what equivilant global maps look like that that compare the published science regarding average annual temps now, and average annual temps at the height of the MWP.
(Courtesy of NOAA)
Medieval War Period
trakar-albums-agw-picture3532-temperature-pattern-mwp.gif

Current
trakar-albums-agw-picture3533-temp-pattern-1999-2008-noaa.jpg

Yes, I particularly enjoy how Hansen makes the Arctic so hot with no temperature readings to support them. One weather station in a 1,200 kilometer area. Wow, that's precision.

And you wonder why you've lost the argument.

Try again, the grey areas are not temp readings and are not included in either mapping. The least you could do is actually argue the data presented instead of making up idiocies that have nothing to do with what is being discussed.
 
A point here. Were India and China to suddenly lower their emissions, we would get an immediate, decade, spike in temperatures. This is the Faustian Bargain Dr. Hansen described so well.

True, as aerosols tend to settle/condense out of the atmosphere over about a decade's worth of time, whereas the nominal and unqualified atmospheric half-life (residence) for CO2 is measured in centuries.



Bullshit. CO2 residence time is between 5 and 16 years.


Essenhigh (2009) points out that the IPCC (Intergovernmental Panel on Climate Change) in their first report (Houghton et al., 1990) gives an atmospheric CO2 residence time (lifetime) of 50-200 years [as a "rough estimate"]. This estimate is confusingly given as an adjustment time for a scenario with a given anthropogenic CO2 input, and ignores natural (sea and vegetation) CO2 flux rates. Such estimates are analytically invalid; and they are in conflict with the more correct explanation given elsewhere in the same IPCC report: "This means that on average it takes only a few years before a CO2 molecule in the atmosphere is taken up by plants or dissolved in the ocean".

Some 99% of the atmospheric CO2 molecules are 12CO2 molecules containing the stable isotope 12C (Segalstad, 1982). To calculate the RT of the bulk atmospheric CO2 molecule 12CO2, Essenhigh (2009) uses the IPCC data of 1990 with a total mass of carbon of 750 gigatons in the atmospheric CO2 and a natural input/output exchange rate of 150 gigatons of carbon per year (Houghton et al., 1990). The characteristic decay time (denoted by the Greek letter tau) is simply the former value divided by the latter value: 750 / 150 = 5 years. This is a similar value to the ~5 years found from 13C/12C carbon isotope mass balance calculations of measured atmospheric CO2 13C/12C carbon isotope data by Segalstad (1992); the ~5 years obtained from CO2 solubility data by Murray (1992); and the ~5 years derived from CO2 chemical kinetic data by Stumm & Morgan (1970).

Revelle & Suess (1957) calculated from data for the trace atmospheric molecule 14CO2, containing the radioactive isotope14C, that the amount of atmospheric "CO2 derived from industrial fuel combustion" would be only 1.2% for an atmospheric CO2 lifetime of 5 years, and 1.73% for a CO2 lifetime of 7 years (Segalstad, 1998). Essenhigh (2009) reviews measurements of 14C from 1963 up to 1995, and finds that the RT of atmospheric 14CO2 is ~16 (16.3) years. He also uses the 14C data to find that the time value (exchange time) for variation of the concentration difference between the northern and southern hemispheres is ~2 (2.2) years for atmospheric 14CO2. This result compares well with the observed hemispheric transport of volcanic debris leading to "the year without a summer" in 1816 in the northern hemisphere after the 1815 Tambora volcano cataclysmic eruption in Indonesia in 1815.

Sundquist (1985) compiled a large number of measured RTs of CO2 found by different methods. The list, containing RTs for both 12CO2 and 14CO2, was expanded by Segalstad (1998), showing a total range for all reported RTs from 1 to 15 years, with most RT values ranging from 5 to 15 years. Essenhigh (2009) emphasizes that this list of measured values of RT compares well with his calculated RT of 5 years (atmospheric bulk 12CO2) and ~16 years (atmospheric trace 14CO2). Furthermore he points out that the annual oscillations in the measured atmospheric CO2 levels would be impossible without a short atmospheric residence time for the CO2 molecules.

Essenhigh (2009) suggests that the difference in atmospheric CO2 residence times between the gaseous molecules 12CO2 and 14CO2 may be due to differences in the kinetic absorption and/or dissolution rates of the two different gas molecules.

With such short residence times for atmospheric CO2, Essenhigh (2009) correctly points out that it is impossible for the anthropogenic combustion supply of CO2 to cause the given rise in atmospheric CO2. Consequently, a rising atmospheric CO2 concentration must be natural. This conclusion accords with measurements of 13C/12C carbon isotopes in atmospheric CO2, which show a maximum of 4% anthropogenic CO2 in the atmosphere (including any biogenic CO2), with 96% of the atmospheric CO2 being isotopically indistinguishable from "natural" inorganic CO2 exchanged with and degassed from the ocean, and degassed from volcanoes and the Earth's interior (Segalstad, 1992).

Essenhigh, R.E. 2009: Potential dependence of global warming on the residence time (RT) in the atmosphere of anthropogenically sourced carbon dioxide. Energy & Fuels 23: 2773-2784.

Houghton, J.T., Jenkins, G.J. & Ephraums, J.J. (Eds.) 1990: Climate Change. The IPCC Scientific Assessment. Intergovernmental Panel on Climate Change. Cambridge University Press, Cambridge: 365 pp.

Murray, J.W. 1992: The oceans. In: Butcher, S.S., Charlson, R.J., Orians, G.H. & Wolfe, G.V. (Eds.): Global biogeochemical cycles. Academic Press: 175-211.

Revelle, R. & Suess, H. 1957: Carbon dioxide exchange between atmosphere and ocean and the question of an increase of atmospheric CO2 during past decades. Tellus 9: 18-27.

Segalstad, T. V. 1982: Stable Isotope Analysis. In: Stable Isotopes in Hydrocarbon Exploration, Norwegian Petroleum Society 6904, Stavanger: 21 pp. Available at: http://www.co2web.info/STABIS-ANAL.pdf

Segalstad, T. V. 1992: The amount of non-fossil-fuel CO2 in the atmosphere. AGU Chapman Conference on Climate, Volcanism, and Global Change. March 23-27, 1992. Hilo, Hawaii. Abstracts: 25; and poster: 10 pp. Available at: http://www.co2web.info/hawaii.pdf

Segalstad, T. V. 1996: The distribution of CO2 between atmosphere, hydrosphere, and lithosphere; minimal influence from anthropogenic CO2 on the global "Greenhouse Effect". In Emsley, J. (Ed.): The Global Warming Debate. The Report of the European Science and Environment Forum. Bourne Press Ltd., Bournemouth, Dorset, U.K. [ISBN 0952773406]: 41-50. Available at: http://www.co2web.info/ESEFVO1.pdf

Segalstad, T. V. 1998: Carbon cycle modelling and the residence time of natural and anthropogenic atmospheric CO2: on the construction of the "Greenhouse Effect Global Warming" dogma. In: Bate, R. (Ed.): Global warming: the continuing debate. ESEF, Cambridge, U.K. [ISBN 0952773422]: 184-219. Available at: http://www.co2web.info/ESEF3VO2.pdf

Solomon, S., Plattner, G.-K., Knutti, R. & Friedlingstein, P. 2009: Irreversible climate change due to carbon dioxide emissions. Proceedings of The National Academy of Sciences of the USA [PNAS] 106, 6: 1704-1709.

Stumm, W. & Morgan, J.J. 1970: Aquatic chemistry: an introduction emphasizing chemical equilibria in natural waters. Wiley-Interscience: 583 pp.

Sundquist, E.T. 1985: Geological perspectives on carbon dioxide and the carbon cycle. In: Sundquist, E.T. & Broecker, W.S. (Eds.): The carbon cycle and atmospheric CO2: natural variations Archean to present. American Geophysical Union, Geophysical Monograph 32: 5-59.
 
...This is what equivilant global maps look like that that compare the published science regarding average annual temps now, and average annual temps at the height of the MWP.
(Courtesy of NOAA)
Medieval War Period
trakar-albums-agw-picture3532-temperature-pattern-mwp.gif

Current
trakar-albums-agw-picture3533-temp-pattern-1999-2008-noaa.jpg

Yes, I particularly enjoy how Hansen makes the Arctic so hot with no temperature readings to support them. One weather station in a 1,200 kilometer area. Wow, that's precision.

And you wonder why you've lost the argument.

Try again, the grey areas are not temp readings and are not included in either mapping. The least you could do is actually argue the data presented instead of making up idiocies that have nothing to do with what is being discussed.


My apologies, I did a quick look and assumed it was the usual Hansen BS graph. Upon closer looking I see the Arctic is removed. However, it is still using the Hansen falsified data and using the reduced number of weather stations and those that are used are almost wholly in urban areas thus benefitting from the UIA effect. So yes, the graph is still useless.
 
CO2 is now the primary driver because we have dealt with non-CO2 GHG emissions by reducing them. There's absolutely nothing that is inconsistent with his view now and then.

What happened to the 50 or 200 year lag in the EFFECTs of altering GHGs? You want to ignore that now when it's convienient? If we've been successful in reducing NOx and SOx for instance, their effect on Ocean Acidification might not be measureable for another 50 years... So -- is the current slowing of temp rise due to our reduction of "the other" GHGs?

Link for your 50 to 200 years?

I'm not talking about simple atmospheric retention times here. I'm referring to the TOTAL effects of their release like Ocean Acidification.. I gave you a chart a couple days ago showing the OA scenario assuming a CO2 spike for the next 50 yrs (and then I guess the modeller assumed mankind would go nuclear). THe OA effect is there for a 100 years.

Since a large fraction of man-emitted CO2 is ABSORBED by the ocean and that effect is TEMPORARY until the ocean belches it back up, that is not considered in studies of atmospheric lifetimes.

I don't rely on Wiki much but I know that BobGNote got everything he knows from there so...

Greenhouse gas - Wikipedia, the free encyclopedia
[
QUOTE]Carbon dioxide has a variable atmospheric lifetime, and cannot be specified precisely.[21] The atmospheric lifetime of CO2 is estimated of the order of 30–95 years.[22] This figure accounts for CO2 molecules being removed from the atmosphere by mixing into the ocean, photosynthesis, and a few other processes. However, this excludes the balancing fluxes of CO2 into the atmosphere from the geological reservoirs, which have slower characteristic rates.[23] While more than half of the CO2 emitted is currently removed from the atmosphere within a century, some fraction (about 20%) of emitted CO2 remains in the atmosphere for many thousands of years.[24][25][26]
[/QUOTE]

That MIGHT be accurate.. Who knows? But I've SEEN estimates for NOx residing in the atmosphere for a 100 years. In fact -- the chart below that quote in the Wiki shows the lifetime of NOx to be 114 yrs!!!!

Point was -- I was talking about EFFECTS, not atmo concentrations.

flacaltenn-albums-charts-picture4525-ocacid-image001.jpg


Maybe in some cases ---- 500 years..

BTW: Note in the OA scenario above the 100 year LAG for pCO2 to really build...


:eek:
 
Last edited:
..As for the accuracy of the projection senario graphs he displayed at that congressional testimony, if anything, even the worst-case senario has proven to underestimate what we have actually seen happen over the last 24 years.

Really? Do tell. Show us any empirical data that supports that assertion. And please, use the UNALTERED (i.e. falsified) historical temperature data.

No problem, the chart you seek, is I believe fig. 3 in the Hansen paper and worst case senario is Senario A. it seems to indicate that 1986 was the last observation data included in his '88 paper. This indicates a 0.4º C above the 1951-1980 mean in 1986 and senario A projects out to 2010 at about 1º C above the 1951-1980 mean, which looks like about 0.6º C rise

http://data.giss.nasa.gov/gistemp/graphs_v3/Fig.A2.txt

indicates average mean anomaly of 1986 is 0.12 average mean anomaly of 2010 is 0.62 which looks like an actual rise of only about 0.5º C rise since 1986.

It looks like I was mistaken, Hansen's 1988 worst case senario exceeded reality by 0.08º C. I apologize for my previous mischaracterization. I don't consider this egregious as year to year variations are often in the ~0.1º C range, but it is definitely lower than Hansen's 1988 considertions. It seems that the 1988 senario utilized a slightly high fast response sensitivity for climate (4.2º C/CO2 doubling I believe), currently short-term doubling is estimated at between 3.0-3.5º C by many researchers. I believe this is the same range of sensitivity that Hansen began using around 2000 in his modellings. It will be interesting to see how the 1988 set of senarios hold up as we approach climatically significant timeframes (1988 + 30 = 2018). Of course it is important to understand that even within that '88 paper, Hansen stated that these modelled simulations aren't precise predictions nor intended to be used as anything other than general guides of what should be expected given the parameters and understandings that the models are based upon.


I believe I SPECIFICALLY said that falsified data is not allowed. You got reading problems?

Show us the ORIGINAL UNALTERED tabulations if you wish to use this data set.
 
Really? Do tell. Show us any empirical data that supports that assertion. And please, use the UNALTERED (i.e. falsified) historical temperature data.

I know of no falsified historical temperature data, if you believe any temperature data sets used by any major climate research group to be falsified please present the evidence that compellingly supports this belief.
 
A point here. Were India and China to suddenly lower their emissions, we would get an immediate, decade, spike in temperatures. This is the Faustian Bargain Dr. Hansen described so well.

True, as aerosols tend to settle/condense out of the atmosphere over about a decade's worth of time, whereas the nominal and unqualified atmospheric half-life (residence) for CO2 is measured in centuries.

Bullshit. CO2 residence time is between 5 and 16 years...

Your references aren't examining what we are talking about. My words have specfic meanings and are chosen to reflect those precise meanings.

"CO2 and Climate"
A 1956 American Scientist paper
http://afil.tamu.edu/Readings 2012/CO2 and Climate.pdf

"...Although the carbon dioxide theory of climatic change was one of the most widely held fifty years ago, in recent years it has had relatively few adherents. However, recent research work suggests that the usual reasons for rejecting this theory are not valid. Thus it seems appropriate to reconsider the question of variations in the amount of carbon dioxide in the atmosphere and whether it can satisfactorily account for many of the worldwide climatic changes...
...The carbon dioxide theory was first proposed in 1861 by Tyndall. The first extensive calculations were necessarily done by very approximate methods. There are thousands of spectral lines due to carbon dioxide which are responsible for the absorption and each of these lines occurs in a complicated pattern with variations in intensity and the width of the spectral lines. Further the pattern is not even the same at all heights in the atmosphere, since the width and intensity of the spectral lines varies with the temperature and pressure. Only recently has a reasonably accurate solution to the problem of the influence of carbon dioxide on surface temperature been possible, because of accurate infrared measurements, theoretical developments, and the availability of a highspeed electronic computer.
...Recently, however, man has added an important new factor to the carbon dioxide balance. As first pointed out by Callendar, the combustion of fossil fuels is adding 6.0 x 10^9 tons per year of carbon dioxide to the atmosphere at the present time and the rate is increasing every year. Today this factor is larger than any contribution from the inorganic world. Thus today man by his own activities is increasing the carbon dioxide in the atmosphere at the rate of 30 per cent a century. The possible influence of this on the climate will be discussed later.
...Kulp has recently shown from radiocarbon determination that the deep ocean waters at the latitude of Newfoundland were at the surface 1,700 years ago. This suggests that it may take tens of thousands of years for the waters of the deep ocean to make one complete circuit from the surface to the bottom and back. Only the surface waters of the oceans can absorb carbon dioxide directly from the atmosphere. Since there is very little circulation between the surface waters and the ocean depths, the time for the atmosphere-ocean system to return to equilibrium following a disturbance of some sort is at least as long as the turnover time of the oceans. Thus, if the atmospheric carbon dioxide amount should suddenly increase, it may easily take a period of tens of thousands of years before the atmosphere-ocean system is again in equilibrium..."

"Atmospheric lifetime of fossil-fuel carbon dioxide"
ORBi: ORBi User License

"CO2 released from combustion of fossil fuels equilibrates between the various carbon reservoirs of the atmosphere, the ocean, and the terrestrial biosphere on time scales of a few centuries. However, a sizeable fraction of the CO2 remains in the atmosphere, awaiting a return to the solid earth by much slower weathering processes and deposition of CaCO3. Common measures of atmospheric CO2 lifetime, including the e-folding time
scale, disregard the long tail. Its neglect in the calculation of global warming potentials leads many to underestimate the longevity of anthropogenic global warming. Here we review the past literature on the atmospheric lifetime of fossil fuel CO2 and its impact on climate, and we present initial results from a model intercomparison project on this topic. The models agree that 20-35% of the CO2 remains in the atmosphere after equilibration
with the ocean (2-20 centuries). Neutralization by CaCO3 draws the airborne fraction down further on time scales of 3-7 kyr."

"Is Shale Gas Good for Climate Change?"
http://cewc.colostate.edu/wp-content/uploads/2012/05/Is-Shale-Gas-Good-for-Climate-Change_Schrag.pdf

"...Another important timescale is the residence time of carbon dioxide in the atmosphere. Once carbon dioxide is emitted from the combustion of fossil fuel, it is transferred among atmospheric, terrestrial, oceanic, and sedimentary reservoirs by a wide variety of biogeochemical processes that convert carbon dioxide to organic carbon, dissolved bicarbonate ion, or calcium carbonate, and then back again. The rates of these processes determine how long carbon resides in each reservoir, and how long it will take to bring the elevated concentrations of carbon dioxide in the atmosphere back to pre-industrial levels. There are also longer timescales in the carbon cycle. Over the timescale of several thousand years, once ocean equilibration is complete and only 20 to 40 percent of cumulative emissions remain in the atmosphere, dissolution of carbonate rocks on land and on the ocean floor will further reduce the airborne fraction to 10 to 25 percent, over a range of several thousand years to ten thousand years. This remnant of anthropogenic carbon dioxide emissions will stay in the atmosphere for more than one hundred thousand years, slowly drawn down by silicate weathering that converts the carbon dioxide to calcium carbonate, as well as by slow burial of organic carbon on the ocean floor.16 The size of this “tail” of anthropogenic carbon dioxide depends on the cumulative emissions of carbon dioxide, with higher cumulative emissions resulting in a higher fraction remaining in the atmosphere..."

"The millennial atmospheric lifetime of anthropogenic CO2"
Climatic Change, Volume 90, Number 3 - SpringerLink

"The notion is pervasive in the climate science community and in the public at large that the climate impacts of fossil fuel CO2 release will only persist for a few centuries This conclusion has no basis in theory or models of the atmosphere/ocean carbon cycle, which we review here. The largest fraction of the CO2 recovery will take place on time scales of centuries, as CO2 invades the ocean, but a significant fraction of the fossil fuel CO2, ranging in published models in the literature from 20–60%, remains airborne for a thousand years or longer. Ultimate recovery takes place on time scales of hundreds of thousands of years, a geologic longevity typically associated in public perceptions with nuclear waste. The glacial/interglacial climate cycles demonstrate that ice sheets and sea level respond dramatically to millennial-timescale changes in climate forcing. There are also potential positive feedbacks in the carbon cycle, including methane hydrates in the ocean, and peat frozen in permafrost, that are most sensitive to the long tail of the fossil fuel CO2 in the atmosphere."

many, many more references available that actually support what I am saying rather than simply being unrelated copy and pastes out of the references section of paper that itself isn't suportive of the thesis it is offered for.
 
Last edited:
I know of no falsified historical temperature data, if you believe any temperature data sets used by any major climate research group to be falsified please present the evidence that compellingly supports this belief.


Goddard does the best job of showing the data corruption. I know you won't bother to read them as unethical behavior is A-OK to you if it helps your goals, but the rest of the folks will care.

Hansen : Hiding The Decline In Greenland | Real Science


GISS Temperature Trend Is Complete Garbage | Real Science
 

Forum List

Back
Top