Hansen says CO2 is NOT the prime driver in this paper

Earth to Wienerbitch! Your shit about how CO2 persists in the atmosphere for a limited time is completely irrelevant, which is usual for yours and other bitch-media. CO2 exchanges, from the atmosphere, to water, where it participates in the carbonic acid exchange and kills organisms and habitat.


Sorry guy, but there isn't a shred of evidence of either flora or fauna dying as a result of CO2 exchanging from the air to the water. I am sure that you believe it is so, but alas, not a shred of hard evidence exists to support your claim.

No evidence, except how your head is up your ass. Let's go back to the swell graph Fatass loaded, since it shows CO2 concentrations, back about 430,000 years or so, conveniently plotted against temperature rises and falls, so anybody with brain 1 instead of half a demented mind can see, how the CO2 levels out, to force both peaks and troughs, in temperature, to fall or rise, to shift equilibrium, at limits.

Interesting how you guys like to go deeper back into the ice age and claim that CO2 levels were low. Try going back to where the last ice age began and try explaining how the earth went into an ice age with atmospheric CO2 levels at or above 1000ppm.

CO2 increases as it warms and guess what, we are in the process of exiting an ice age. Look at paleohistory. Time and time again the earth has entered ice ages and then warmed till such time as no ice exists at one, or both poles. What we are experiencing is the norm, not some catastrophy called upon us by the internal combustion engine.

420,000 years. That isn't even an eyeblink in geological time.

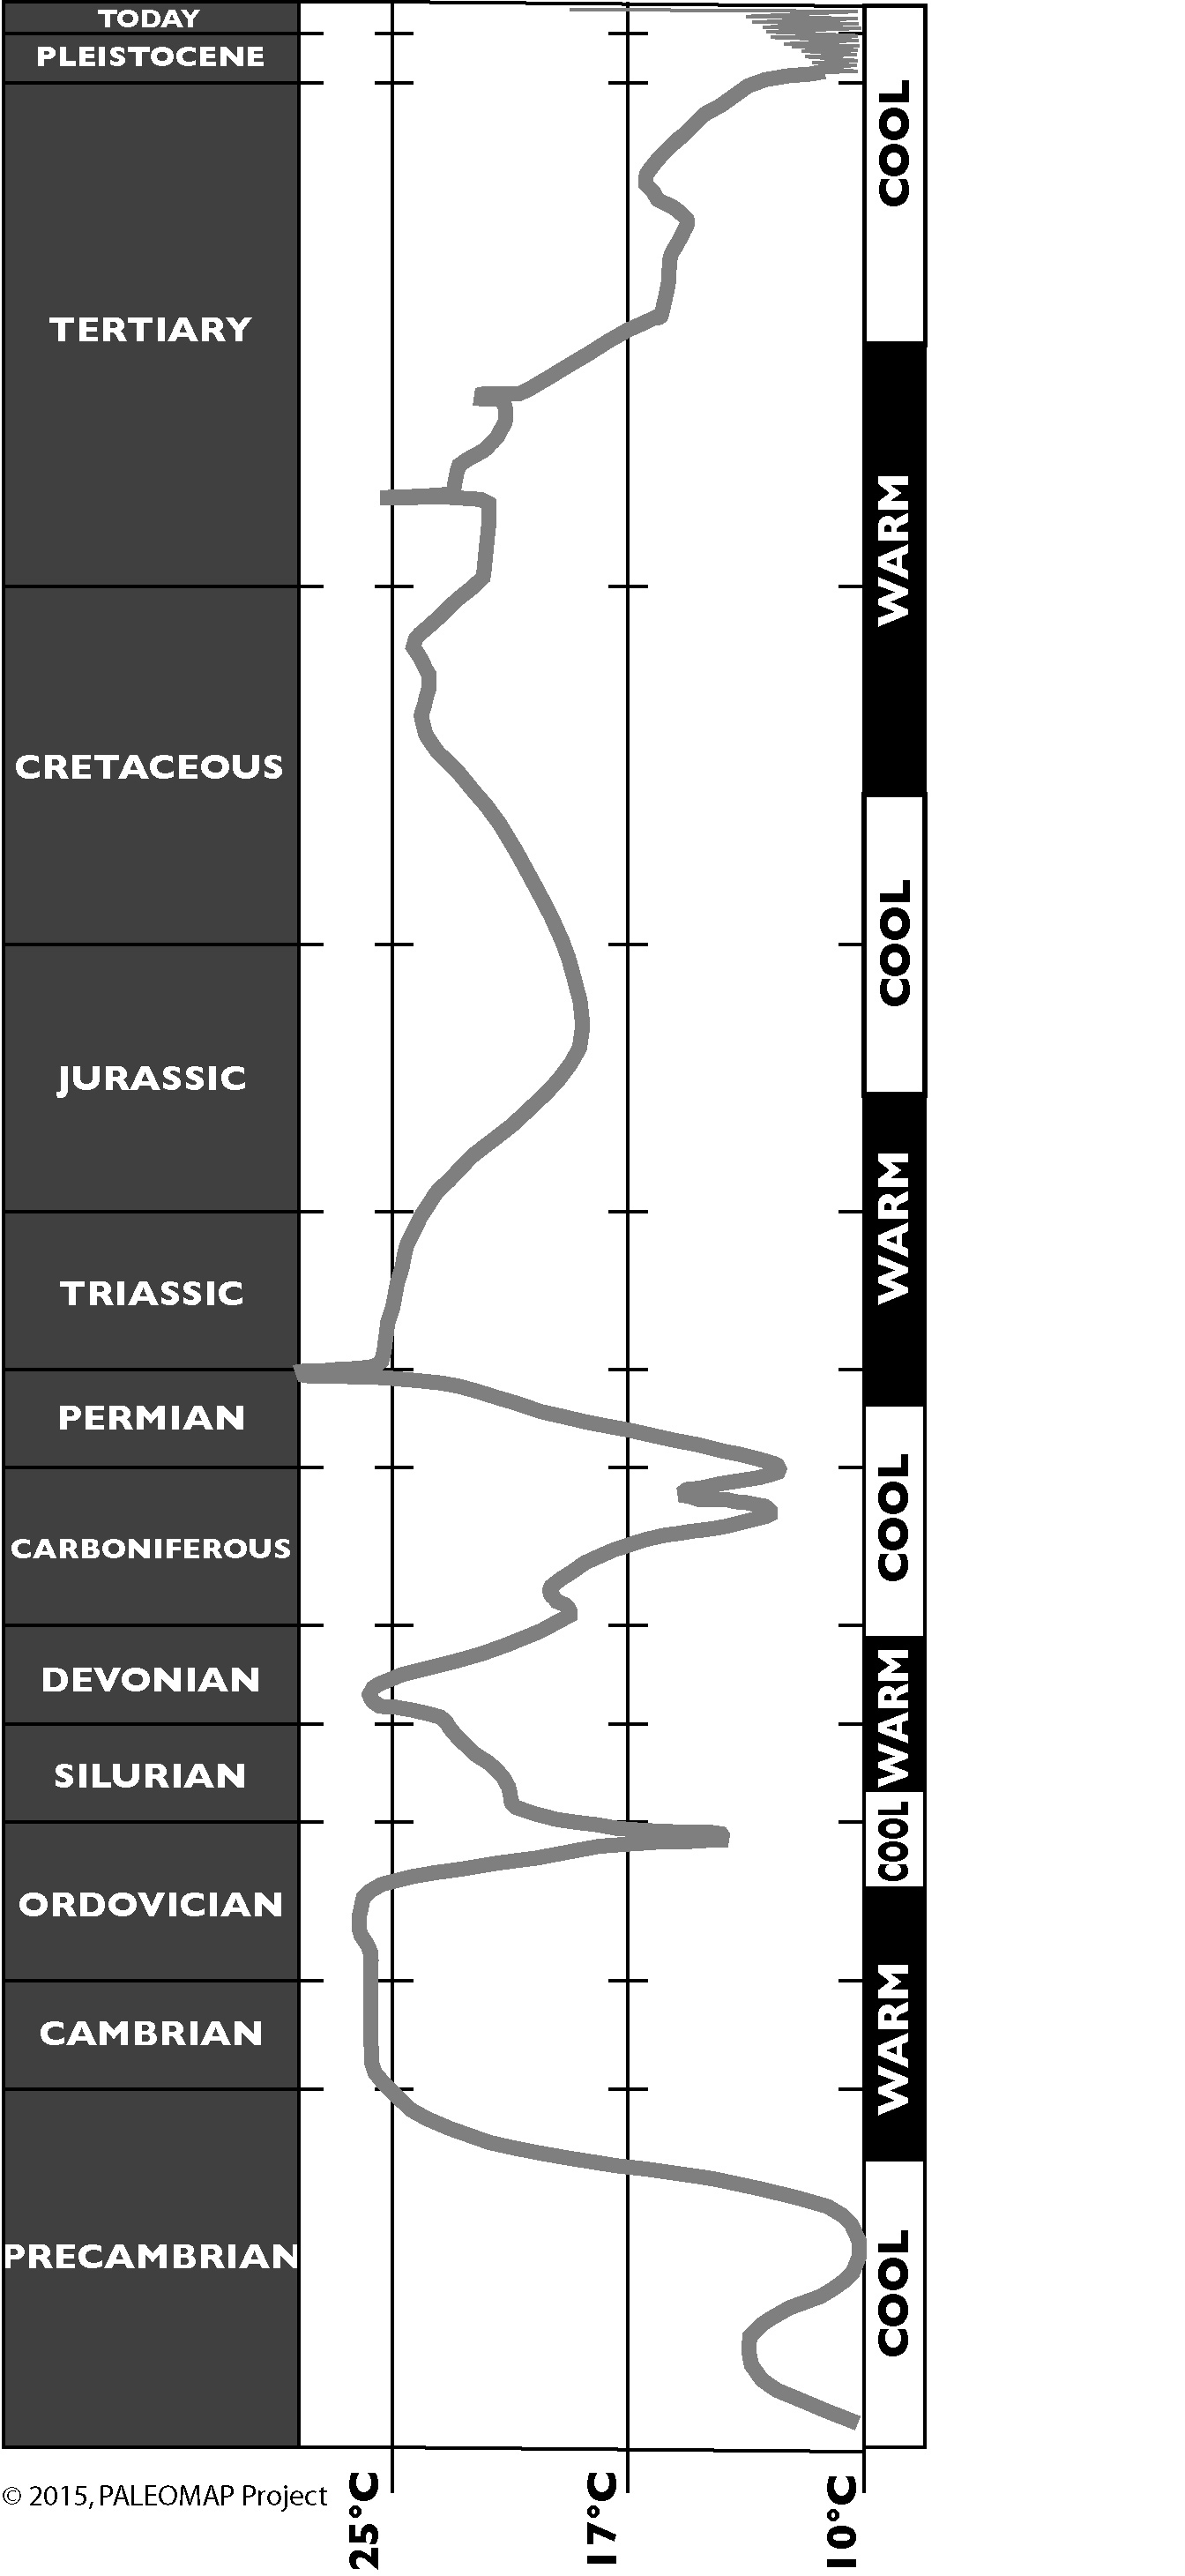
This is what the earth's climate history looks like. Take a good long look and tell me what you believe is out of the ordinary here. Obviously, the earth is going to continue to warm until such time as the temperature reaches a mean of about 25C at which time once more, there will be no ice, anywhere. It is how the cycles go and like it or not, we are just along for the ride.

globaltemp.jpg


Your image isn't loading Wienerbitch. And you aren't looking at Fatski's graph, very closely. A consistent forcing relationship exists, where CO2 levels off, at 180 ppm at troughs, and at 280 ppm at peaks, to force temperature either up or down. This is unbroken, except for presently, when CO2 shot up, to 400 ppm, and we have yet to experience all adjustments to that or the methane emissions.

Damn, you sure a stupid!

flacaltenn-albums-charts-picture4539-co2record.jpg


Did you look, this time? Now reload your image, and I'll look at it.
 
When you Faithers finally decide which of four different things CO2 is supposed to do, let us know.
 
No problem, the chart you seek, is I believe fig. 3 in the Hansen paper and worst case senario is Senario A. it seems to indicate that 1986 was the last observation data included in his '88 paper. This indicates a 0.4º C above the 1951-1980 mean in 1986 and senario A projects out to 2010 at about 1º C above the 1951-1980 mean, which looks like about 0.6º C rise

I guess you are unaware of what GISS has been doing to the temperature record of the past. Here are just a few examples:

6a010536b58035970c0162fc38ff8b970d-400wi
6a010536b58035970c0162fc3900c3970d-400wi


6a010536b58035970c013488be7615970c-pi


6a010536b58035970c0128759ee244970c-pi


6a010536b58035970c013488be5493970c-pi


6a010536b58035970c0133f5f75b18970b-pi


It looks like I was mistaken,

You were mistaken alright. Your fist mistake was assuming that the record was honest. Tell me, considering that GISS has been caught blatantly altering the record of the past in an effort to create the appearance of warming in the present, do you still trust them?


He's aware. He just doesn't care. He is either unethical or intellectually dishonest. I havn't figured out which one yet.
 
It seems that way back in the year 2000 (my how time flies) Dr. Hansen co-authored a paper that attributed the warming to pollution and not CO2. Shocker of shockers. And it was published in olfrauds fav PNAS.

Rather than attempting to improperly parse the abstract, why not look at the contextual understandings provided by the actual text of the research paper?

"Global warming in the twenty-first century: An alternative scenario" - http://pubs.giss.nasa.gov/docs/2000/2000_Hansen_etal_2.pdf

The global surface temperature has increased by about 0.5°C since 1975 (1, 2), a burst of warming that has taken the global temperature to its highest level in the past millennium (3). There is a growing consensus (4) that the warming is at least in part a consequence of increasing anthropogenic greenhouse gases (GHGs).
GHGs cause a global climate forcing, i.e., an imposed perturbation of the Earth’s energy balance with space (5). There are many competing natural and anthropogenic climate forcings, but increasing GHGs are estimated to be the largest forcing and to result in a net positive forcing, especially during the past few decades (4, 6). Evidence supporting this interpretation is provided by observed heat storage in the ocean (7), which is positive and of the magnitude of the energy imbalance estimated from climate forcings for recent decades (8)...

...Climate forcing by CO2 is the largest forcing, but it does not dwarf the others (Fig. 1). Forcing by CH4 (0.7 Wym2) is half as large as that of CO2, and the total forcing by non-CO2 GHGs (1.4Wym2) equals that of CO2. Moreover, in comparing forcings
(...)

of course it is important to realize that Dr Hansen's considerations took place back pre-2000 in an era when our planetary CO2 emissions were significantly lower than they currently are. If we had been prepared to act decisively and aggressively to tackle climate change back 12+ years ago, the more gradualist approach suggested by Hansen in this post, might well have had a shot at producing some good results, after a decade where the rate of emission increase has more than doubled it seems much more a case of wishful thinking on the part of Dr Hansen.


Whatever it is we did 10 years ago seems two be working.

Regardless of the increase in the non-water vapor GHG's, the temperature of the climate seems to have stalled in its increase.

When asked about Grant's drinking, Lincoln pondered distributing the same booze to all of his generals.

http://reasonabledoubtclimate.files.wordpress.com/2011/08/rss2002-2011.png
http://reasonabledoubtclimate.files.wordpress.com/2011/08/hadcrut2002-2011.png
 
Sad fact is that the "alarmists" have been shown to be way to optimistic. We are far past prevention now, the best we can do is preparation for consequences.


And the consequences are what?

I love it when we start writing the science fiction movies.
 
The human body undergoes a 20 degree swing IN A SINGLE day from morning to night. You really think a one degree rise is going to be noticed? Really?:cuckoo:

Are you really naive enough to believe that the change of global average temperature is only going to raise the air temperature where you are at by about 1 degree and that this is the only consequence of planetary Climate change? seriously?!


I grew up in Northern Minnesota.

Raising the temperature by a degree sounds pretty good to me.

The temperature seems to have stalled for the last ten years.

Is there a program of dire consequence for the climate to stall at the very hot level we currently enjoy?


Dr. James Hansen on Global Warming.......


"not by the products of fossil fuel burning, CO2 and aerosols, the positive and negative climate forcings of which are partially offsetting"


Game, Set, MATCH!

Not so fast there Con-Man.. Unfortunately, we were doing a SPECTACULAR job of cleaning up the aerosols part of that thru the 2000 period. So the "offsetting" was largely off'd..

Perhaps we should have left well enough alone. Trying to help folks breathe in Pittsburgh might have put the earth in a lurch..
:eusa_angel:


The aerosols, I thought, were the cause of the Ozone hole over the South Pole. This is the thing that is now closing on a regular basis and may have been doing so at that time also.

Do these also have an effect on GHG's?
 
I can dig up any amount of paleo climate and written history from many periods in mans history when there was greater warming than there is today and not one of the terrible things you all claim will happen ever did.

Please do (dig them up, that is), the best available evidence indicates that today's annual, globally averaged temperature, is warmer than any period in the last several million years. Modern humans have only existed for a few hundred thousand years. Given this, you are either looking at early, incomplete and inaccurate temperature data, or you have some revolutionary information regarding human evolution up your sleeve,...either way, I'd be interested in seeing any evidences you feel compellingly support your assertions.

You have tried so desperately to remove the RWP and the MWP from the historical record but sadly for you there are still people out there who read real books and they know the lies for what they are.

You are failing on an epic scale and it's going to be fun to watch the wheels come off.

There may have been some regionally warm times associated with the RWP and there was definitely broader regional warming during the MWP, but neither of these seem to have been anything like the scale and magnitude of the current global warming.


You are comparing the readings of instruments of today with the readings of proxies of the past.

It's not much different from comparing the readings of a tuning fork to the readings of a fishing line.

We have reliable instrument readings, that is to say, satellite, for about 40 years.

The ground station readings are incomplete and they have been constantly revised which reveals that they are completely unreliable. The are unreliable at least by the standards of those who hope to use the data.

All of that said, according to the proxies, the global climate has cooled by about 6 degrees over the last 5 million years.

File:Five Myr Climate Change Rev.png - Global Warming Art
 
Rather than attempting to improperly parse the abstract, why not look at the contextual understandings provided by the actual text of the research paper?

"Global warming in the twenty-first century: An alternative scenario" - http://pubs.giss.nasa.gov/docs/2000/2000_Hansen_etal_2.pdf


of course it is important to realize that Dr Hansen's considerations took place back pre-2000 in an era when our planetary CO2 emissions were significantly lower than they currently are. If we had been prepared to act decisively and aggressively to tackle climate change back 12+ years ago, the more gradualist approach suggested by Hansen in this post, might well have had a shot at producing some good results, after a decade where the rate of emission increase has more than doubled it seems much more a case of wishful thinking on the part of Dr Hansen.


He wrote the paper 12 years after his now famous testimony before Congress where he laid out his famous three graphs showing what would happen with ever increasing CO2 levels. Remember? Scenario's A, B, and of course C. Even with the CO2 levels increasing FAR above even his worst guestimate the temps havn't come even close to his worst case scenario...in fact they havn't even come close to his BEST case scenario.

I think he realised he was wrong and was actually doing some good science there. Then all of a sudden the TEAM got into positions of power and voila, climatology entered the realm of the psychics.


CO2 is now the primary driver because we have dealt with non-CO2 GHG emissions by reducing them. There's absolutely nothing that is inconsistent with his view now and then.


Another constant is that he's wrong.

Ignore the facts. Facts can change. His opinions will never change.
 
He wrote the paper 12 years after his now famous testimony before Congress where he laid out his famous three graphs showing what would happen with ever increasing CO2 levels. Remember? Scenario's A, B, and of course C. Even with the CO2 levels increasing FAR above even his worst guestimate the temps havn't come even close to his worst case scenario...in fact they havn't even come close to his BEST case scenario...

Congressional testimony in 1988, given that it usually takes around a year after completing a paper for it to actually appear in a Journal, you generally quit looking at new data for a paper once you begin writing the paper, and when working with co-authors the actual writing of the paper can take anywhere from a few months to a year and this paper was published in the year 2000, he more than likely started writing this paper within a decade of his congressional testimony - but that is a minor quibble.

As for the accuracy of the projection senario graphs he displayed at that congressional testimony, if anything, even the worst-case senario has proven to underestimate what we have actually seen happen over the last 24 years.


Given that the lowest temperature rise predicted in Hansen's 1988 testimony relied on a decrease in the concentration of CO2 and that the actual performance of the climate has underperformed that prediction, you are simply wrong.

CO2 has risen at a pace that should have supported his highest prediction of temperature increase. The actual increase is half of what he predicted and is what would be expected if the increase of temperature since 1600 ad had continued at the same pace absent the influence of CO2.

The fact that the temperature started its increase from the coldest point of the the Little Ice Age about 250 years before the start of the Industrial Revolution notwithstanding, Hansen predicted a rise to date of about 1 degree and we have experienced a rise to date of about a half a degree.

His prediction misses by 100%.

Is that success?

What do we learn from James Hansen's 1988 prediction?
 
None of the data is falsified, if you believe it to be then you must supply cmpelling evidence in support of that contenion.

Of course it has been falsified and the compelling evidence is in the post directily above this one.

I don't know where you stand on sea level rise but just for fun, here is a short animation that is priceless for those wackos out there who believe the sea is going to swamp us all. It is a 140 year photographic record of dangerous sea level rise at a point of rock in La jolla, California:

6a010536b58035970c01676482977e970b-800wi


I've been challenging all of the Sea Level is rising chicken Littles to post the photographic evidence of the Sea Level rise.

This seems pretty conclusively to undermine what the chicken littles are saying.

Have any of the warmers got photo evidence that proves their case?
 
Stop looking at data once you start writing your paper? No, you update your graphs and make sure you still have a valid model. Unless you don't have a valid model and just want the money and attention.
 
Of course it has been falsified and the compelling evidence is in the post directily above this one.

I don't know where you stand on sea level rise but just for fun, here is a short animation that is priceless for those wackos out there who believe the sea is going to swamp us all. It is a 140 year photographic record of dangerous sea level rise at a point of rock in La jolla, California:

6a010536b58035970c01676482977e970b-800wi

I've been challenging all of the Sea Level is rising chicken Littles to post the photographic evidence of the Sea Level rise.

This seems pretty conclusively to undermine what the chicken littles are saying.

Have any of the warmers got photo evidence that proves their case?[/QUOTE]

Here is a link or two, for you to review. You didn't mark high or low-tide, in your swell photos, for reference, so as usual, your head is way up your asshole.

Global warming and sea levels

Warming ocean = rising ocean?

After the last ice age, the rapid melting of glaciers rapidly raised sea level. That melting tapered off about 6,000 years ago, and sea level -- compared to land -- became fairly stable. However, over the past century, sea level over much of the United States has risen by 25 to 30 centimeters relative to land, according to Jim Titus, the Environmental Protection Agency's project manager on sea level rise. Even that figure is a guesstimate, Titus says. "We only know that sea level last century rose more than average over the last several thousand years."

http://www.nytimes.com/2012/03/14/s...sing-sea-levels-a-risk-to-coastal-states.html

Green Blog: Weighing the Risk of Sea-Level Rise (March 14, 2012)
Times Topic: Global Warming & Climate Change

About 3.7 million Americans live within a few feet of high tide and risk being hit by more frequent coastal flooding in coming decades because of the sea level rise caused by global warming, according to new research.

If the pace of the rise accelerates as much as expected, researchers found, coastal flooding at levels that were once exceedingly rare could become an every-few-years occurrence by the middle of this century.

By far the most vulnerable state is Florida, the new analysis found, with roughly half of the nation’s at-risk population living near the coast on the porous, low-lying limestone shelf that constitutes much of that state. But Louisiana, California, New York and New Jersey are also particularly vulnerable, researchers found, and virtually the entire American coastline is at some degree of risk.

------------------------------

It seems skeptics of global warming are chronic sufferers, of HUB (head up butt), CRS (can't remember shit), and DKS (don't know shit) syndromes. Then there's that speed-freak, skooks, who shoots up a bag of meth, then he comes over to USMB and pretends his tweaks are somehow related to impending methane proliferation.

1. At every single peak, in the last 450,000 years, CO2 peaks out, at 280 ppm, and then declines, to force cooling. But humans have pushed CO2 all the way, to 400 ppm, by defoliation and emissions, including poisonous pollution;
2. More CO2 and methane will be released, by warming waters and lands, around the world, but particularly from Arctic tundra and seafloor areas;
3. The CO2 will cause bodies of water to acidify, killing animals;
4. The seas will rise, as the planet warms, and shelf ice melts, which is happening, faster than ever, in a runaway warming scenario, currently unfolding;
5. Volcanoes and seismic events may be expected, before cooling is forced.

What part of currently unfolding events are so difficult, for even a retard to witness?


You want to show high and low tide, for both your photos, CodeDogshit? Reference your awesome, entertaining dogshit.
 
Last edited:
He wrote the paper 12 years after his now famous testimony before Congress where he laid out his famous three graphs showing what would happen with ever increasing CO2 levels. Remember? Scenario's A, B, and of course C. Even with the CO2 levels increasing FAR above even his worst guestimate the temps havn't come even close to his worst case scenario...in fact they havn't even come close to his BEST case scenario...

Congressional testimony in 1988, given that it usually takes around a year after completing a paper for it to actually appear in a Journal, you generally quit looking at new data for a paper once you begin writing the paper, and when working with co-authors the actual writing of the paper can take anywhere from a few months to a year and this paper was published in the year 2000, he more than likely started writing this paper within a decade of his congressional testimony - but that is a minor quibble.

As for the accuracy of the projection senario graphs he displayed at that congressional testimony, if anything, even the worst-case senario has proven to underestimate what we have actually seen happen over the last 24 years.


Given that the lowest temperature rise predicted in Hansen's 1988 testimony relied on a decrease in the concentration of CO2 and that the actual performance of the climate has underperformed that prediction, you are simply wrong.

CO2 has risen at a pace that should have supported his highest prediction of temperature increase. The actual increase is half of what he predicted and is what would be expected if the increase of temperature since 1600 ad had continued at the same pace absent the influence of CO2.

The fact that the temperature started its increase from the coldest point of the the Little Ice Age about 250 years before the start of the Industrial Revolution notwithstanding, Hansen predicted a rise to date of about 1 degree and we have experienced a rise to date of about a half a degree.

His prediction misses by 100%.

Is that success?

What do we learn from James Hansen's 1988 prediction?

Although your link says the misstatement as of 1998 was 25% -- it's a higher error now!.. So I don't care WHO mistestified in front of congress in 1998.. We learned something important about "assumptions" and climate sensitivity.

And that when the PRESS REPORTED hansens predictions in 1988, the screaming headline was for the RANGE of scenarios and the hysteria became "Scientists project up to a 2DegC rise in temp per decade".. And the funding feeding frenzy (fff) began....

Whatever, Fatass. Since 1981, the 20 warmest years on record occurred. The ten warmest years in the meteorological record occurred, since 2000. We are 24 years, down the road, from Hansen's 1988 predictions. Get over your old doggy-toy. Here's fresh kibbles:

NASA - NASA Finds 2011 Ninth-Warmest Year on Record

The global average surface temperature in 2011 was the ninth warmest since 1880, according to NASA scientists. The finding continues a trend in which nine of the 10 warmest years in the modern meteorological record have occurred since the year 2000.

NASA's Goddard Institute for Space Studies (GISS) in New York, which monitors global surface temperatures on an ongoing basis, released an updated analysis that shows temperatures around the globe in 2011 compared to the average global temperature from the mid-20th century. The comparison shows how Earth continues to experience warmer temperatures than several decades ago. The average temperature around the globe in 2011 was 0.92 degrees F (0.51 C) warmer than the mid-20th century baseline.

--------------------------------

Let's go over the latest hockey-stick graph. Notice how CO2 and warming are both on a sharp upswing, indicating related acceleration, in warming.

global-temp-and-co2-1880-2009.gif


Global Climate Change Indicators

Global average temperature is one of the most-cited indicators of global climate change, and shows an increase of approximately 1.4°F since the early 20th Century. The global surface temperature is based on air temperature data over land and sea-surface temperatures observed from ships, buoys and satellites. There is a clear long-term global warming trend, while each individual year does not always show a temperature increase relative to the previous year, and some years show greater changes than others. These year-to-year fluctuations in temperature are due to natural processes, such as the effects of El Ninos, La Ninas, and the eruption of large volcanoes. Notably, the 20 warmest years have all occurred since 1981, and the 10 warmest have all occurred in the past 12 years.

-------------------------------

What's more, your idiocy about Hansen's 1988 media shows willful ignorance, of modern projections, consistent with Hansen's now-dated 1988 work. Kindly update your rants, to oppose any of the latest predictions, which come in the wake of revelations, Hansen predicted CH4 would issue, which it has, with more CO2, from warming lands and waters. This prediction of a 4 C rise in temperature in one lifetime is from 2010:

Climate change scientists warn of 4C global temperature rise | Environment | The Guardian

A hellish vision of a world warmed by 4C within a lifetime has been set out by an international team of scientists, who say the agonisingly slow progress of the global climate change talks that restart in Mexico today makes the so-called safe limit of 2C impossible to keep. A 4C rise in the planet's temperature would see severe droughts across the world and millions of migrants seeking refuge as their food supplies collapse.

"There is now little to no chance of maintaining the rise in global surface temperature at below 2C, despite repeated high-level statements to the contrary," said Kevin Anderson, from the University of Manchester, who with colleague Alice Bows contributed research to a special collection of Royal Society journal papers published tomorrow. "Moreover, the impacts associated with 2C have been revised upwards so that 2C now represents the threshold [of] extremely dangerous climate change."

--------------------------

4 C, within a lifetime! That means you need to go out and irrationally oppose a lot more than Hansen's 1988 predictions, Fatass and DDDeadhead-squad. Consider this my donation, to sufferers of CRS, DKS, and HUB, which frequent USMB.[/I]
 
Last edited:
True, as aerosols tend to settle/condense out of the atmosphere over about a decade's worth of time, whereas the nominal and unqualified atmospheric half-life (residence) for CO2 is measured in centuries.


Bullshit. CO2 residence time is between 5 and 16 years.


Essenhigh (2009) points out that the IPCC (Intergovernmental Panel on Climate Change) in their first report (Houghton et al., 1990) gives an atmospheric CO2 residence time (lifetime) of 50-200 years [as a "rough estimate"]. This estimate is confusingly given as an adjustment time for a scenario with a given anthropogenic CO2 input, and ignores natural (sea and vegetation) CO2 flux rates. Such estimates are analytically invalid; and they are in conflict with the more correct explanation given elsewhere in the same IPCC report: "This means that on average it takes only a few years before a CO2 molecule in the atmosphere is taken up by plants or dissolved in the ocean".

Some 99% of the atmospheric CO2 molecules are 12CO2 molecules containing the stable isotope 12C (Segalstad, 1982). To calculate the RT of the bulk atmospheric CO2 molecule 12CO2, Essenhigh (2009) uses the IPCC data of 1990 with a total mass of carbon of 750 gigatons in the atmospheric CO2 and a natural input/output exchange rate of 150 gigatons of carbon per year (Houghton et al., 1990). The characteristic decay time (denoted by the Greek letter tau) is simply the former value divided by the latter value: 750 / 150 = 5 years. This is a similar value to the ~5 years found from 13C/12C carbon isotope mass balance calculations of measured atmospheric CO2 13C/12C carbon isotope data by Segalstad (1992); the ~5 years obtained from CO2 solubility data by Murray (1992); and the ~5 years derived from CO2 chemical kinetic data by Stumm & Morgan (1970).

Revelle & Suess (1957) calculated from data for the trace atmospheric molecule 14CO2, containing the radioactive isotope14C, that the amount of atmospheric "CO2 derived from industrial fuel combustion" would be only 1.2% for an atmospheric CO2 lifetime of 5 years, and 1.73% for a CO2 lifetime of 7 years (Segalstad, 1998). Essenhigh (2009) reviews measurements of 14C from 1963 up to 1995, and finds that the RT of atmospheric 14CO2 is ~16 (16.3) years. He also uses the 14C data to find that the time value (exchange time) for variation of the concentration difference between the northern and southern hemispheres is ~2 (2.2) years for atmospheric 14CO2. This result compares well with the observed hemispheric transport of volcanic debris leading to "the year without a summer" in 1816 in the northern hemisphere after the 1815 Tambora volcano cataclysmic eruption in Indonesia in 1815.

Sundquist (1985) compiled a large number of measured RTs of CO2 found by different methods. The list, containing RTs for both 12CO2 and 14CO2, was expanded by Segalstad (1998), showing a total range for all reported RTs from 1 to 15 years, with most RT values ranging from 5 to 15 years. Essenhigh (2009) emphasizes that this list of measured values of RT compares well with his calculated RT of 5 years (atmospheric bulk 12CO2) and ~16 years (atmospheric trace 14CO2). Furthermore he points out that the annual oscillations in the measured atmospheric CO2 levels would be impossible without a short atmospheric residence time for the CO2 molecules.

Essenhigh (2009) suggests that the difference in atmospheric CO2 residence times between the gaseous molecules 12CO2 and 14CO2 may be due to differences in the kinetic absorption and/or dissolution rates of the two different gas molecules.

With such short residence times for atmospheric CO2, Essenhigh (2009) correctly points out that it is impossible for the anthropogenic combustion supply of CO2 to cause the given rise in atmospheric CO2. Consequently, a rising atmospheric CO2 concentration must be natural. This conclusion accords with measurements of 13C/12C carbon isotopes in atmospheric CO2, which show a maximum of 4% anthropogenic CO2 in the atmosphere (including any biogenic CO2), with 96% of the atmospheric CO2 being isotopically indistinguishable from "natural" inorganic CO2 exchanged with and degassed from the ocean, and degassed from volcanoes and the Earth's interior (Segalstad, 1992).

Essenhigh, R.E. 2009: Potential dependence of global warming on the residence time (RT) in the atmosphere of anthropogenically sourced carbon dioxide. Energy & Fuels 23: 2773-2784.

Houghton, J.T., Jenkins, G.J. & Ephraums, J.J. (Eds.) 1990: Climate Change. The IPCC Scientific Assessment. Intergovernmental Panel on Climate Change. Cambridge University Press, Cambridge: 365 pp.

Murray, J.W. 1992: The oceans. In: Butcher, S.S., Charlson, R.J., Orians, G.H. & Wolfe, G.V. (Eds.): Global biogeochemical cycles. Academic Press: 175-211.

Revelle, R. & Suess, H. 1957: Carbon dioxide exchange between atmosphere and ocean and the question of an increase of atmospheric CO2 during past decades. Tellus 9: 18-27.

Segalstad, T. V. 1982: Stable Isotope Analysis. In: Stable Isotopes in Hydrocarbon Exploration, Norwegian Petroleum Society 6904, Stavanger: 21 pp. Available at: http://www.co2web.info/STABIS-ANAL.pdf

Segalstad, T. V. 1992: The amount of non-fossil-fuel CO2 in the atmosphere. AGU Chapman Conference on Climate, Volcanism, and Global Change. March 23-27, 1992. Hilo, Hawaii. Abstracts: 25; and poster: 10 pp. Available at: http://www.co2web.info/hawaii.pdf

Segalstad, T. V. 1996: The distribution of CO2 between atmosphere, hydrosphere, and lithosphere; minimal influence from anthropogenic CO2 on the global "Greenhouse Effect". In Emsley, J. (Ed.): The Global Warming Debate. The Report of the European Science and Environment Forum. Bourne Press Ltd., Bournemouth, Dorset, U.K. [ISBN 0952773406]: 41-50. Available at: http://www.co2web.info/ESEFVO1.pdf

Segalstad, T. V. 1998: Carbon cycle modelling and the residence time of natural and anthropogenic atmospheric CO2: on the construction of the "Greenhouse Effect Global Warming" dogma. In: Bate, R. (Ed.): Global warming: the continuing debate. ESEF, Cambridge, U.K. [ISBN 0952773422]: 184-219. Available at: http://www.co2web.info/ESEF3VO2.pdf

Solomon, S., Plattner, G.-K., Knutti, R. & Friedlingstein, P. 2009: Irreversible climate change due to carbon dioxide emissions. Proceedings of The National Academy of Sciences of the USA [PNAS] 106, 6: 1704-1709.

Stumm, W. & Morgan, J.J. 1970: Aquatic chemistry: an introduction emphasizing chemical equilibria in natural waters. Wiley-Interscience: 583 pp.

Sundquist, E.T. 1985: Geological perspectives on carbon dioxide and the carbon cycle. In: Sundquist, E.T. & Broecker, W.S. (Eds.): The carbon cycle and atmospheric CO2: natural variations Archean to present. American Geophysical Union, Geophysical Monograph 32: 5-59.


W know you didn't compile this list on your own.


Of course I didn't. Good scientists don't waste time re-inventing the wheel. I found a good site that had a whole passel of papers that addressed the issue. Makes sense...no?
 
None of the data is falsified, if you believe it to be then you must supply cmpelling evidence in support of that contenion.

Of course it has been falsified and the compelling evidence is in the post directily above this one.

I don't know where you stand on sea level rise but just for fun, here is a short animation that is priceless for those wackos out there who believe the sea is going to swamp us all. It is a 140 year photographic record of dangerous sea level rise at a point of rock in La jolla, California:

6a010536b58035970c01676482977e970b-800wi


I've been challenging all of the Sea Level is rising chicken Littles to post the photographic evidence of the Sea Level rise.

This seems pretty conclusively to undermine what the chicken littles are saying.

Have any of the warmers got photo evidence that proves their case?


Nope. The one time they tried (Australia's ABC) it was found the female reporter altered her position by over a dozen meters to get out into deeper water to "show how much the ater had risen from their previous report". It was a pretty major scandal in Oz.
 
Given that the lowest temperature rise predicted in Hansen's 1988 testimony relied on a decrease in the concentration of CO2 and that the actual performance of the climate has underperformed that prediction, you are simply wrong.

CO2 has risen at a pace that should have supported his highest prediction of temperature increase. The actual increase is half of what he predicted and is what would be expected if the increase of temperature since 1600 ad had continued at the same pace absent the influence of CO2.

The fact that the temperature started its increase from the coldest point of the the Little Ice Age about 250 years before the start of the Industrial Revolution notwithstanding, Hansen predicted a rise to date of about 1 degree and we have experienced a rise to date of about a half a degree.

His prediction misses by 100%.

Is that success?

What do we learn from James Hansen's 1988 prediction?

Although your link says the misstatement as of 1998 was 25% -- it's a higher error now!.. So I don't care WHO mistestified in front of congress in 1998.. We learned something important about "assumptions" and climate sensitivity.

And that when the PRESS REPORTED hansens predictions in 1988, the screaming headline was for the RANGE of scenarios and the hysteria became "Scientists project up to a 2DegC rise in temp per decade".. And the funding feeding frenzy (fff) began....

Whatever, Fatass. Since 1981, the 20 warmest years on record occurred. The ten warmest years in the meteorological record occurred, since 2000. We are 24 years, down the road, from Hansen's 1988 predictions. Get over your old doggy-toy. Here's fresh kibbles:

NASA - NASA Finds 2011 Ninth-Warmest Year on Record

The global average surface temperature in 2011 was the ninth warmest since 1880, according to NASA scientists. The finding continues a trend in which nine of the 10 warmest years in the modern meteorological record have occurred since the year 2000.

NASA's Goddard Institute for Space Studies (GISS) in New York, which monitors global surface temperatures on an ongoing basis, released an updated analysis that shows temperatures around the globe in 2011 compared to the average global temperature from the mid-20th century. The comparison shows how Earth continues to experience warmer temperatures than several decades ago. The average temperature around the globe in 2011 was 0.92 degrees F (0.51 C) warmer than the mid-20th century baseline.

--------------------------------

Let's go over the latest hockey-stick graph. Notice how CO2 and warming are both on a sharp upswing, indicating related acceleration, in warming.

global-temp-and-co2-1880-2009.gif


Global Climate Change Indicators

Global average temperature is one of the most-cited indicators of global climate change, and shows an increase of approximately 1.4°F since the early 20th Century. The global surface temperature is based on air temperature data over land and sea-surface temperatures observed from ships, buoys and satellites. There is a clear long-term global warming trend, while each individual year does not always show a temperature increase relative to the previous year, and some years show greater changes than others. These year-to-year fluctuations in temperature are due to natural processes, such as the effects of El Ninos, La Ninas, and the eruption of large volcanoes. Notably, the 20 warmest years have all occurred since 1981, and the 10 warmest have all occurred in the past 12 years.

-------------------------------

What's more, your idiocy about Hansen's 1988 media shows willful ignorance, of modern projections, consistent with Hansen's now-dated 1988 work. Kindly update your rants, to oppose any of the latest predictions, which come in the wake of revelations, Hansen predicted CH4 would issue, which it has, with more CO2, from warming lands and waters. This prediction of a 4 C rise in temperature in one lifetime is from 2010:

Climate change scientists warn of 4C global temperature rise | Environment | The Guardian

A hellish vision of a world warmed by 4C within a lifetime has been set out by an international team of scientists, who say the agonisingly slow progress of the global climate change talks that restart in Mexico today makes the so-called safe limit of 2C impossible to keep. A 4C rise in the planet's temperature would see severe droughts across the world and millions of migrants seeking refuge as their food supplies collapse.

"There is now little to no chance of maintaining the rise in global surface temperature at below 2C, despite repeated high-level statements to the contrary," said Kevin Anderson, from the University of Manchester, who with colleague Alice Bows contributed research to a special collection of Royal Society journal papers published tomorrow. "Moreover, the impacts associated with 2C have been revised upwards so that 2C now represents the threshold [of] extremely dangerous climate change."

--------------------------

4 C, within a lifetime! That means you need to go out and irrationally oppose a lot more than Hansen's 1988 predictions, Fatass and DDDeadhead-squad. Consider this my donation, to sufferers of CRS, DKS, and HUB, which frequent USMB.[/I]


:lmao::lmao::lmao: Moron believes this crapola!
 
Bullshit. CO2 residence time is between 5 and 16 years.


Essenhigh (2009) points out that the IPCC (Intergovernmental Panel on Climate Change) in their first report (Houghton et al., 1990) gives an atmospheric CO2 residence time (lifetime) of 50-200 years [as a "rough estimate"]. This estimate is confusingly given as an adjustment time for a scenario with a given anthropogenic CO2 input, and ignores natural (sea and vegetation) CO2 flux rates. Such estimates are analytically invalid; and they are in conflict with the more correct explanation given elsewhere in the same IPCC report: "This means that on average it takes only a few years before a CO2 molecule in the atmosphere is taken up by plants or dissolved in the ocean".

Some 99% of the atmospheric CO2 molecules are 12CO2 molecules containing the stable isotope 12C (Segalstad, 1982). To calculate the RT of the bulk atmospheric CO2 molecule 12CO2, Essenhigh (2009) uses the IPCC data of 1990 with a total mass of carbon of 750 gigatons in the atmospheric CO2 and a natural input/output exchange rate of 150 gigatons of carbon per year (Houghton et al., 1990). The characteristic decay time (denoted by the Greek letter tau) is simply the former value divided by the latter value: 750 / 150 = 5 years. This is a similar value to the ~5 years found from 13C/12C carbon isotope mass balance calculations of measured atmospheric CO2 13C/12C carbon isotope data by Segalstad (1992); the ~5 years obtained from CO2 solubility data by Murray (1992); and the ~5 years derived from CO2 chemical kinetic data by Stumm & Morgan (1970).

Revelle & Suess (1957) calculated from data for the trace atmospheric molecule 14CO2, containing the radioactive isotope14C, that the amount of atmospheric "CO2 derived from industrial fuel combustion" would be only 1.2% for an atmospheric CO2 lifetime of 5 years, and 1.73% for a CO2 lifetime of 7 years (Segalstad, 1998). Essenhigh (2009) reviews measurements of 14C from 1963 up to 1995, and finds that the RT of atmospheric 14CO2 is ~16 (16.3) years. He also uses the 14C data to find that the time value (exchange time) for variation of the concentration difference between the northern and southern hemispheres is ~2 (2.2) years for atmospheric 14CO2. This result compares well with the observed hemispheric transport of volcanic debris leading to "the year without a summer" in 1816 in the northern hemisphere after the 1815 Tambora volcano cataclysmic eruption in Indonesia in 1815.

Sundquist (1985) compiled a large number of measured RTs of CO2 found by different methods. The list, containing RTs for both 12CO2 and 14CO2, was expanded by Segalstad (1998), showing a total range for all reported RTs from 1 to 15 years, with most RT values ranging from 5 to 15 years. Essenhigh (2009) emphasizes that this list of measured values of RT compares well with his calculated RT of 5 years (atmospheric bulk 12CO2) and ~16 years (atmospheric trace 14CO2). Furthermore he points out that the annual oscillations in the measured atmospheric CO2 levels would be impossible without a short atmospheric residence time for the CO2 molecules.

Essenhigh (2009) suggests that the difference in atmospheric CO2 residence times between the gaseous molecules 12CO2 and 14CO2 may be due to differences in the kinetic absorption and/or dissolution rates of the two different gas molecules.

With such short residence times for atmospheric CO2, Essenhigh (2009) correctly points out that it is impossible for the anthropogenic combustion supply of CO2 to cause the given rise in atmospheric CO2. Consequently, a rising atmospheric CO2 concentration must be natural. This conclusion accords with measurements of 13C/12C carbon isotopes in atmospheric CO2, which show a maximum of 4% anthropogenic CO2 in the atmosphere (including any biogenic CO2), with 96% of the atmospheric CO2 being isotopically indistinguishable from "natural" inorganic CO2 exchanged with and degassed from the ocean, and degassed from volcanoes and the Earth's interior (Segalstad, 1992).

Essenhigh, R.E. 2009: Potential dependence of global warming on the residence time (RT) in the atmosphere of anthropogenically sourced carbon dioxide. Energy & Fuels 23: 2773-2784.

Houghton, J.T., Jenkins, G.J. & Ephraums, J.J. (Eds.) 1990: Climate Change. The IPCC Scientific Assessment. Intergovernmental Panel on Climate Change. Cambridge University Press, Cambridge: 365 pp.

Murray, J.W. 1992: The oceans. In: Butcher, S.S., Charlson, R.J., Orians, G.H. & Wolfe, G.V. (Eds.): Global biogeochemical cycles. Academic Press: 175-211.

Revelle, R. & Suess, H. 1957: Carbon dioxide exchange between atmosphere and ocean and the question of an increase of atmospheric CO2 during past decades. Tellus 9: 18-27.

Segalstad, T. V. 1982: Stable Isotope Analysis. In: Stable Isotopes in Hydrocarbon Exploration, Norwegian Petroleum Society 6904, Stavanger: 21 pp. Available at: http://www.co2web.info/STABIS-ANAL.pdf

Segalstad, T. V. 1992: The amount of non-fossil-fuel CO2 in the atmosphere. AGU Chapman Conference on Climate, Volcanism, and Global Change. March 23-27, 1992. Hilo, Hawaii. Abstracts: 25; and poster: 10 pp. Available at: http://www.co2web.info/hawaii.pdf

Segalstad, T. V. 1996: The distribution of CO2 between atmosphere, hydrosphere, and lithosphere; minimal influence from anthropogenic CO2 on the global "Greenhouse Effect". In Emsley, J. (Ed.): The Global Warming Debate. The Report of the European Science and Environment Forum. Bourne Press Ltd., Bournemouth, Dorset, U.K. [ISBN 0952773406]: 41-50. Available at: http://www.co2web.info/ESEFVO1.pdf

Segalstad, T. V. 1998: Carbon cycle modelling and the residence time of natural and anthropogenic atmospheric CO2: on the construction of the "Greenhouse Effect Global Warming" dogma. In: Bate, R. (Ed.): Global warming: the continuing debate. ESEF, Cambridge, U.K. [ISBN 0952773422]: 184-219. Available at: http://www.co2web.info/ESEF3VO2.pdf

Solomon, S., Plattner, G.-K., Knutti, R. & Friedlingstein, P. 2009: Irreversible climate change due to carbon dioxide emissions. Proceedings of The National Academy of Sciences of the USA [PNAS] 106, 6: 1704-1709.

Stumm, W. & Morgan, J.J. 1970: Aquatic chemistry: an introduction emphasizing chemical equilibria in natural waters. Wiley-Interscience: 583 pp.

Sundquist, E.T. 1985: Geological perspectives on carbon dioxide and the carbon cycle. In: Sundquist, E.T. & Broecker, W.S. (Eds.): The carbon cycle and atmospheric CO2: natural variations Archean to present. American Geophysical Union, Geophysical Monograph 32: 5-59.


W know you didn't compile this list on your own.


Of course I didn't. Good scientists don't waste time re-inventing the wheel. I found a good site that had a whole passel of papers that addressed the issue. Makes sense...no?

Hint:
When you print unoriginal work you are supposed to include CITATIONS so that others can, if they wish, go to the original and verify it and/or or see it in its original context. It also helps to keep you from looking like you're taking credit for someone else's work.
 
He wrote the paper 12 years after his now famous testimony before Congress where he laid out his famous three graphs showing what would happen with ever increasing CO2 levels. Remember? Scenario's A, B, and of course C. Even with the CO2 levels increasing FAR above even his worst guestimate the temps havn't come even close to his worst case scenario...in fact they havn't even come close to his BEST case scenario.

I think he realised he was wrong and was actually doing some good science there. Then all of a sudden the TEAM got into positions of power and voila, climatology entered the realm of the psychics.


CO2 is now the primary driver because we have dealt with non-CO2 GHG emissions by reducing them. There's absolutely nothing that is inconsistent with his view now and then.


Another constant is that he's wrong.

Ignore the facts. Facts can change. His opinions will never change.


Speak in complete thoughts please.
 

Forum List

Back
Top