Billy_Bob
Diamond Member
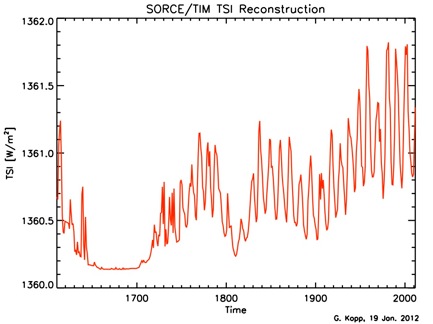
The sun is cooling...er, because of global warming
Yup.. It's kinda like those classic Godzilla versus Mothra showdowns. Place your bet..
What is actually not so funny is this is how most of the Alarmist drivel is show fraud. They exaggerate the cause to the extent that no one with any scientific training would fall for the butt load of crap they are spewing.