East Antarctic meltwater ponds seen for first time

And your point would be.... what?

The Earth, including the Antarctic, is warming. The primary cause of that warming is the greenhouse effect acting on increasing levels of CO2 in the atmosphere caused by human combustion of fossil fuels and deforestation. Those points are established beyond a doubt. Thus, your rejection of this serves only to indicate your intellectual shortcomings (as if that was ever in question).
 
From Wikipedia'a article on Antarctica

Global warming[edit]
Main article: Global warming in Antarctica

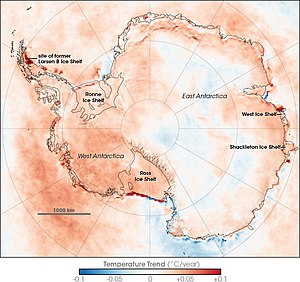
Antarctic Skin Temperature Trends between 1981 and 2007, based on thermal infrared observations made by a series of NOAA satellite sensors. Skin temperature trends do not necessarily reflect air temperature trends.
The continent-wide average surface temperature trend of Antarctica is positive and significant at >0.05 °C/decade since 1957.[21][22][23][24] The West Antarctic ice sheet has warmed by more than 0.1 °C/decade in the last 50 years, and is strongest in winter and spring. Although this is partly offset by fall cooling in East Antarctica, this effect is restricted to the 1980s and 1990s.[21][22][23]

Research published in 2009 found that overall the continent had become warmer since the 1950s, a finding consistent with the influence of man-made climate change:

and

ann_timeseries.png
 
And your point would be.... what?

The Earth, including the Antarctic, is warming. The primary cause of that warming is the greenhouse effect acting on increasing levels of CO2 in the atmosphere caused by human combustion of fossil fuels and deforestation. Those points are established beyond a doubt. Thus, your rejection of this serves only to indicate your intellectual shortcomings (as if that was ever in question).

Sorry crick...there is no greenhouse effect...there is an atmospheric thermal effect which is unaffected by the composition of the atmosphere beyond its mass.

And they are not established at all crick...and the fact that you believe they are only brings how completely duped you have been into sharp relief.
 
And this is just another one of the many reasons why your opinion on anything even resembling a scientific issue is absolutely, positively, utterly, undeniably WORTHLESS. Most of the time you talk like a normal human being, but the moment you bring up your ideas on basic science, you instantly mark yourself as a complete fruitcake.
 
Nicely out-of-context quote. The comment you've picked up concerned a satellite observation of a temperature in Antarctica that was colder than the coldest temperature seen by thermometer at the surface. It's relevance to the discussion is NIL.

What a dip.
 
Mr Beale it was 15,000 years ago, not millions, that we were in an ice age. If you are that ignorant on this subject, why do you bother to post?

Wait so we're out of an ice age in relatively recent geological time...and you're hysterical that glaciers are melting?
 
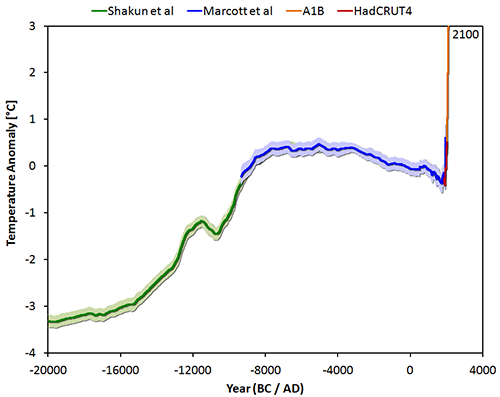
So... you don't see a discontinuity here?

shakun_marcott_hadcrut4_a1b_eng.png

I see faked data from the guy who tried to make the case that CO2 precedes temperature increase irrespective of all ice cores to the contrary
.
"Impressed, I am not," sayeth Master Yoda
 
So... you don't see a discontinuity here?

shakun_marcott_hadcrut4_a1b_eng.png

I see faked data from the guy who tried to make the case that CO2 precedes temperature increase irrespective of all ice cores to the contrary
.
"Impressed, I am not," sayeth Master Yoda

They use the tools at their disposal...and really, when you consider who it is that they are really trying to fool, how convincing does their crap have to be.....it is like doing magic tricks for pre schoolers. Folks like crick can be fooled if the colors are nice.
 
And your point would be.... what?

The Earth, including the Antarctic, is warming. The primary cause of that warming is the greenhouse effect acting on increasing levels of CO2 in the atmosphere caused by human combustion of fossil fuels and deforestation. Those points are established beyond a doubt. Thus, your rejection of this serves only to indicate your intellectual shortcomings (as if that was ever in question).

Sorry, that was funny.

Did you mean that CO2 has been raising the temperatures the past 14,000 years?

Atlantis and Internal Combustion?
 
From Wikipedia'a article on Antarctica

Global warming[edit]
Main article: Global warming in Antarctica

Antarctic Skin Temperature Trends between 1981 and 2007, based on thermal infrared observations made by a series of NOAA satellite sensors. Skin temperature trends do not necessarily reflect air temperature trends.
The continent-wide average surface temperature trend of Antarctica is positive and significant at >0.05 °C/decade since 1957.[21][22][23][24] The West Antarctic ice sheet has warmed by more than 0.1 °C/decade in the last 50 years, and is strongest in winter and spring. Although this is partly offset by fall cooling in East Antarctica, this effect is restricted to the 1980s and 1990s.[21][22][23]

Research published in 2009 found that overall the continent had become warmer since the 1950s, a finding consistent with the influence of man-made climate change:

and

ann_timeseries.png


If it were a stock, it would have the same price it did in 1970. What's your point?
 
And they try to say I can't read a graph.


No crick...your own posts regarding graphs prove that you can't read one...including this one...it is no point explaining to you how what he said relates to the graph since graphs are clearly beyond your ability to understand.
 
Ah yes, chose a graph that stops at 2012. LOL You really would not like where 2014, 2015, and 2016 are on that graph.

It wouldn't make any difference to my point. The graph clearly shows that temperatures went down several times, even as CO2 levels increased.

Now according to the "CO2 drives Temps" theory, that shouldn't be possible. After all, by the standard logic of the day, the green house effect driven by ever increasing CO2, should only be capable of one result.... continuously climbing temps.

Since we can clearly see temps have not increased in direct relation to CO2, then the theory is disproved. Whether we had 2014-2016 or not, wouldn't change the fact that historically the theory is proven false.

This is the scientific method. You create a theory. You test the theory. If the theory is contradicted by the facts, the theory is discarded.

The fact you people cling to this theory which has been proven false dozens, if not hundreds of times, places you more in the religious dogma category of thinking, rather than science.
don't forget the 40's to the 70's drop as well. CO2 increased. It has been a point I've made quite often in past arguments with these folks. They avoid replying.
 
And your point would be.... what?

The Earth, including the Antarctic, is warming. The primary cause of that warming is the greenhouse effect acting on increasing levels of CO2 in the atmosphere caused by human combustion of fossil fuels and deforestation. Those points are established beyond a doubt. Thus, your rejection of this serves only to indicate your intellectual shortcomings (as if that was ever in question).
crick again, when will you post up the proof of a greenhouse effect? Still waiting five years now.
 
And they try to say I can't read a graph.
You posted a graph with a flat trend line since 1970, what was your point?


Crick had no idea that the various points on the graph relate to each other. He just saw the pretty colors and squiggly lines and felt like it meant.......something...and since he had seen other warmer wackos use graphs like it, he thought that it might mean something that would make him look smart.
 
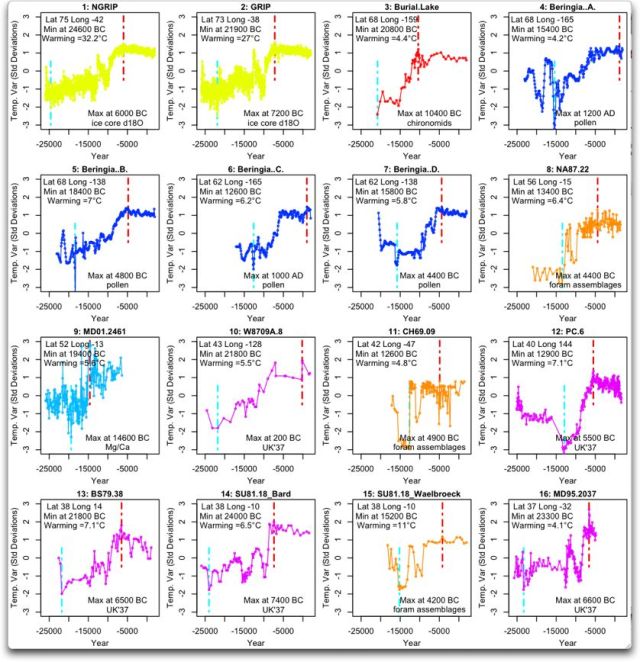
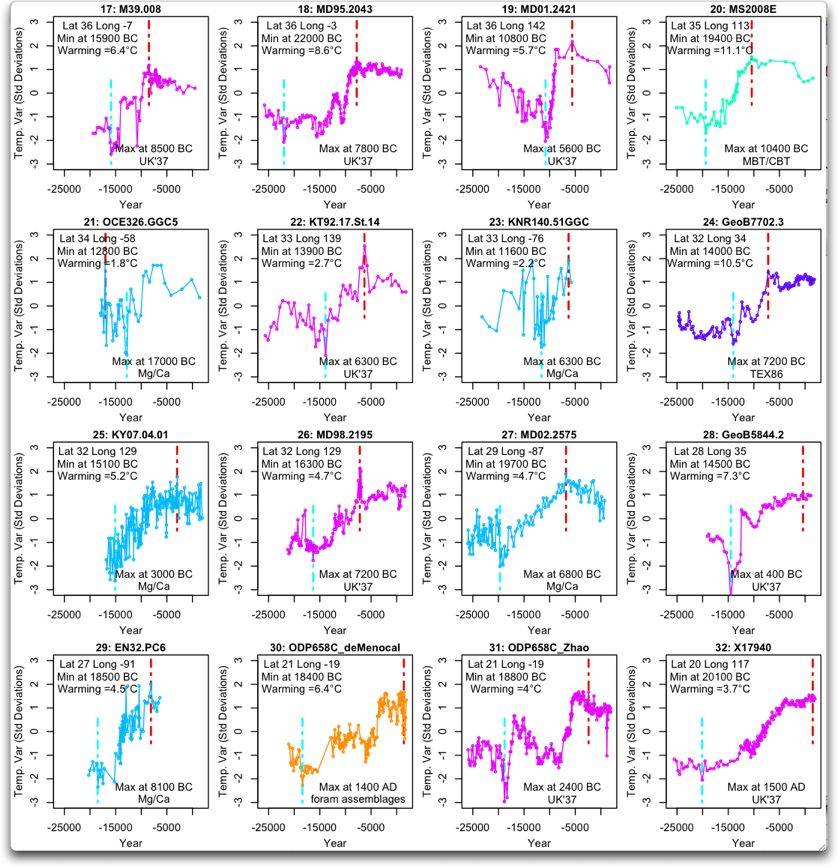
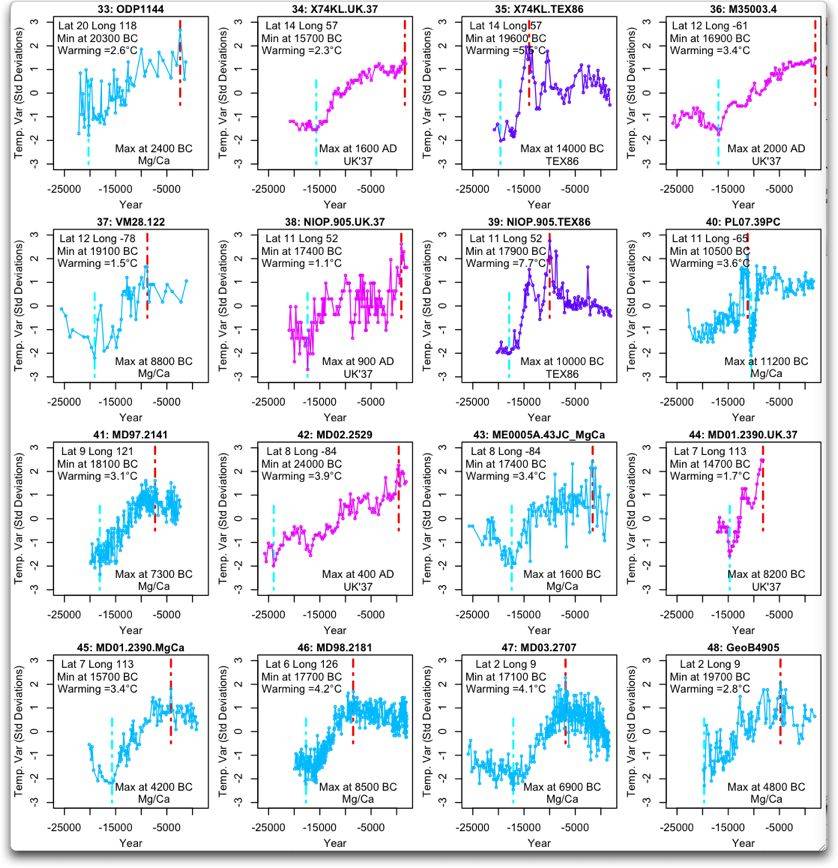
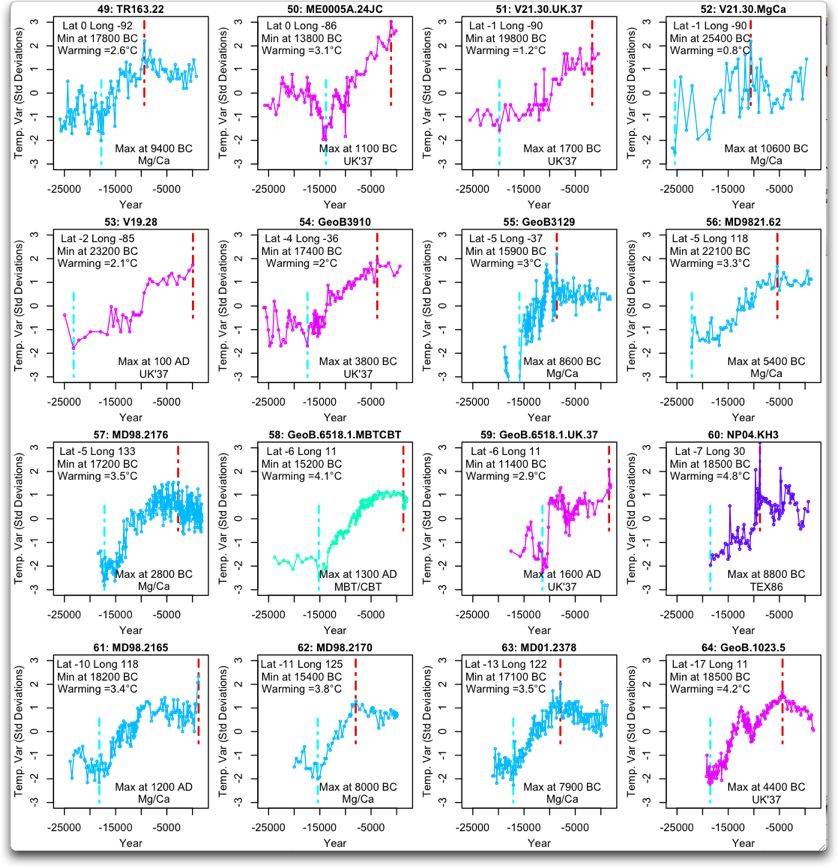
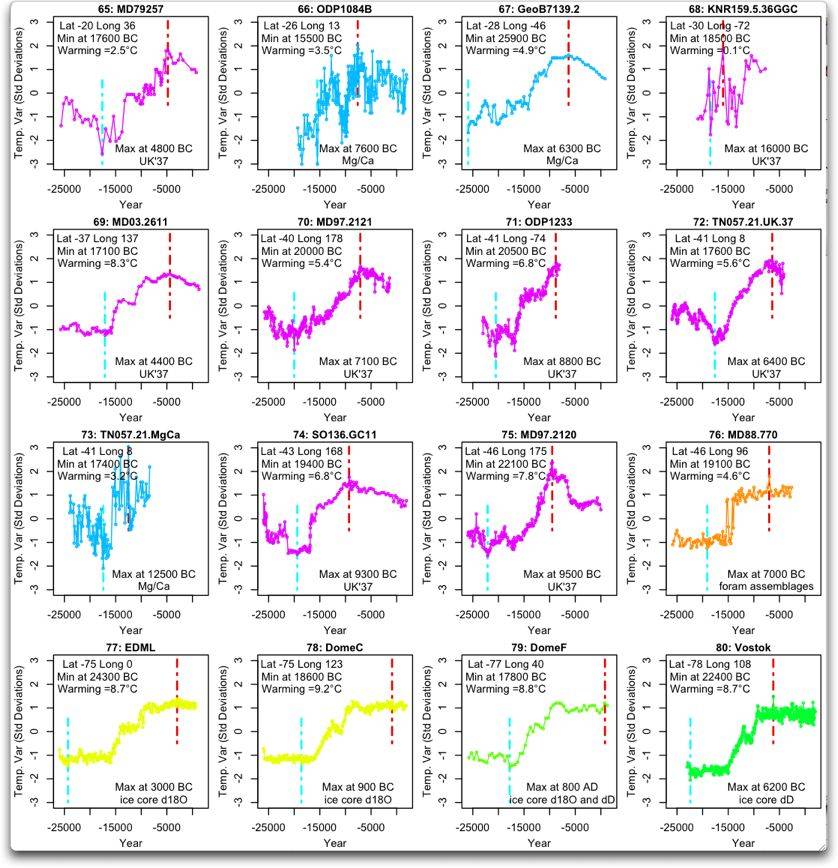
Shakun's proxies-

nature-proxies-1-to-16.jpg

nature-proxies-17-to-32.jpg

nature-proxies-33-to-48.jpg

nature-proxies-49-to-64.jpg

nature-proxies-65-to-80.jpg


these are the proxies that Shakun put together for his part of the graph

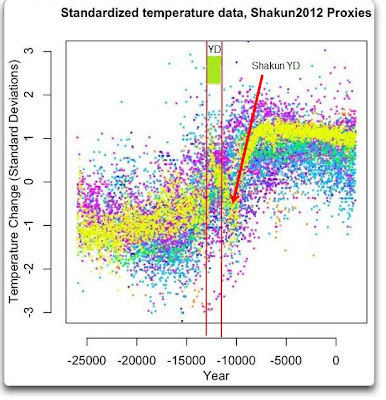
image_thumb8.png


scatter plot of the proxies

image_thumb9.png

Large scatter of individual data points on Willis’s plot from the 80 proxies used in the construction of the Shakun et al. temperature curve. I’ve added lines to show the age of Younger Dryas interval, which doesn’t correspond to the dip in the Shakun et al. temperature data.

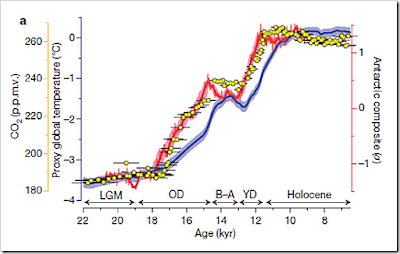
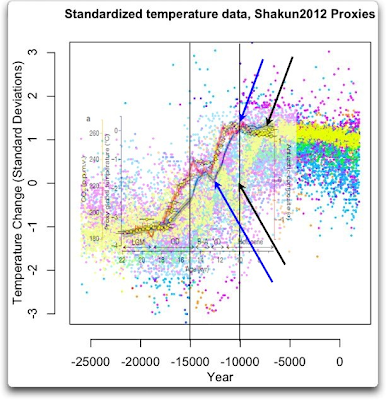
Just for fun, I superimposed the curves on Shakun et al. figure 2 over Willis’s data point plot (see below). Because the global temperature curve (the blue curve) was presumably derived from the data in Willis’s plot, it should fit well with it. Interestingly, it doesn’t. I’ve shown with a blue arrow the dip in temperature that corresponds to the Younger Dryas and a black arrow pointing to what should be the same dip in temperature on the plot of individual data points. Other arrows point to similar differences for the end of the Younger Dryas. Now you

would think that since the Shakun et al. blue curve was constructed from the individual data points shown on the graph, the two should surely be compatible! I’ve also shown on the graph the well-established age of the Younger Dryas—note that the Shakun et al. global temperature data points show a dip in temperature (presumably the Younger Dryas) that is considerably younger. Makes you wonder!

image_thumb10.png


if Shakun cannot even get the Younger Dryas right, how can he make claims about the Temperature/CO2 relationship and timing 20,000 years ago? and whats with the claimed precision of a few tenths of a degree in Cricks wheelchair graph?

Shakun_Marcott_HadCRUT4_A1B_500.png


who out there still believes that this graph accurate and precise at the implied certainty?
 

Forum List

Back
Top