edthecynic
Censored for Cynicism
- Oct 20, 2008
- 43,044
- 6,883
- 1,830
No, I'm saying the lying scum source you mindlessly parroted without checking dishonestly used numbers that used two different baselines. It is not that hard to figure out!Oh? So you're saying they falsified the numbers to make them say what they wanted them to. Is that what you're saying?Typical denier dishonesty!!!Yeah....pretty much. NOAA reported that 1998 global temp was 62 degrees. This last year it was 58. Which number is bigger?So you're saying the entirety of climate science with thousands of temperature measurements from all over the world is a fraud. lol
The 62 degree number is calculated against the 30 year average baseline from 1961 to 1990, whereas the 58 degree number was calculated using the 20th century average baseline. Only the most dishonest scum would compare two different baselines!!!!
Global Analysis - Annual 2015 | State of the Climate | National Centers for Environmental Information (NCEI)
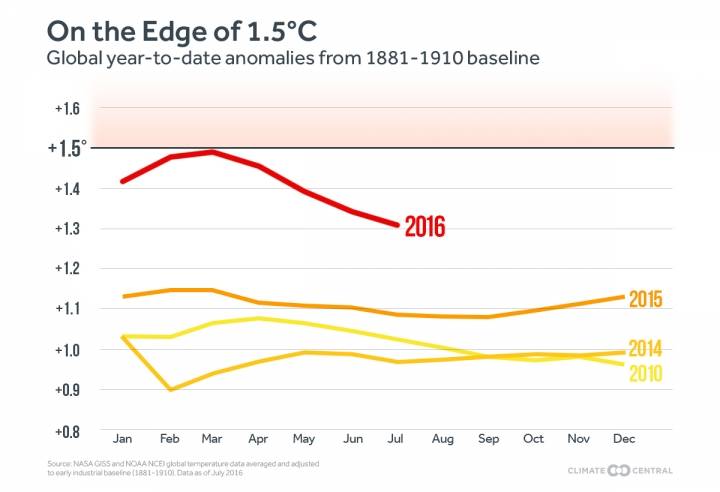
With the contribution of such record warmth at year's end and with 10 months of the year record warm for their respective months, including the last 8 (January was second warmest for January and April was third warmest), the average global temperature across land and ocean surface areas for 2015 was 0.90°C (1.62°F) above the 20th century average of 13.9°C (57.0°F)
The 2015 temperature also marks the largest margin by which an annual temperature record has been broken. Prior to this year, the largest margin occurred in 1998, when the annual temperature surpassed the record set in 1997 by 0.12°C (0.22°F). Incidentally, 1997 and 1998 were the last years in which a similarly strong El Niño was occurring. The annual temperature anomalies for 1997 and 1998 were 0.51°C (0.92°F) and 0.63°C (1.13°F), respectively, above the 20th century average, both well below the 2015 temperature departure.
Why don't you name the source of your dishonest numbers you used so all honest people can know never to trust them, even though you will continue to trust them forever.