Old Rocks
Diamond Member
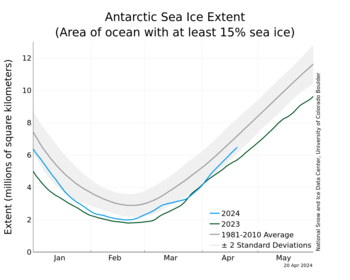
OK, I get what you are saying, Mr. Flacaltenn. We have a change from +2 standard deviations to -3 standard deviations in the ice melt in the Antarctic. And I don't know what it means, nor even what the primary cause. Therefore, it can be ignored. Nothing to see here, folks, just keep moving and look the other way.A change from nearly 2+ standard deviations to 3- standard deviations in the space of a year is a minor deviation? OK.............
Where do you see a std deviation marker in those graphs? The point is that any statistical distribution built on 35 years of data for some parameter like that -- the "std deviation" has not yet BEEN established. At least not one that is meaningful to a climate discussion.
Do YOU know why the SIE is less this spring down there?
Wonderful engineering point of view. LOL