Antarctic sea ice 2016: Historic lows

ScienceRocks

Democrat all the way!
Mar 16, 2010
59,455
6,793
1,900
The Good insane United states of America
Antarctic sea ice 2016: Historic lows
Mark BrandonNovember 24, 2016Leave a reply
Antarctic sea ice 2016: Historic lows
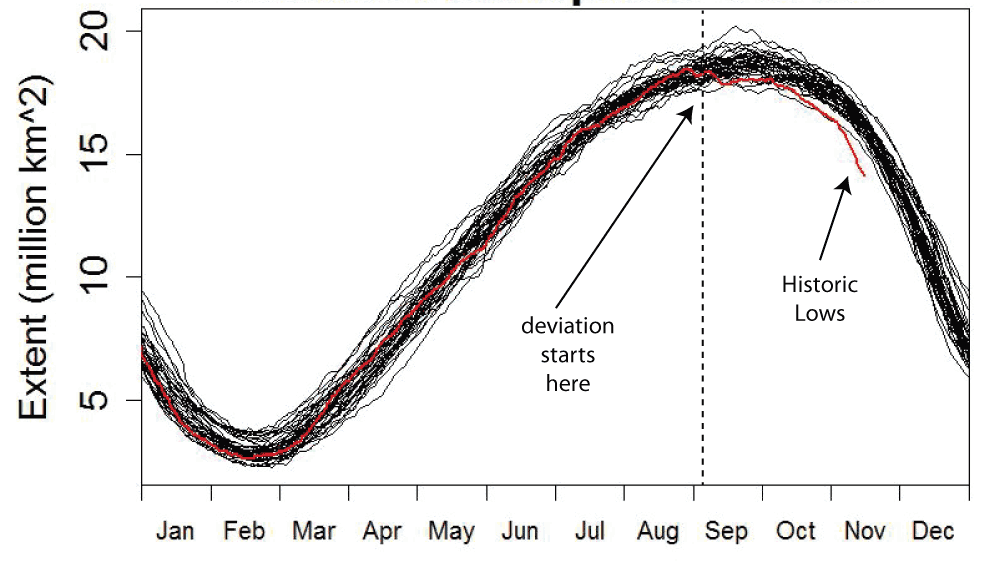
The seasonal cycle of sea ice extent in Antarctica has been fairly stable over the length of the satellite record. There is a slow growth of sea ice from a minimum of ~3x10⁶ km2 in February to a maximum of ~19 x106km2 in September in February before a relatively rapid fall in the Antarctic spring.

But this year something different is going on.

Below is Tamino's image for the Southern Hemisphere, the red line is 2016 up to 16 November 2016.

SHM_Annotated.gif

The annotated seasonal extent of sea ice in the Southern hemisphere. From Tamino's post Sea Ice, North and South.
From January up to September the sea ice extent follows all previous data.

But what happened in September?


After that date it dipped low, to reach historic lows by the end of October.

Well, there goes Antarctica argument the loserterians had.
 
Antarctic sea ice 2016: Historic lows
Mark BrandonNovember 24, 2016Leave a reply
Antarctic sea ice 2016: Historic lows
The seasonal cycle of sea ice extent in Antarctica has been fairly stable over the length of the satellite record. There is a slow growth of sea ice from a minimum of ~3x10⁶ km2 in February to a maximum of ~19 x106km2 in September in February before a relatively rapid fall in the Antarctic spring.

But this year something different is going on.

Below is Tamino's image for the Southern Hemisphere, the red line is 2016 up to 16 November 2016.

SHM_Annotated.gif

The annotated seasonal extent of sea ice in the Southern hemisphere. From Tamino's post Sea Ice, North and South.
From January up to September the sea ice extent follows all previous data.

But what happened in September?


After that date it dipped low, to reach historic lows by the end of October.

Well, there goes Antarctica argument the loserterians had.
Wow! I can see why you are so worried. It has totally departed from the trend such that up is now down. Egads!
 
Antarctic sea ice 2016: Historic lows
Mark BrandonNovember 24, 2016Leave a reply
Antarctic sea ice 2016: Historic lows
The seasonal cycle of sea ice extent in Antarctica has been fairly stable over the length of the satellite record. There is a slow growth of sea ice from a minimum of ~3x10⁶ km2 in February to a maximum of ~19 x106km2 in September in February before a relatively rapid fall in the Antarctic spring.

But this year something different is going on.

Below is Tamino's image for the Southern Hemisphere, the red line is 2016 up to 16 November 2016.

SHM_Annotated.gif

The annotated seasonal extent of sea ice in the Southern hemisphere. From Tamino's post Sea Ice, North and South.
From January up to September the sea ice extent follows all previous data.

But what happened in September?


After that date it dipped low, to reach historic lows by the end of October.

Well, there goes Antarctica argument the loserterians had.
Satellite record is only 35 years old. Maybe less. Not enough time to figure out "normal deviations". We might actually LEARN something here if Matthew would stop shitting his pants.

The Earth is a huge thermodynamic system. Those "stadium waves" that Curry postulated take a long time to propagate.. COULD be the reaction to a major El Nino.. OR it could be increased vulcanism under the shoreline.

OR it could be cloud cover or any number of OTHER things. OTHER than a 0.5degC rise in atmos temperature.
 
Antarctic sea ice 2016: Historic lows
Mark BrandonNovember 24, 2016Leave a reply
Antarctic sea ice 2016: Historic lows
The seasonal cycle of sea ice extent in Antarctica has been fairly stable over the length of the satellite record. There is a slow growth of sea ice from a minimum of ~3x10⁶ km2 in February to a maximum of ~19 x106km2 in September in February before a relatively rapid fall in the Antarctic spring.

But this year something different is going on.

Below is Tamino's image for the Southern Hemisphere, the red line is 2016 up to 16 November 2016.

SHM_Annotated.gif

The annotated seasonal extent of sea ice in the Southern hemisphere. From Tamino's post Sea Ice, North and South.
From January up to September the sea ice extent follows all previous data.

But what happened in September?


After that date it dipped low, to reach historic lows by the end of October.

Well, there goes Antarctica argument the loserterians had.
upload_2016-11-24_13-28-30.png
 
My goodness, why don't you show us what year that is? Come on, Ding, this is getting ridiculous, all these posts and never a link to show us where your so called information comes from.
 
My goodness, why don't you show us what year that is? Come on, Ding, this is getting ridiculous, all these posts and never a link to show us where your so called information comes from.
No what is ridiculous is you jack-a-napes shitting your pants over minor deviations which will always prove to be nothing because there is no problem. CO2 does not drive climate change. If it did we would have seen much quicker responses when climates really were changing.
 
A change from nearly 2+ standard deviations to 3- standard deviations in the space of a year is a minor deviation? OK.............
 
CO2 does not drive climate change!!!!!!!!!!!!!!!!!!!!!!

Say it enough times and it might come true. And all the physicists in the world will stand amazed. Publish why this is so and win a Nobel.
 
A change from nearly 2+ standard deviations to 3- standard deviations in the space of a year is a minor deviation? OK.............

Where do you see a std deviation marker in those graphs? The point is that any statistical distribution built on 35 years of data for some parameter like that -- the "std deviation" has not yet BEEN established. At least not one that is meaningful to a climate discussion.

Do YOU know why the SIE is less this spring down there?
 
CO2 does not drive climate change!!!!!!!!!!!!!!!!!!!!!!

Say it enough times and it might come true. And all the physicists in the world will stand amazed. Publish why this is so and win a Nobel.
If that were true then there should have been an immediate decrease of 7C in temperature when CO2 dropped from 3500 ppm to less than 1000 ppm. There wasn't. It took 12 million years for that to occur. 12 million years.

upload_2016-11-24_19-14-30.png
 
CO2 does not drive climate change!!!!!!!!!!!!!!!!!!!!!!

Say it enough times and it might come true. And all the physicists in the world will stand amazed. Publish why this is so and win a Nobel.


Say it once and you've uttered a factual statement. Unlike your hysterical claims.
 
A change from nearly 2+ standard deviations to 3- standard deviations in the space of a year is a minor deviation? OK.............
And it is no different that the point in time I pointed out which time has shown to be a false indicator. So stop shitting you pants because of the latest false indicator. You can always shit your pants when and if a true indicator emerges.

You skipped a point where you demonstrated that human CO2 emissions have had nothing to do with the observed warming and that the negative ice mass balance has nothing to do with the rapidly increasing temperature of the poles.
What warming you imbecile? Are you talking about the warming trend that has existed for the last 22,000 years?
 
"Imbecile"? More of your "I haven't attacked you personally"?

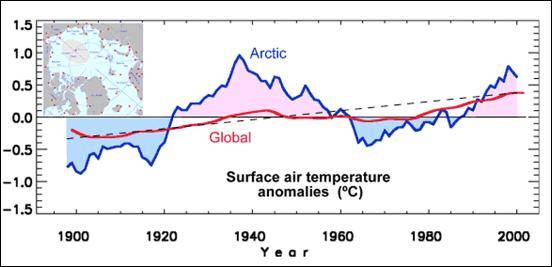
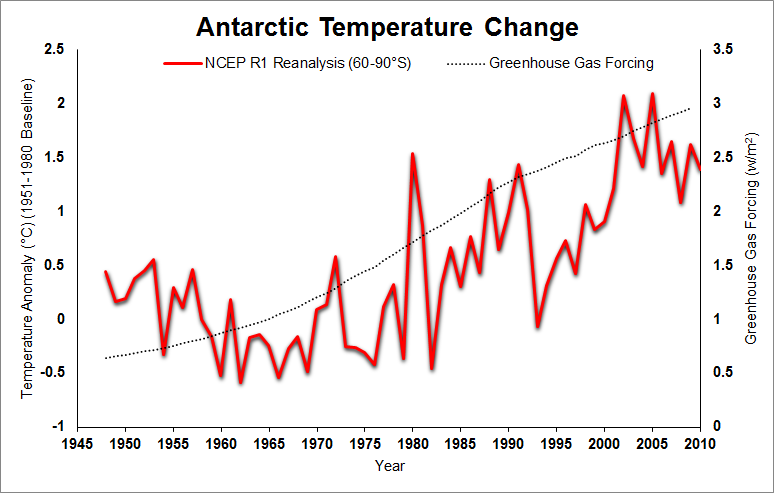
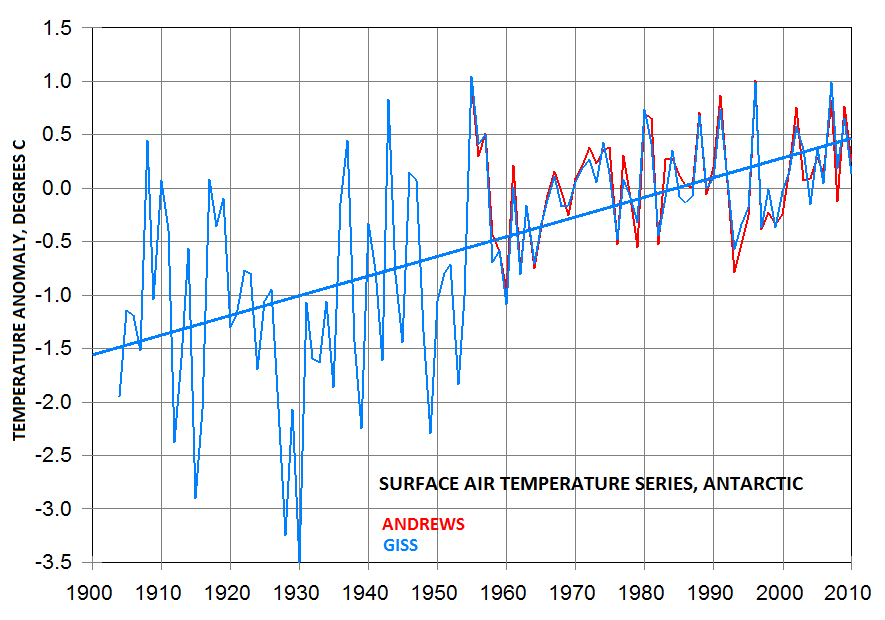
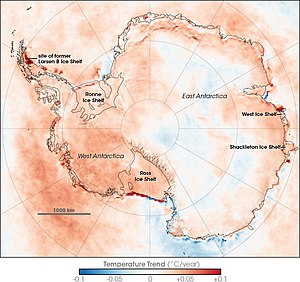
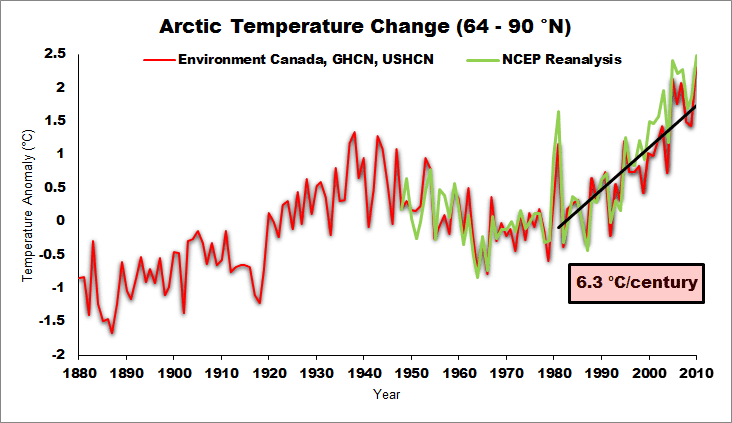
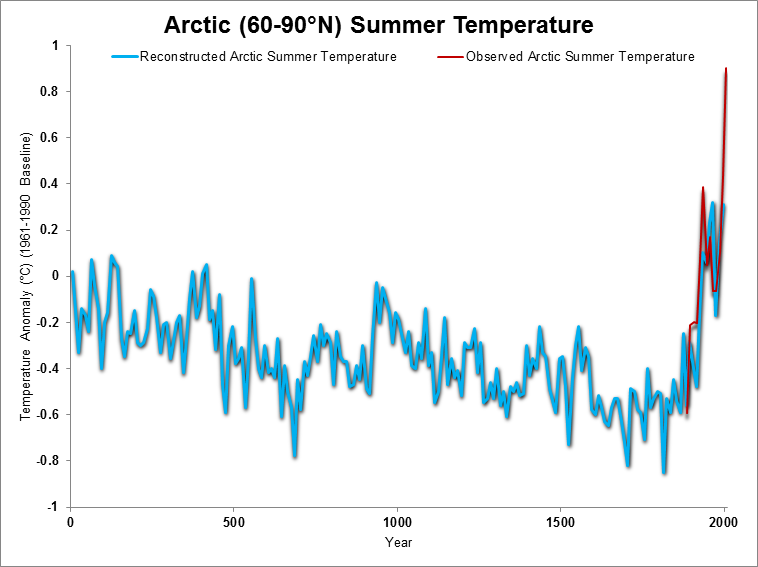
This warming.

ArcticTC1880-2010NCEP.png


Kaufmannetal.2009.png


arctic-trend.png

upload_2016-11-25_8-54-0.jpeg


image012.jpg


AntarcticTemperatureChange.png


antarctica_temp_trends2.png


305938main_Antarctica_temps.jpg


temp_series.jpg


300px-Antarctic_Temperature_Trend_1981-2007.jpg


The warming associated with the Younger Dryas ended 12,000 years ago. The Earth has been cooling since then and only began warming in response to elevated CO2 from human combustion of fossil fuels.

Holocene_Temperature_Variations.png


holo_temp_reconstruction-marcott2013.jpg


6a010536b58035970c0120a719dbb4970b-pi
 
"Imbecile"? More of your "I haven't attacked you personally"?

This warming.

ArcticTC1880-2010NCEP.png


Kaufmannetal.2009.png


arctic-trend.png

View attachment 99844

image012.jpg


AntarcticTemperatureChange.png


antarctica_temp_trends2.png


305938main_Antarctica_temps.jpg


temp_series.jpg


300px-Antarctic_Temperature_Trend_1981-2007.jpg


The warming associated with the Younger Dryas ended 12,000 years ago. The Earth has been cooling since then and only began warming in response to elevated CO2 from human combustion of fossil fuels.

Holocene_Temperature_Variations.png


holo_temp_reconstruction-marcott2013.jpg


6a010536b58035970c0120a719dbb4970b-pi
If it was true that CO2 drives climate then there would have been an immediate drop of 7C when the atmospheric CO2 fell from 3500 ppm to 600 ppm. Instead it took 12 million years.

upload_2016-11-24_19-14-30-png.99781
 

Forum List

Back
Top