Navigation
Install the app
How to install the app on iOS
Follow along with the video below to see how to install our site as a web app on your home screen.

Note: This feature currently requires accessing the site using the built-in Safari browser.
More options
You are using an out of date browser. It may not display this or other websites correctly.
You should upgrade or use an alternative browser.
You should upgrade or use an alternative browser.
Antarctic and Arctic gaining ICE.. Not Melting...
- Thread starter Billy_Bob
- Start date
Actually, it's easy, provided you're not a raving conspiracy nutter.it is hard to figure out any reason for it other than misdirection of some sort.
We could help you out, but it's more fun now to watch you grab the various conspiracies and run with them.
- Dec 18, 2013
- 136,659
- 28,000
- 2,180
Holy crap, old scrocks took that personally. This is actually personal to these dweebs. It doesn't get more stupid than that. I'm telling you, skooks is rolling with old scrocks response. I know it. he probably has to go look for his nut sack again. And then mantooth, we'll show you, but we won't. The dude, chick has nothing. She/ it, is composed of no data or facts. Offering nothing to any thread. Me, I know my limitations to the discussion because I don't have the software to do the graphting that you all do. I can find graphs from others, but the ones you and Billy provide are well done by you all. BTW, thanks.I'm all ears as to why they used different scales to measure the same thing. Do you find the results easier to compare?
The only thing that I do know, is that in science experiments are done and because they want me personally to believe 120 PPM of CO2 in the atmosphere will do what they claim, well, for this kid you have to show me the evidence. Plain and simple. So, of course no one has one. Well that in itself is the evidence. I have all I need, they can bantor all day, but in the end, it's just mumbo jumbo for dollars.
- Dec 18, 2013
- 136,659
- 28,000
- 2,180
right, just like you have a thousands of experiments right? you're such a moron. Hey got any more of those circle jerk comments, seems you really enjoy that! I bet you play mumbo jumbo for dollars right? Or, you could continue to post more stupid!! Your choice.Actually, it's easy, provided you're not a raving conspiracy nutter.it is hard to figure out any reason for it other than misdirection of some sort.
We could help you out, but it's more fun now to watch you grab the various conspiracies and run with them.
I can tell by the gaps that mamooth ( the poo flinging monkey that I have on ignore) has been around. Does he have an explanation as to why two different scales for temperature were used in that graph? Or is he still just ranting about conspiracy theories?
It would even make more sense if one of the series was displayed in degrees F and the other in Celsius. But to display them both in Celcius but on different scales just means they were hesitant to show the comparison.
It would even make more sense if one of the series was displayed in degrees F and the other in Celsius. But to display them both in Celcius but on different scales just means they were hesitant to show the comparison.
- Dec 18, 2013
- 136,659
- 28,000
- 2,180
naw, posting the, I've got this info but I'm not going to let you see it mode. Like it does with the thousands of experiments that show the 120 PPM of CO2 lab results.I can tell by the gaps that mamooth ( the poo flinging monkey that I have on ignore) has been around. Does he have an explanation as to why two different scales for temperature were used in that graph? Or is he still just ranting about conspiracy theories?
It would even make more sense if one of the series was displayed in degrees F and the other in Celsius. But to display them both in Celcius but on different scales just means they were hesitant to show the comparison.
Thanks jc456. It is incredible that those jokers can even believe that there is a possibility of a legitimate reason for that dual scaled graph. It's always the same. No matter how obvious the mistake they always defer to authority and think everyone else should too. Either they were too lazy to regraph both series to the same scale, or they were trying to hide the comparison. Both options show poor character on the part of the authors and incompetence on the part of the reviewers. Then you have to add in the authors reluctance of the authors to release the digital information of that graph until a complaint was lodged with the journal.
When are people going to wake up to the fact that certain factions of climate science are making a mockery of science? Who peer reviewed this paper? Michael Mann?
When are people going to wake up to the fact that certain factions of climate science are making a mockery of science? Who peer reviewed this paper? Michael Mann?
still no warmers out there who are willing to educate me on why that paper's graph plotted two temperature series on top of each other but with two different scales? doesnt surprise me. none of the warmers are willing to actually state that they agree with M Mann's use of the upsidedown Tiljander cores either, but they sure are willing to link up to papers containing the error (fraud is closer to the truth). BTW the change in Pages2K is mostly attributable to one similar type of proxy that was originally used upside down. there is still another proxy from the same area, giving almost identical results, that is still being used upsidedown. errors get corrected very slowly in climate science when the change is in the wrong direction and embarrasssing.
My, my. The Mann graph has been confirmed by more than a dozen independent studies by many scientists.
What evidence is there for the hockey stick
Figure 3: Global surface temperature change over the last five centuries from boreholes (thick red line). Shading represents uncertainty. Blue line is a five year running average of HadCRUT global surface air temperature (Huang 2000).
Notice that the differant lines are from differant scientific studies? Not just Mann.
Now, if you wish, I can go to Google Scholar and present a whole bunch of papers confirming the above. Would you like me to do that?
thanks Rocks! I had been meaning to look into boreholes for a while now, and you lead me into a great topic.
first I looked at the provenance of this graph and the ridiculous uncertainty of the borehole portion of the graph. I checked out lots of papers on boreholes (non paywalled).
I remembered seeing a different graph, and luckily I found it

--caption--The three curves show the data with different weights assigned to it, the red being the strongest and the blue being the weakest that the authors think is merited
how odd! same authors, 3 years apart?
in true climate science fashion here is a note from the author of that graph when he tried to get the data-
Just Facts wrote to Shaopeng Huang to obtain the data shown in Figure 2, but he informed us that he would be out of the country for a few months and thus unable to provide it. Hence, we obtained the data from Ross McKitrick (on 6/22/11), who had obtained it from Huang at an earlier date. The curves produced by this data visually match the curves in Figure 2 of the paper.
what could make such a big difference? ahhh, I think I found it. 1997- over six thousand samples, 2000- just 600. the old cherrypicking trick. if I just use 10% of the data, I can make it say just about anything trick. sound familiar? it should.
after jumping around for a while longer I found out that there was a third graph by the same guys in 2008! and they arent much of a match either.
hahahahahaha. crick and old rocks have unshakeable faith in the accuracy and precision of proxies. I dont. of course climate science politics may have had something to do with the 'evolution' of borehole temps.
http://www-personal.umich.edu/~shaopeng/97GL01846.pdf
A comparison of five different analyses in the interpretation of five borehole temperature data sets
http://www.grida.no/climate/ipcc_tar/wg1/pdf/TAR-02.pdf page 132 figure 2.19
Reconstruction of remote climate changes from borehole temperatures
Climate change of the last 2000 years inferred from borehole temperatures data from Finland
Climate changes of the last millennium inferred from borehole temperatures Results from the Czech Republic Part I
http://www.ldeo.columbia.edu/~peter/Resources/Seminar/readings/Huang_boreholeTemp_Nature'00.pdf
The message from boreholes JoNova
Global Warming - Just Facts interesting webpage
some of the links left up, mostly pdfs
bump for Old Rocks (and Orogenicman, if that isnt redundant)
as usual Old Rocks ignores anything that has been previously discussed, and acts like it never happened.
orogenicman
Darwin was a pastafarian
- Jul 24, 2013
- 8,546
- 834
- 175
For Crick- New Pages2k Data Paper Page 8 US Message Board - Political Discussion Forum
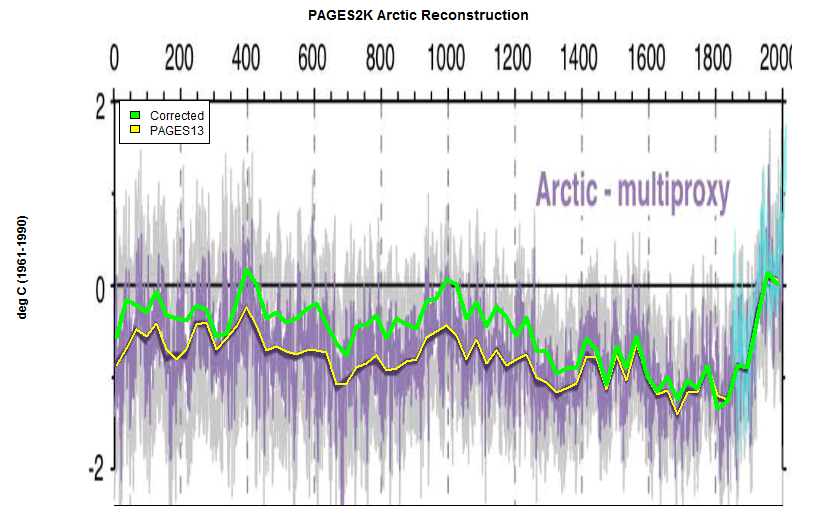
that is the graph of the data (data which had to be forced from the authors by the journal) which appears in old rocks' linked graph at the bottom, with two scales both in degrees Celcius.

which one is clearer? how can this type of bulllshit keep getting repeated over and over again, year after year? where are the adults in climate science, and when will they say enough is enough?
I have a question for you, Ian? If McInTyre's graphs, above, are valid, as you suggest, why has he not bothered to submit them in the appropriate scientific paper format to a peer reviewed scientific journal?
For Crick- New Pages2k Data Paper Page 8 US Message Board - Political Discussion Forum
that is the graph of the data (data which had to be forced from the authors by the journal) which appears in old rocks' linked graph at the bottom, with two scales both in degrees Celcius.
which one is clearer? how can this type of bulllshit keep getting repeated over and over again, year after year? where are the adults in climate science, and when will they say enough is enough?
I have a question for you, Ian? If McInTyre's graphs, above, are valid, as you suggest, why has he not bothered to submit them in the appropriate scientific paper format to a peer reviewed scientific journal?
you seldom get published for making incremental corrections to an existing paper. if you read the rest of the thread (I think it is in here, or perhaps the thread directed at Crick) there has been yet another corrigidem for the other proxy used upsidedown. the authors knew about both but only corrected the first, and then corrected the other unannouced a few months later with no modified graphs. embarrasing results get little attention.
orogenicman
Darwin was a pastafarian
- Jul 24, 2013
- 8,546
- 834
- 175
For Crick- New Pages2k Data Paper Page 8 US Message Board - Political Discussion Forum
that is the graph of the data (data which had to be forced from the authors by the journal) which appears in old rocks' linked graph at the bottom, with two scales both in degrees Celcius.
which one is clearer? how can this type of bulllshit keep getting repeated over and over again, year after year? where are the adults in climate science, and when will they say enough is enough?
I have a question for you, Ian? If McInTyre's graphs, above, are valid, as you suggest, why has he not bothered to submit them in the appropriate scientific paper format to a peer reviewed scientific journal?
you seldom get published for making incremental corrections to an existing paper. if you read the rest of the thread (I think it is in here, or perhaps the thread directed at Crick) there has been yet another corrigidem for the other proxy used upsidedown. the authors knew about both but only corrected the first, and then corrected the other unannouced a few months later with no modified graphs. embarrasing results get little attention.
The only climate-based paper McInTyre ever published was a correction to an existing paper that was later shown to have no effect on that paper's conclusion. Perhaps his failure with that paper, in addition to the fact that he isn't a real scientist, is the real reason he doesn't bother to publish his "results". Sorry, Ian, but if he can't be bothered to publish his work, I can't be bothered to accept it as credible work.
what would you be willing to wager that I cannot prove your last statement is incorrect?
will you publically admit you were wrong and put yourself into exile from posting for a certain amount of time? any amount of time, as long as you publically give the reason for it. even one second.
will you publically admit you were wrong and put yourself into exile from posting for a certain amount of time? any amount of time, as long as you publically give the reason for it. even one second.
orogenicman
Darwin was a pastafarian
- Jul 24, 2013
- 8,546
- 834
- 175
what would you be willing to wager that I cannot prove your last statement is incorrect?
will you publically admit you were wrong and put yourself into exile from posting for a certain amount of time? any amount of time, as long as you publically give the reason for it. even one second.
What are you blathering on about?
You said McIntyre has one climate science paper. I have shown you this is false in the past. Rather than just disprove you again, I want you to man up and admit you are wrong this time. Are you willing to publically announce you are wrong if I can prove you made a false statement?
orogenicman
Darwin was a pastafarian
- Jul 24, 2013
- 8,546
- 834
- 175
what would you be willing to wager that I cannot prove your last statement is incorrect?
will you publically admit you were wrong and put yourself into exile from posting for a certain amount of time? any amount of time, as long as you publically give the reason for it. even one second.
What are you blathering on about?
You said McIntyre has one climate science paper. I have shown you this is false in the past. Rather than just disprove you again, I want you to man up and admit you are wrong this time. Are you willing to publically announce you are wrong if I can prove you made a false statement?
He has published ONE peer reviewed paper on climate change. And it was a ridiculous one that was very quickly and easily shown to be irrelevant. He is not a scientist, and in fact, his professional work has been almost exclusively in mining, not climate science.
- Dec 18, 2013
- 136,659
- 28,000
- 2,180
of course he does.So you decline the challenge?
of course he does.So you decline the challenge?
He is like Old Rocks. He convenient ly forgets the last time he was shown something and demands it to be proven over and over again.
Actually I think he is Old Rocks.
Similar threads
- Replies
- 114
- Views
- 2K
- Replies
- 10
- Views
- 1K
- Replies
- 61
- Views
- 880
Forum List
-
-
-
-
-
Political Satire 8087
-
-
-
-
-
-
-
-
-
-
-
-
-
-
-
-
-
-
-
ObamaCare 781
-
-
-
-
-
-
-
-
-
-
-
Member Usernotes 471
-
-
-
-
-
-
-
-
-
-