
Billy_Bob
Diamond Member
Globally, the incidence of severe storms and their severity has increased. Talking about Atlantic hurricanes in the face of that data is just like claiming your cold day in late November refutes global warming.
BULLSHIT!!!
View attachment 87026
You alarmists are so full of shit your rolling in it..
Heat content variability in the North Atlantic Ocean in ocean reanalyses - Häkkinen - 2015 - Geophysical Research Letters - Wiley Online Library
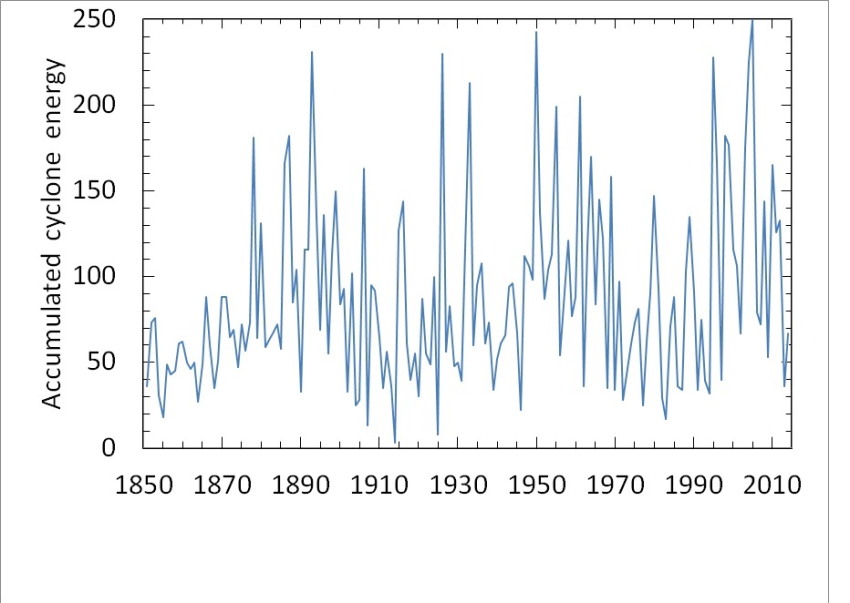
Atlantic Basin, 1850-2014
Atlantic hurricane seasons, 1950–2016
For the current season or the season that just ended, the ACE is preliminary based on National Hurricane Center bulletins, which may later be revised.
Season ACE TS HU MH Classification
1950 Atlantic hurricane season 211 16 11 6 Above normal (hyperactive)
1951 Atlantic hurricane season 137 10 8 5 Above normal
1952 Atlantic hurricane season 87 7 6 3 Near normal
1953 Atlantic hurricane season 104 14 6 4 Near normal
1954 Atlantic hurricane season 113 11 8 2 Near normal
1955 Atlantic hurricane season 199 12 9 6 Above normal (hyperactive)
1956 Atlantic hurricane season 54 8 4 2 Below normal
1957 Atlantic hurricane season 84 8 3 2 Near normal
1958 Atlantic hurricane season 121 10 7 5 Above normal
1959 Atlantic hurricane season 77 11 7 2 Near normal
1960 Atlantic hurricane season 88 7 4 2 Near normal
1961 Atlantic hurricane season 205 11 8 7 Above normal (hyperactive)
1962 Atlantic hurricane season 36 5 3 1 Below normal
1963 Atlantic hurricane season 118 9 7 2 Near normal
1964 Atlantic hurricane season 170 12 6 6 Near normal
1965 Atlantic hurricane season 84 6 4 1 Below normal
1966 Atlantic hurricane season 145 11 7 3 Above normal
1967 Atlantic hurricane season 122 8 6 1 Near normal
1968 Atlantic hurricane season 35 8 4 0 Below normal
1969 Atlantic hurricane season 158 18 12 5 Above normal (hyperactive)
1970 Atlantic hurricane season 34 10 5 2 Below normal
1971 Atlantic hurricane season 97 13 6 1 Near normal
1972 Atlantic hurricane season 28 7 3 0 Below normal
1973 Atlantic hurricane season 43 8 4 1 Below normal
1974 Atlantic hurricane season 61 11 4 2 Below normal
1975 Atlantic hurricane season 73 9 6 3 Near normal
1976 Atlantic hurricane season 81 10 6 2 Near normal
1977 Atlantic hurricane season 25 6 5 1 Below normal
1978 Atlantic hurricane season 62 12 5 2 Below normal
1979 Atlantic hurricane season 91 9 5 2 Near normal
1980 Atlantic hurricane season 147 11 9 2 Near normal
1981 Atlantic hurricane season 93 12 7 3 Near normal
1982 Atlantic hurricane season 29 6 2 1 Below normal
1983 Atlantic hurricane season 17 4 3 1 Below normal
1984 Atlantic hurricane season 71 12 5 1 Near normal
1985 Atlantic hurricane season 88 11 7 3 Near normal
1986 Atlantic hurricane season 36 6 4 0 Below normal
1987 Atlantic hurricane season 34 7 3 1 Below normal
1988 Atlantic hurricane season 103 12 5 3 Near normal
1989 Atlantic hurricane season 135 11 7 2 Near normal
1990 Atlantic hurricane season 91 14 8 1 Near normal
1991 Atlantic hurricane season 34 8 4 2 Below normal
1992 Atlantic hurricane season 75 7 4 1 Below normal
1993 Atlantic hurricane season 39 8 4 1 Below normal
1994 Atlantic hurricane season 32 7 3 0 Below normal
1995 Atlantic hurricane season 228 19 11 5 Above normal (hyperactive)
1996 Atlantic hurricane season 166 13 9 6 Above normal (hyperactive)
1997 Atlantic hurricane season 40 7 3 1 Below normal
1998 Atlantic hurricane season 182 14 10 3 Above normal (hyperactive)
1999 Atlantic hurricane season 177 12 8 5 Above normal (hyperactive)
2000 Atlantic hurricane season 116 15 8 3 Above normal
2001 Atlantic hurricane season 106 15 9 4 Near normal
2002 Atlantic hurricane season 67 12 4 2 Near normal
2003 Atlantic hurricane season 175 16 7 3 Above normal (hyperactive)
2004 Atlantic hurricane season 225 15 9 6 Above normal (hyperactive)
2005 Atlantic hurricane season 250 28 15 7 Above normal (hyperactive)
2006 Atlantic hurricane season 79 10 5 2 Near normal
2007 Atlantic hurricane season 72 15 6 2 Near normal
2008 Atlantic hurricane season 144 16 8 5 Above normal
2009 Atlantic hurricane season 53 9 3 2 Below normal
2010 Atlantic hurricane season 165 19 12 5 Above normal (hyperactive)
2011 Atlantic hurricane season 126 19 7 4 Above normal
2012 Atlantic hurricane season 133 19 10 2 Above normal
2013 Atlantic hurricane season 36 14 2 0 Below normal
2014 Atlantic hurricane season 67 8 6 2 Near normal
2015 Atlantic hurricane season 63 11 4 2 Below normal
2016 Atlantic hurricane season 17 7 3 0 Currently active
Studies of ocean heat content (OHC) show warming of the global oceans over the last 60 years. The OHC variability is significant globally and thought to represent some 93% of the heating of the Earth over the past 60 years [Levitus et al., 2000, 2012; Abraham et al., 2013]. The North Atlantic contribution is roughly 30% of the 50 year global OHC trend; together, the North and South Atlantic are thought to account for about 50% of the global trend. Levitus et al. [2012] attribute the trend to global warming, with the subtropical enhancement caused by uneven distribution of the warming. Global analysis of the trend 1950 to 2008 by Durack and Wijffels [2010] shows a dominating freshening (cooling) in the North Pacific but salinization (warming) of the subtropics in the upper 500 m in the North Atlantic. They argue that the migration of density surfaces is an important component of the salinity trends. Other studies, e.g., Lozier et al. [2008] show the warming occurring mainly in the subtropics but cooling in the subpolar gyre. They attribute this long-term trend from 1950–1970 to 1980–2000 to the North Atlantic Oscillation (NAO) while noting that the global warming signal is not obvious in their analysis. Williams et al. [2014] continued this work to separate temporal and spatial structure of the North Atlantic OHC into Ekman and Atlantic meridional overturning circulation (AMOC) contributions. They show that OHC anomalies in the subtropical and subpolar gyres are dominated by heat transport convergence.
There is significant decadal variability in OHC, which complicates the view of a simple linear trend, and this makes discussion of mechanisms and pathways of warming difficult. The most recent decade has seen the global warming signal (from surface air temperatures) undergoing a hiatus, which has been explained by some authors as increased uptake of heat by the deep ocean [Meehl et al., 2011; Balmaseda et al., 2013a;Kosaka and Xie, 2013; England et al., 2014]. These authors attribute the hiatus to La Niña and Pacific decadal variability enhancing subduction of warm waters and upwelling of cold waters, but the Atlantic Ocean also shows similar behavior of increased deep ocean heat uptake during hiatus periods [Meehl et al., 2011; Balmaseda et al., 2013a].
Several studies argue why the North Atlantic displays the largest localized warming. One possibility is the internal dynamics related to the AMOC. Palmer et al. [2007] analyzed observations to derive heat content above the 14°C isotherm. They observe an increased heat convergence in the Atlantic sector which is compensated by heat divergence elsewhere. This leads them to suggest increased AMOC as the cause of enhanced increase of OHC in the Atlantic. A model study of Grist et al. [2010] shows a dominant contribution of AMOC to OHC variability in the upper 500 m across the North Atlantic extending to 30°S. Also, Lee et al. [2011] have suggested based on numerical simulation that increased South Atlantic MOC and increased Agulhas leakage have made the North Atlantic warming trend larger than in any other basin.
We consider aspects of the North Atlantic warming in the top 700 m and 2000 m of the water column. We will explore the role of vertical migration of isopycnal surfaces (“heaving”), which turns out to have a dominant role in the upper ocean heat content changes. This investigation uses the approach of Bindoff and McDougall [1994] to define heat content change in terms of isopycnal heaving and water mass formation contributions. However, we emphasize that “heaving” does not necessarily imply adiabatic vertical movement of waters forced, for example, by changes in atmospheric winds. Heaving of isopycnals can also arise from changes in the rate of water mass renewal. Changes in the temperature and salinity contributions to the density can occur for many reasons, notably atmospheric heat and fresh water flux, and these may or may not conform to the θ/S relation of the prior ocean state.
Heat is but one component and the level of heat currently is low. You think that heat alone is what causes cyclonic function and that assumption is patently false. Even the so called increasing of water vapor in the tropics, the hypothetical increase with increasing air temp has been shown false. Surface water tension (salinity) is a bigger player than 1-3 deg C of temperature rise is.
Crick really doesn't have a dam clue about how the system works or why...

