boedicca
Uppity Water Nymph from the Land of Funk
- Feb 12, 2007
- 59,734
- 24,710
- 2,290
I KNOW what the LFPR rate for that cohort is......I already told you, but you aren't equipped to do the math...GDP is the sum of Consumption (C), Investment (I), Government Spending (G) and Net Exports (X – M): Y = C + I + G + (X - M).As a matter of fact, I do. And it's NOT government "investment".
If it were, then 2008 would have been a much much much better than the "superior" economy of the Obama era about which you've been crowing.
Speaking of crow, your pie is ready. Eat up, bub.
Don't breed....
Investment is not the same as Government Spending, moron.
Calling you a cretin is an insult to Bripat...
U.S. Bureau of Economic Analysis (BEA)
Let me know if you need help.....
You're the one who needs help, you blithering moron.
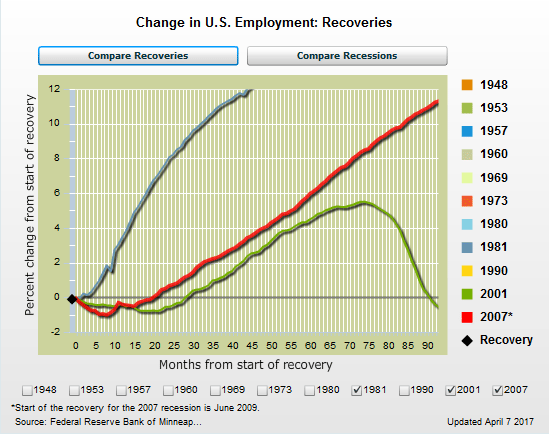
View attachment 76795
No, Demographics Are Not The Reason For Labor Force Dropouts
And you can find the LFRP data by age cohorrt here:
U.S. Bureau of Labor Statistics
Civilian labor force participation rate by age, gender, race, and ethnicity
and you are citing some douche from the federalist?
Declining Labor Participation Rates
I linked to the source data from BLS.gov, moron.