I just finished some research. I think I have an answer. Gallup rated voter intensity for Democrat or lean Democrat on election day 2012 at + 7.5% The final margin was somewhere around 7%...so they were very close.
As of 1-8-14 they put the Democrat or lean Democrat at +5%. This data is exactly in line with other analysis I have seen recently. To put this in perspective....if the Romney/Obama election were held today it would be a virtual tie.
I do not know how each polling agency is weighting their data by party affiliation other than Gallup. Rassmussen will not tell you unless you pay them a fee. I am not going to do that.
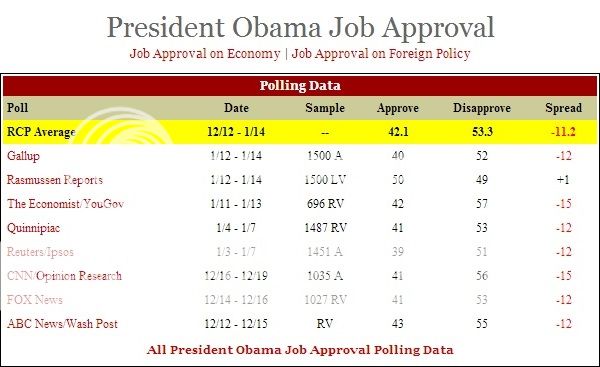
Right now Gallup has Obama approve/disapprove at 39% - 53%. CNN is weighted around 5.5% Dem Lean Dem as of a month ago. They have Obama at 41% -56%
CNN also has the generic Congressional Ballot at Republican +5%. My guess is Gallup and CNN are pretty close and Rasmussen is a significant outlier.
RealClearPolitics - Election Other - 2014 Generic Congressional Vote
Thank you for adding this data. Good work.
I do want to point out some things for you all to chew on:
1.) Congressional ballot measurement is not the same as approval/disapproval, which, in turn, is not the same as favorability/disfavorability, so it is entirely possible to come up very different values for all three. Even with very high fav numbers for him personally, Eisenhower's Republican party suffered massive losses in the 1958 mid-terms.
2.) Your summation about the 2012 is correct, which only impugnes Gallup's reputation even more. If D +4 would have been enough to make 2012 a virtual tie, and Gallup was showing for weeks on end that Romney was up by as much as +6, then this can only mean that not only within the Gallup Model, which was based on 78% white vote instead of the actual 72% that came out, it must have used a party identification of at least R +1, which is about as false as false can get. Because of that 6% shift in the white vote, Obama still would have gotten 2.5% of that 6%, had it been 78% of the electorate.
3.) Just to show how unbelievably wrong Gallup
also was in 2010, in the last mid-terms, on the eve of the Mid-terms, it showed
R +15 in the congressional ballot (55-40)
Gallup.Com - 2010 Congressional Midterm Elections
Actual results?
IN the House of Representatives, it was
R +6.8
United States House of Representatives elections, 2010 - Wikipedia, the free encyclopedia
In the Senate, it was
R +5.7
http://uselectionatlas.org/RESULTS/data.php?year=2010&datatype=national&def=1&f=1&off=3&elect=0
Combined, it was a total of 153,397,897 votes cast.
R total:
78,009,816 (50.85%)
D total:
68,476,144 (44.64%)
Combined margin:
R +6.21
So, essentially, Gallup was off by NINE FULL points in 2010.
That is just plain old criminal.
4.) In the year of a possible GOP wave, expect party identification to shift more toward the GOP and also expect the generic to move to at least a tie, if not R+1 to R+5. We are not seeing that yet because most people are not like the political junkies here in USMB, they don't even care about the elections yet.
Hope that data helps.
Once again, nice job, [MENTION=45104]WelfareQueen[/MENTION]

")