daveman
Diamond Member
What was that range?The temperature range under which Homo Sapiens has been living for the last 200,000 years up to about 1870. Good enough?
Follow along with the video below to see how to install our site as a web app on your home screen.
Note: This feature may not be available in some browsers.
What was that range?The temperature range under which Homo Sapiens has been living for the last 200,000 years up to about 1870. Good enough?
I love it... "new data sets prove"...
The new global temperature data sets, which come from three of the world’s top climate research institutions, are packed with alarming signs of a world in crisis. More than two dozen countries that are home to about 1.8 billion people experienced their warmest years ever last year. July was the hottest month humanity has recorded. The heat dome that seared the Pacific Northwest this past summer was “the most anomalous extreme heat event ever observed on Earth,” in the words of one scientist — a disaster so severe that it would have been virtually impossible in a world without climate change.
[snip]
The year 2021 was the seventh in a row in which global temperatures were more than 1 degree Celsius above the preindustrial average. It’s unlikely anyone alive will see the world’s temperature drop below that 1-degree benchmark again.
“There is no going back,” said Schmidt, director of the NASA Goddard Institute for Space Studies and a lead researcher on the agency’s annual temperature analysis. The roughly 1.5 trillion tons of carbon dioxide emitted by humans — more than half of it in the 34 years since Hansen’s testimony — will not leave the atmosphere for at least several more centuries.
Maybe it's time to invest in some real estate in Iceland or Greenland...
You "Conservatives" are always the poor little piss ant victims. You do realize we are #2 after China?


And of course all the previous years generally rising and also in the 21st Century with the exception of 1998.
$76 trillion!!!
The new global temperature data sets, which come from three of the world’s top climate research institutions, are packed with alarming signs of a world in crisis. More than two dozen countries that are home to about 1.8 billion people experienced their warmest years ever last year. July was the hottest month humanity has recorded. The heat dome that seared the Pacific Northwest this past summer was “the most anomalous extreme heat event ever observed on Earth,” in the words of one scientist — a disaster so severe that it would have been virtually impossible in a world without climate change.
[snip]
The year 2021 was the seventh in a row in which global temperatures were more than 1 degree Celsius above the preindustrial average. It’s unlikely anyone alive will see the world’s temperature drop below that 1-degree benchmark again.
“There is no going back,” said Schmidt, director of the NASA Goddard Institute for Space Studies and a lead researcher on the agency’s annual temperature analysis. The roughly 1.5 trillion tons of carbon dioxide emitted by humans — more than half of it in the 34 years since Hansen’s testimony — will not leave the atmosphere for at least several more centuries.
Maybe it's time to invest in some real estate in Iceland or Greenland...

I've explained numerous times INCLUDING in my post above.Liar ... the period 1940-1980 shows cooling of 0.3ºC {NOAA Cite} ... yet 1958-1980 shows increasing carbon dioxide concentration of 25 ppm {Wikipedia Cite} ...
More CO2 lead to lower temperatures ... care to explain? ...

I've explained numerous times INCLUDING in my post above.
YOU are the Liar/deceiver/Denier.
There are many cycles within the larger Trend, OF COURSE. 11 Year solar cycles, el Ninos, etc.
Not to mention no large natural trend goes straight up.
If I point out the stock market on average rise 7-8% a year, you can no doubt point to bad decades or even 20 year periods when this is contradicted.
Does not change the FACT.
Go it now @sshole?
You do but your politics are SICK and brainwashed.
Here's a link for you, YOU dum pos.
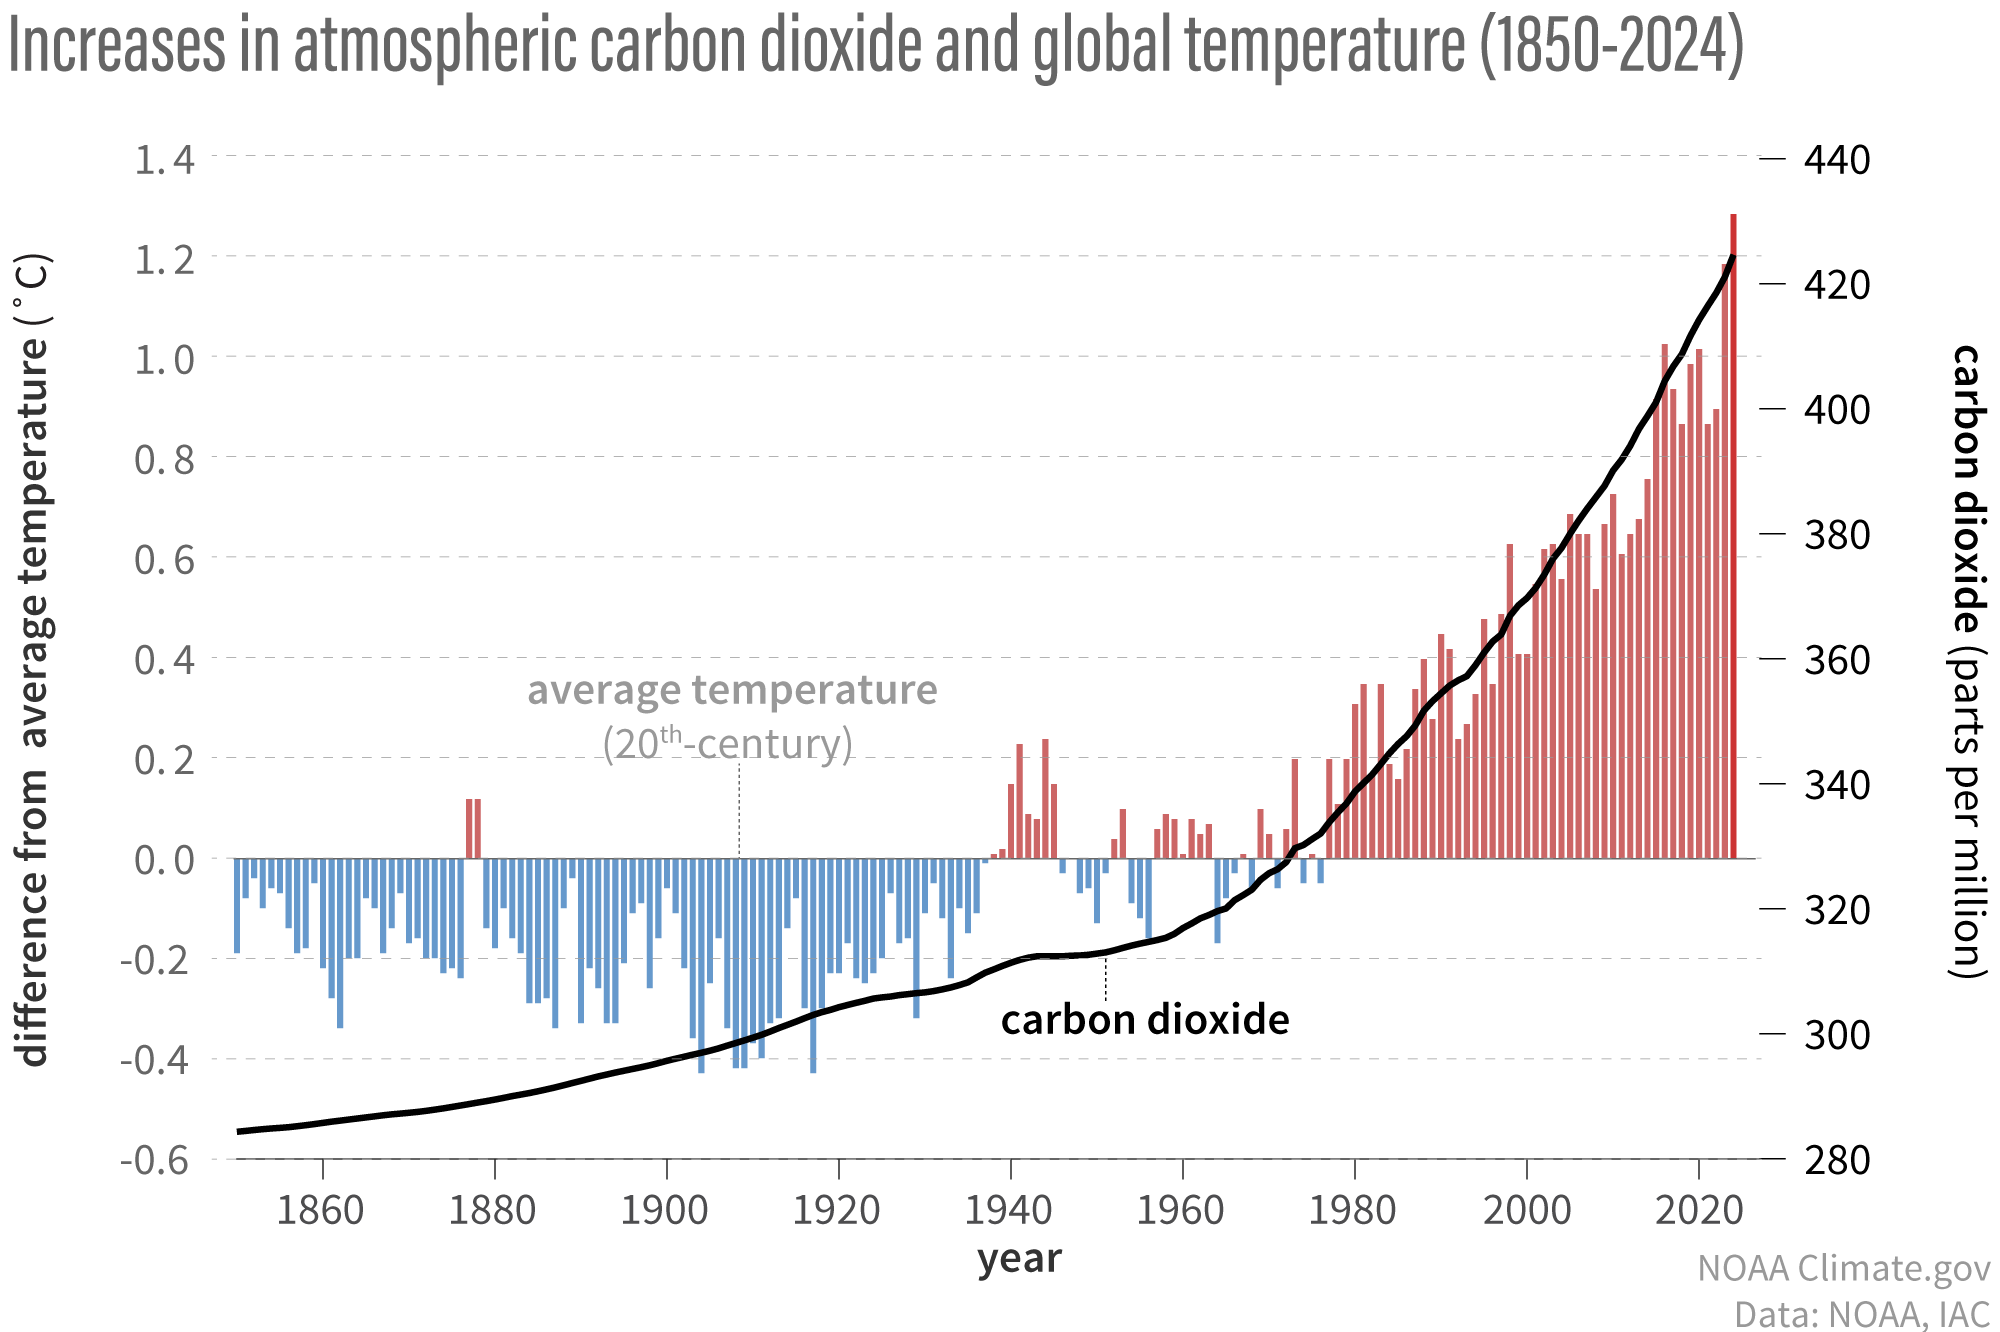
If carbon dioxide hits a new high every year, why isn’t every year hotter than the last?NOVEMBER 23, 2021NOAA/Climate.govJust like your car doesn’t reach top speed the instant you step on the gas, Earth’s temperature doesn’t react instantly to each year’s new record-high carbon dioxide levels. Thanks to the high heat capacity of water and the huge volume of the global oceans, Earth’s surface temperature resists rapid changes. Said another way, some of the excess heat that greenhouse gases force the Earth’s surface to absorb in any given year is hidden for a time by the ocean. This delayed reaction means rising greenhouse gas levels don’t immediately have their full impact on surface temperature. Still, when we step back and look at the big picture, it’s clear the two are tightly connected.As the graph above shows, both global temperature (colored bars) and atmospheric carbon dioxide (gray line) increased more slowly during the first half of the observational record in the late nineteenth and early twentieth centuries. Atmospheric carbon dioxide levels rose by around 20 parts per million over the 7 decades from 1880–1950, while the temperature increased by an average of 0.04° C per decade.Yearly temperature compared to the twentieth-century average (red and blue bars) from 1880–2019, based on data from NOAA NCEI, plus atmospheric carbon dioxide concentrations (gray line): 1880-1958 from IAC, 1959-2019 from NOAA ESRL. Original graph by Dr. Howard Diamond (NOAA ARL), and adapted by NOAA Climate.gov.Over the next 7 decades, however, carbon dioxide climbed nearly 100 ppm—5 times as fast! To put those changes in some historical context, the amount of rise in carbon dioxide levels since the late 1950s would naturally, in the context of past ice ages, have taken somewhere in the range of 5,000 to 20,000 years; we’ve managed to do it in about 60. At the same time, the rate of warming averaged 0.14° C per decade. The rapid rate of temperature rise over such a short period time points to only one thing, and that is the addition of greenhouse gases, primarily carbon dioxide, into the environment.Within any given decade, however, the temperature bounces around between warm and cool years. The warmest years are usually El Niño years, when the eastern and central tropical Pacific is warmer than average. The coldest years are generally La Niña years. On a longer time scale, warm decades are often associated with strongly positive phases of the Pacific Decadal Oscillation, and cool decades with strongly negative phases.[..........][..........][..........]""
global_temps_ENSO_yrs_1240.gif | NOAA Climate.gov
If carbon dioxide hits a new high every year, why isn’t every year hotter than the last?
Thanks to the global oceans, Earth's surface temperature doesn't react instantly to the full impact of a climate disturbance. That delayed reaction has pros and cons.www.climate.gov
You are Persistently Dishonest, or Partisan (or Stupld) and get this explained regularly but try to abuse it for political purpose.
`
EDIT:
Note the Picture Troll/Evolution denier CrusaderFrank's 3 Trolling/canned picture posts above.
He is NON-CONVERSANT on this topic/cannot carry a simple conversation.
`
Why do I need lab experiment?You can show us repeatable lab experiment that the temperature rises when CO2 rises and falls when CO2 is reduced? Really??
By how much must the USA reduce CO2 in order to combat global warming?
$76 Trillion!!
It's easy to claim every year is getting warmer when you adjust previous years' temperatures downward. For "science", of course.#1 NOAA, 10 Warmest years
Anyone think this is "Cooling?"

#2 From NOAA LINK: More Near-Record Warm Years Are Likely On Horizon

`
And of course all the previous years generally rising and also in the 21st Century with the exception of 1998.
Nobody gives a damn about methane emissions.Why do I need lab experiment?
Do you have one for the creation of the Solar System?
IAC, that's what scientists have been doing and how GHGs were discovered.
And they have done lab experiments to see how much each GHG blocks radiation from going back out into space.
That's how we know ie, that Methane is 80x more powerful than CO2 as a GHG.
Do you deny the DEFINITION of Greenhouse Gas and how they were found?
`
Could you possibly steer me towards where the thousands of scientists who USE that data on a professional basis are screaming about all their work being hosed by such changes?It's easy to claim every year is getting warmer when you adjust previous years' temperatures downward. For "science", of course.
Billy Boy, did you forget that time continues to flow on by and with every little bit of it, there are NEW DATA.I love it... "new data sets prove"...
Can you get any more obvious that they are made up from whole cloth? Please explain how they get a rise in global temperature when 72% of earth's surface is cooling rapidly? Ocean only temps are now -0.6 deg C below the 30 year average. All temps are sitting at the zero line for the 30 year average. Not buying this load of crap. The observe empirical evidence says this is not happening.
Wow, you are way more stupid than I had ever imagined. Or perhaps just more dishonest.Yet, the solution is to create the largest industry in the world producing more stuff than ever manufactured before, calling it green energy.
Yep, scare the hell out of the public with lies than get filthy rich providing the solution, building more than man has built since the beginning of time.
What was that range?
Could you possibly steer me towards where the thousands of scientists who USE that data on a professional basis are screaming about all their work being hosed by such changes?
 What makes you think they'd be upset about it?