abu afak
ALLAH SNACKBAR!
- Mar 3, 2006
- 8,129
- 2,823
- 315
I've already debunked the point. (your only one)NOAA doesn't agree with you ... your understanding of the material is lacking ... the data I'm using comes from NOAA ... I've seen you use the exact same data many many times ... you're just too stupid to see temperatures peaking around 1940 and then falling to around 1980 ...
(my post #57 in This thread shut you up for all but a one sentence quip)
We did have a temp spike, then dip, (a sub-cycle of some sort) but it started going back up HALFWAY through your Ignorant "40 year" claim.
You LOSE Every time we have this same debate you illiterate/illogical Fraud.
And NOAA agrees with me 100%.
Only a true 12 IQ Idiot would foist NOAA doesn't agree with AGW!
No one else here even tries that IDIOCY.
They say (have to try) that NOAA is wrong or the numbers they are using are wrong. (or not 'Raw')
ONLY You attempt the blatant LIE that NOAA and their chart doesn't agree with me.
The chart in question is a NOAA chart and used AS JUSTIFICATION For AGW.
What evidence exists that Earth is warming and that humans are the main cause?
There is overwhelming scientific evidence that Earth is warming and a preponderance of scientific evidence that human activities are the main cause.
Climate.govSCIENCE & INFORMATION FOR A CLIMATE-SMART NATION
What Evidence exists that Earth is Warming and that Humans are the Main Cause?
BY DAVID HERRING AND REBECCA LINDSEY
OCTOBER 29, 2020 UPDATED SEPTEMBER 27, 2021
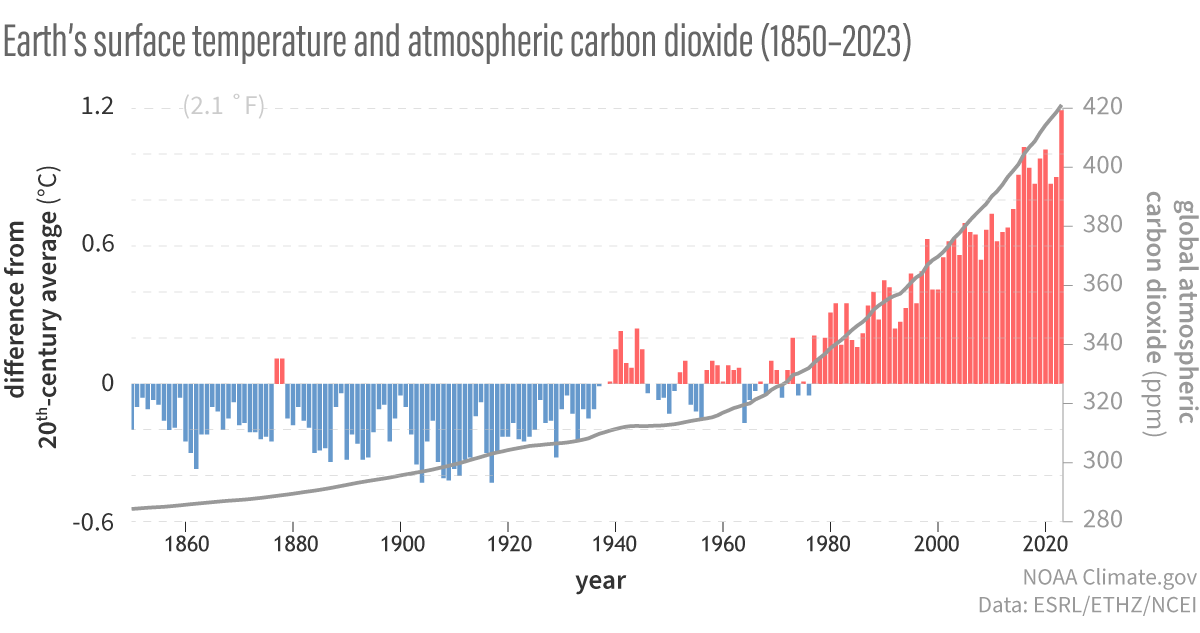
We know the world is warming because people have been recording daily high and low temperatures at thousands of weather stations worldwide, over land and ocean, for many decades and, in some locations, for more than a century. When different teams of climate scientists in different agencies (e.g., NOAA and NASA) and in other countries (e.g., the U.K.’s Hadley Centre) average these data together, they all find essentially the same result: Earth’s average surface temperature has risen by about 1.8°F (1.0°C) since 1880.

Yearly temperature compared to the twentieth-century average (red and blue bars) from 1880–2019, based on data from NOAA NCEI, plus atmospheric carbon dioxide concentrations (gray line): 1880-1958 from IAC, 1959-2019 from NOAA ESRL. Original graph by Dr. Howard Diamond (NOAA ARL), and adapted by NOAA Climate.gov.
In addition to our surface station data, we have many different lines of evidence that Earth is warming (learn more). Birds are migrating earlier, and their migration patterns are changing. Lobsters and other marine species are moving north. Plants are blooming earlier in the spring. Mountain glaciers are melting and snow cover is declining in the Northern Hemisphere (Learn more here and here). Greenland’s ice sheet—which holds about 8 percent of Earth’s fresh water—is melting at an accelerating rate (learn more). Mean global sea level is rising (learn more). Arctic sea ice is declining rapidly in both thickness and extent (learn more).
[............]
[............]
[............]
-----
!n fact/!ronically only I have used Science/Physics in My explanation, including yesterday, in my brief summary of the Debate/AGW when asked by a different opponent/TROLL.
ie
Me:
"Past climate cycles were driven by Solar Forcing but not this one. It's unprecedented because the Human Industrial revolution has poured GHGs into the atmosphere at [increasingly] staggering rates.
CO2 and other GHGs typically trail and exacerbate Warming after a solar forcing/astronomical/tilting event.[/B]
NOT the case now.[/B]
They are perfectly capable of causing warming as they are now/almost uniquely.
Scientists have measured Radiation-in/Radiation-out.
Radiation-in has NOT changed in at least 50 years.
Radiation-out back into space is being blocked by the increasingly thick GHG blanket and at the exact spectral wavelengths of those GHG gases.
That's about the best, but not only, of many reasons we now this is AGW.""
Your "physics" OTOH, (which are not even really needed providing one understands what a GHG is) are not very useful here, except in the degree I have used them above.
You just Name Drop irrelevant Physics 101 terms!
But you are still down 40 IQ points to this math, statistics, Symbolic/Visual logic specialist. (and Mensa and Intertel/the-group-above-Mensa) member
You are a Political CLOWN. No more.
You Can't debate ME!!!! (not to mention the Climate science overwhelming Consensus on the issue)
In fact rookie, I waited to respond to grab the page top. Being tactically much more clever as well.
noblesse oblige
`
Last edited:
