Navigation
Install the app
How to install the app on iOS
Follow along with the video below to see how to install our site as a web app on your home screen.
Note: This feature may not be available in some browsers.
More options
Style variation
You are using an out of date browser. It may not display this or other websites correctly.
You should upgrade or use an alternative browser.
You should upgrade or use an alternative browser.
The Hottest Day in History Just Occurred
- Thread starter mamooth
- Start date
mamooth
Diamond Member
- Thread starter
- #263
No, it wouldn't. The increase in greening on earth stopped in the 1990s. A little more CO2 initially helped, but that effect was saturated long ago, and more CO2 now does nothing.More CO2 in the atmosphere would enhance crop growth. It is a life giving gas.
CrusaderFrank
Diamond Member
- May 20, 2009
- 163,218
- 89,862
- 2,645
Frank thinks that a beaker in a lab behaves exactly the same as the whole planet.
Frank is a special kind of stupid.
^ Sociopathic Cultists thinks we bellllleeeeveeee his ******* fake "doubling CO2 causes temperatures to rise 3F" or whatever made up number it is
Cult: Doubling CO2 from 250 to 500 raises temperature so much all life on Earth will die!!
Normal People: Can you show us in a lab how increasing CO2 at these deminimus levels increases temperatures, I mean at all, much less by 1.5C?
Cult: Denier! You stupid Denier! How dare you question the power of CO2??!! It happens - because we say so!
jc456
Diamond Member
- Dec 18, 2013
- 160,703
- 40,235
- 2,180
Cause you seem awfully focused on 150It does.
Why are you saying it doesn't? Do you understand how stupid that makes you all look when you claim it doesn't?
^ Sociopathic Cultists thinks we bellllleeeeveeee his ******* fake "doubling CO2 causes temperatures to rise 3F" or whatever made up number it is
Cult: Doubling CO2 from 250 to 500 raises temperature so much all life on Earth will die!!
Normal People: Can you show us in a lab how increasing CO2 at these deminimus levels increases temperatures, I mean at all, much less by 1.5C?
Cult: Denier! You stupid Denier! How dare you question the power of CO2??!! It happens - because we say so!
Testing the latest estimated ECS and TCR
HERE FRANK. HERE'S HOW THEY "MAKE UP" THOSE NUMBERS IN AR6
TS.3.2 Climate Sensitivity and Earth System Feedbacks
TS.3.2.1 Equilibrium Climate Sensitivity, Transient Climate
Response, and Transient Climate Response to
Cumulative Carbon-dioxide Emissions
Since AR5, substantial quantitative progress has been made in combining new evidence of Earth’s climate sensitivity with improvements in the understanding and quantification of Earth’s energy imbalance, the instrumental record of global surface temperature change, paleoclimate change from proxy records, climate feedbacks and their dependence on time scale and climate state. A key advance is the broad agreement across these multiple lines of evidence, supporting a best estimate of equilibrium climate sensitivity of 3°C, with a very likely range of 2°C to 5°C. The likely range of 2.5°C to 4°C is narrower than the AR5 likely range of 1.5°C to 4.5°C. {7.4, 7.5}
Constraints on equilibrium climate sensitivity (ECS) and transient climate response (TCR) (see Glossary) are based on four main lines of evidence: feedback process understanding, climate change and variability seen within the instrumental record, paleoclimate evidence, and so-called ‘emergent constraints’, whereby a relationship between an observable quantity and either ECS or TCR established within an ensemble of models is combined with observations to derive a constraint on ECS or TCR. In reports up to and including the IPCC Third Assessment Report, ECS and TCR derived directly from ESMs were the primary line of evidence. However, since AR4, historical warming and paleoclimates provided useful additional evidence (Figure TS.16a). This Report differs from previous reports in not directly using climate model estimates of ECS and TCR in the assessed ranges of climate sensitivity. {1.5, 7.5}
It is now clear that when estimating ECS and TCR, the dependence of feedbacks on time scales and the climate state must be accounted for. Feedback processes are expected to become more positive overall (more amplifying of global surface temperature changes) on multi-decadal time scales as the spatial pattern of surface warming evolves and global surface temperature increases, leading to an ECS that is higher than was inferred in AR5 based on warming over the instrumental record (high confidence). Historical surface temperature change since 1870 has shown relatively little warming in several key regions of positive feedbacks, including the eastern equatorial Pacific Ocean and the Southern Ocean, while showing greater warming in key regions of negative feedbacks, including the western Pacific warm pool. Based on process understanding, climate modelling, and paleoclimate reconstructions of past warm periods, it is expected that future warming will become enhanced over the eastern Pacific Ocean (medium confidence) and Southern Ocean (high confidence) on centennial time scales. This new understanding, along with updated estimates of historical temperature change, ERF, and energy imbalance, reconciles previously disparate ECS estimates. {7.4.4, 7.5.2, 7.5.3}
The AR6 best estimate of ECS is 3°C, the likely range is 2.5°C to 4°C and the very likely range is 2°C to 5°C. There is a high level of agreement among the four main lines of evidence listed above (Figure TS.16b), and altogether it is virtually certain that ECS is larger than 1.5°C, but currently it is not possible to rule out ECS values above 5°C. Therefore, the 5°C upper end of the very likely range is assessed with medium confidence and the other bounds with high confidence. {7.5.5}
Based on process understanding, warming over the instrumental record, and emergent constraints, the best estimate of TCR is 1.8°C, the likely range is 1.4°C to 2.2°C and the very likely range is 1.2°C to 2.4°C. There is a high level of agreement among the different lines of evidence (Figure TS.16c) (high confidence). {7.5.5}
On average, CMIP6 models have higher mean ECS and TCR values than the CMIP5 generation of models and also have higher mean values and wider spreads than the assessed best estimates and very likely ranges within this Report. These higher mean ECS and TCR values can be traced to a positive net cloud feedback that is larger in CMIP6 by about 20%. The broader ECS and TCR ranges from CMIP6 also lead the models to project a range of future warming that is wider than the assessed future warming range, which is based on multiple lines of evidence (Cross-Section Box TS.1). However, some of the high-sensitivity CMIP6 models (Section TS.1.2.2) are less consistent with observed recent changes in global warming and with paleoclimate proxy records than models with ECS within the very likely range. Similarly, some of the low-sensitivity models are less consistent with the paleoclimate data. The CMIP6 models with the highest ECS and TCRs values provide insights into lowlikelihood, high-impact futures, which cannot be excluded based on currently available evidence (Cross-Section Box TS.1). {4.3.1, 4.3.4, 7.4.2, 7.5.6}
Uncertainties regarding the true value of ECS and TCR are the dominant source of uncertainty in global temperature projections over the 21st century under moderate to high GHG concentrations scenarios. For scenarios that reach net zero CO2 emissions (Section TS.3.3), the uncertainty in the ERF values of aerosol and other SLCFs contribute substantial uncertainty in projected temperature. Global ocean heat uptake is a smaller source of uncertainty in centennial warming. {7.5.7} The transient climate response to cumulative CO2 emissions (TCRE) is the ratio between globally averaged surface temperature increase and cumulative CO2 emissions (see Glossary). This Report reaffirms with high confidence the finding of AR5 that there is a near-linear relationship between cumulative CO2 emissions and the increase in global average temperature caused by CO2 over the course of this century for global warming levels up to at least 2°C relative to 1850– 1900. The TCRE falls likely in the 1.0°C–2.3°C per 1000 PgC range, with a best estimate of 1.65°C per 1000 PgC. This is equivalent to a 0.27°C–0.63°C range with a best estimate of 0.45°C when expressed in units per 1000 GtCO2. This range is about 15% narrower than the 0.8°–2.5°C per 1000 PgC assessment of AR5 because of a better integration of evidence across chapters, in particular the assessment of TCR. Beyond this century, there is low confidence that the TCRE alone remains an accurate predictor of temperature changes in scenarios of very low or net negative CO2 emissions because of uncertain Earth system feedbacks that can result in further changes in temperature or a path dependency of warming as a function of cumulative CO2 emissions. {4.6.2, 5.4, 5.5.1}
TS.3.2.2 Earth System Feedbacks The combined effect of all climate feedback processes is to amplify the climate response to forcing (virtually certain). While major advances in the understanding of cloud processes have increased the level of confidence and decreased the uncertainty range for the feedback by about 50% compared to AR5, clouds remain the largest contribution to overall uncertainty in climate feedbacks (high confidence). Uncertainties in the ECS and other climate sensitivity metrics, such as the TCR and TCRE, are the dominant source of uncertainty in global temperature projections over the 21st century under moderate to high GHG emissions scenarios. CMIP6 models have higher mean values and wider spreads in ECS and TCR than the assessed best estimates and very likely ranges within this Report, leading the models to project a range of future warming that is wider than the assessed future warming range (Section TS.2.2). {7.1, 7.4.2, 7.5}
Earth system feedbacks can be categorized into three broad groups: physical feedbacks, biogeophysical and biogeochemical feedbacks, and feedbacks associated with ice sheets. In previous assessments, the ECS has been associated with a distinct set of physical feedbacks (Planck response, water vapour, lapse rate, surface albedo, and cloud feedbacks). In this assessment, a more general definition of ECS is adopted whereby all biogeophysical and biogeochemical feedbacks that do not affect the atmospheric concentration of CO2 are included. These include changes in natural CH4 emissions, natural aerosol emissions, N2O, ozone, and vegetation, which all act on time scales of years to decades and are therefore relevant for temperature change over the 21st century. Because the total biogeophysical and non-CO2 biogeochemical feedback is assessed to have a central value that is near zero (low confidence), including it does not affect the assessed ECS but does contribute to the net feedback uncertainty. The biogeochemical feedbacks that affect the atmospheric concentration of CO2 are not included because ECS is defined as the response to a sustained doubling of CO2. Moreover, the long-term feedbacks associated with ice sheets are not included in the ECS owing to their long time scales of adjustment. {5.4, 6.4, 7.4, 7.5, Box 7.1}
The net effect of changes in clouds in response to global warming is to amplify human-induced warming, that is, the net cloud feedback is positive (high confidence). Compared to AR5, major advances in the understanding of cloud processes have increased the level of confidence and decreased the uncertainty range in the cloud feedback by about 50% (Figure TS.17a). An assessment of the low altitude cloud feedback over the subtropical ocean, which was previously the major source of uncertainty in the net cloud feedback, is improved owing to a combined use of climate model simulations, satellite observations, and explicit simulations of clouds, altogether leading to strong evidence that this type of cloud amplifies global warming. The net cloud feedback is assessed to be +0.42 [–0.10 to 0.94] W m–2 °C–1. A net negative cloud feedback is very unlikely. The CMIP5 and CMIP6 ranges of cloud feedback are similar to this assessed range, with CMIP6 having a slightly more positive median cloud feedback (high confidence). The surface albedo feedback and combined water vapour-lapse rate feedback are positive (Figure TS.17a), with high confidence in the estimated value of each based on multiple lines of evidence, including observations, models and theory (Box TS.6). {7.4.2, Figure 7.14, Table 7.10}
Natural sources and sinks of non-CO2 greenhouse gases such as methane (CH4) and nitrous oxide (N2O) respond both directly and indirectly to atmospheric CO2 concentration and climate change, and thereby give rise to additional biogeochemical feedbacks in the climate system. Many of these feedbacks are only partially understood and are not yet fully included in ESMs. There is medium confidence that the net response of natural ocean and land CH4 and N2O sources to future warming will be increased emissions, but the magnitude and timing of the responses of each individual process is known with low confidence. {5.4.7}
Non-CO2 biogeochemical feedbacks induced from changes in emissions, abundances or lifetimes of SLCFs mediated by natural processes or atmospheric chemistry are assessed to decrease ECS (Figure TS.17b). These non-CO2 biogeochemical feedbacks are estimated from ESMs, which since AR5 have advanced to include a consistent representation of biogeochemical cycles and atmospheric chemistry. However, process-level understanding of many biogeochemical feedbacks involving SLCFs, particularly natural emissions, is still emerging, resulting in low confidence in the magnitude and sign of the feedbacks. The central estimate of the total biogeophysical and non-CO2 biogeochemical feedback is assessed to be −0.01 [–0.27 to +0.25] W m–2 °C–1 (Figure TS.17a). {5.4.7, 5.4.8, 6.2.2, 6.4.5, 7.4, Table 7.10}
The combined effect of all known radiative feedbacks (physical, biogeophysical, and non-CO2 biogeochemical) is to amplify the base climate response (in the absence of feedbacks), also known as the Planck temperature response20 (virtually certain). Combining these feedbacks with the Planck response, the net climate feedback parameter is assessed to be –1.16 [–1.81 to –0.51] W m–2 °C–1, which is slightly less negative than that inferred from the overall ECS assessment. The combined water vapour and lapse rate feedback makes the largest single contribution to global warming, whereas the cloud feedback remains the largest contribution to overall uncertainty. Due to the state-dependence of feedbacks, as evidenced from paleoclimate observations and from models, the net feedback parameter will increase (become less negative) as global temperature increases. Furthermore, on long time scales the ice-sheet feedback parameter is very likely positive, promoting additional warming on millennial time scales as ice sheets come into equilibrium with the forcing. (high confidence) {7.4.2, 7.4.3, Figure 7.14, Table 7.10}
The carbon cycle provides for additional feedbacks on climate owing to the sensitivity of land–atmosphere and ocean–atmosphere carbon fluxes and storage to changes in climate and in atmospheric CO2 (Figure TS.17c). Because of the time scales associated with land and ocean carbon uptake, these feedbacks are known to be scenario dependent. Feedback estimates deviate from linearity in scenarios of stabilizing or reducing concentrations. With high confidence, increased atmospheric CO2 will lead to increased land and ocean carbon uptake, acting as a negative feedback on climate change. It is likely that a warmer climate will lead to reduced land and ocean carbon uptake, acting as a positive feedback (Box TS.5). {4.3.2, 5.4.1–5}
Thawing terrestrial permafrost will lead to carbon release (high confidence), but there is low confidence in the timing, magnitude and the relative roles of CO2 versus CH4 as feedback processes. An ensemble of models projects CO2 release from permafrost to be 3–41 PgC per 1ºC of global warming by 2100, leading to warming strong enough that it must be included in estimates of the remaining carbon budget but weaker than the warming from fossil fuel burning. However, the incomplete representation of important processes, such as abrupt thaw, combined with weak observational constraints, only allow low confidence in both the magnitude of these estimates and in how linearly proportional this feedback is to the amount of global warming. There is emerging evidence that permafrost thaw and thermokarst give rise to increased CH4 and N2O emissions, which leads to the combined radiative forcing from permafrost thaw being larger than from CO2 emissions only. However, the quantitative understanding of these additional feedbacks is low, particularly for N2O. These feedbacks, as well as potential additional carbon losses due to climate-induced fire feedback are not routinely included in Earth system models. {Box 5.1, 5.4.3, 5.4.7, 5.4.8}
CONTINUED ON NEXT POST
Last edited:
Figure TS.16 | (a) Evolution of equilibrium climate sensitivity (ECS) assessments from the Charney Report through a succession of IPCC Assessment
Reports to AR6, and lines of evidence and combined assessment for (b) ECS and (c) transient climate response (TCR) in AR6. The intent of this figure is to
show the progression in estimates of ECS, including uncertainty and the lines of evidence used for assessment, and to show the lines of assessment used to assess ECS and
TCR in AR6. In panel (a), the lines of evidence considered are listed below each assessment. Best estimates are marked by horizontal bars, likely ranges by vertical bars, and
very likely ranges by dotted vertical bars. In panel (b) and (c), assessed ranges are taken from Tables 7.13 and 7.14 for ECS and TCR respectively. Note that for the ECS
assessment based on both the instrumental record and paleoclimates, limits (i.e., one-sided distributions) are given, which have twice the probability of being outside the
maximum/minimum value at a given end, compared to ranges (i.e., two tailed distributions) which are given for the other lines of evidence. For example, the extremely likely limit
of greater than 95% probability corresponds to one side of the very likely (5% to 95%) range. Best estimates are given as either a single number or by a range represented by
grey box. Coupled Model Intercomparison Project Phase 6 (CMIP6) Earth system model (ESM) values are not directly used as a line of evidence but are presented on the figure
for comparison. {1.5, 7.5; Tables 7.13 and 7.14; Figure 7.18}
Figure TS.17 | An overview of physical and biogeochemical feedbacks in the climate system. The intent of this figure is to summarize assessed estimates of physical,
biogeophysical and biogeochemical feedbacks on global temperature based on Chapters 5, 6 and 7. (a) Synthesis of physical, biogeophysical and non-carbon dioxide (CO2)
biogeochemical feedbacks that are included in the definition of equilibrium climate sensitivity (ECS) assessed in this Technical Summary. These feedbacks have been assessed
using multiple lines of evidence including observations, models and theory. The net feedback is the sum of the Planck response, water vapour and lapse rate, surface albedo,
cloud, and biogeophysical and non-CO2 biogeochemical feedbacks. Bars denote the mean feedback values, and uncertainties represent very likely ranges; (b) Estimated values of
individual biogeophysical and non-CO2 biogeochemical feedbacks. The atmospheric methane (CH4) lifetime and other non-CO2 biogeochemical feedbacks have been calculated
using global Earth system model simulations from AerChemMIP, while the CH4 and nitrous oxide (N2O) source responses to climate have been assessed for the year 2100 using
a range of modelling approaches using simplified radiative forcing equations. The estimates represent the mean and 5–95% range. The level of confidence in these estimates
is low owing to the large model spread. (c) Carbon-cycle feedbacks as simulated by models participating in the C4MIP of the Coupled Model Intercomparison Project Phase 6
(CMIP6). An independent estimate of the additional positive carbon-cycle climate feedbacks from permafrost thaw, which is not considered in most C4MIP models, is added.
The estimates represent the mean and 5–95% range. Note that these feedbacks act through modifying the atmospheric concentration of CO2 and thus are not included in the
definition of ECS, which assumes a doubling of CO2, but are included in the definition and assessed range of the transient climate response to cumulative CO2 emissions (TCRE).
{5.4.7, 5.4.8, Box 5.1, Figure 5.29, 6.4.5, Table 6.9, 7.4.2, Table 7.10}
jc456
Diamond Member
- Dec 18, 2013
- 160,703
- 40,235
- 2,180
Then what world experiment has been repeated?Frank thinks that a beaker in a lab behaves exactly the same as the whole planet.
Frank is a special kind of stupid.
It seems it is you who believe the beaker, balloon is the world, and that is what he said.
You are always irony
jc456
Diamond Member
- Dec 18, 2013
- 160,703
- 40,235
- 2,180
Sure it would, are you suggesting real greenhouses don’t work now?No, it wouldn't. The increase in greening on earth stopped in the 1990s. A little more CO2 initially helped, but that effect was saturated long ago, and more CO2 now does nothing.
ReinyDays
Platinum Member
Here…
Climatology uses T^4 = ( S ( 1 - a ) / 4o [where T=temperature, S=solar constant, a=albedo, o=SB constant] ... just once through, I didn't see the mistake, but generally we use Earth's cross sectional area for the "per square meter" part ... which is one fourth surface area ... it's a vector thing ...
My own mathematical argument starts at 7'15" ... reference material gives Earth's albedo as ≈ 0.3 ... and in science, this statement is interpreted as ± 0.05 ... meaning the actual value is somewhere between 0.25 and 0.35 ... run these values through both forms of SB and you'll get ± 10 K ... ten degrees Celsius error margins ...
More clouds means more albedo ... a negative feedback mechanism ... roughly 7% increase per degree Celsius ... so belch that carbon, I dare you ...
jc456
Diamond Member
- Dec 18, 2013
- 160,703
- 40,235
- 2,180
Climatology uses T^4 = ( S ( 1 - a ) / 4o [where T=temperature, S=solar constant, a=albedo, o=SB constant] ... just once through, I didn't see the mistake, but generally we use Earth's cross sectional area for the "per square meter" part ... which is one fourth surface area ... it's a vector thing ...
My own mathematical argument starts at 7'15" ... reference material gives Earth's albedo as ≈ 0.3 ... and in science, this statement is interpreted as ± 0.05 ... meaning the actual value is somewhere between 0.25 and 0.35 ... run these values through both forms of SB and you'll get ± 10 K ... ten degrees Celsius error margins ...
More clouds means more albedo ... a negative feedback mechanism ... roughly 7% increase per degree Celsius ... so belch that carbon, I dare you ...
Here…
2aguy
Diamond Member
- Jul 19, 2014
- 113,149
- 53,672
- 2,290
The hottest day in history just occurred. The global average temperature was 17.18C, the hottest in the historical record.
Discuss.
Does this mean global warming is very real, and the rational people have been spot-on correct for the past 40 years? Yes.
Does this mean the denier cultists have been laughably wrong for the past decade? Yes.
If you want to put forth a "DERP! DERP! ALL THE DATA IS FAKED! DEEEEERRRRRRP!" conspiracy as a way to run from the hard data, you have to back it up, with something more than a link to a kook conspiracy website. Explain it in your own words, then link to primary data sources. If you won't, that's an admission you're making it all up.
If you'd like to claim the warming is all-natural, provide evidence for that. Don't just claim it. Back it up.
Needless to say, trolls will be instantly reported. Mods, please don't reward trolls by moving a thread to the Rubber Room after trolls overwhelm it, as the trolls always attempt to do.

No....it didn't........but thanks for being a dupe of the leftists who want more money, power and control over our lives.....
But should we be worried that it’s very hot in the Western Hemisphere during the summer? The people and groups who want you worried want you to forget that prosaic fact.
Stephen Milloy, a noted climate change skeptic, performed the necessary lobotomy on the hysterics in the Wall Street Journal.
The global-warming industry has declared that July 3 and 4 were the two hottest days on Earth on record. The reported average global temperature on those days was 62.6 degrees Fahrenheit, supposedly the hottest in 125,000 years. The claimed temperature was derived from the University of Maine’s Climate Reanalyzer, which relies on a mix of satellite temperature data and computer-model guesstimation to calculate estimates of temperature.
One obvious problem with the updated narrative is that there are no satellite data from 125,000 years ago. Calculated estimates of current temperatures can’t be fairly compared with guesses of global temperature from thousands of years ago.
Perhaps the biggest problem with the “average global temperature” hysteria is that the entire system put in place by the National Oceanographic and Atmospheric Administration (NOAA) has been corrupted. The Heartland Institute alerted the media to this fact a year ago.A more likely alternative to the 62.6-degree estimate is something around 57.5 degrees. The latter is an average of actual surface temperature measurements taken around the world and processed on a minute-by-minute basis by a website called temperature.global. The numbers have been steady this year, with no spike in July.
Moreover, the notion of “average global temperature” is meaningless. Average global temperature is a concept invented by and for the global-warming hypothesis. It is more a political concept than a scientific one. The Earth and its atmosphere is large and diverse, and no place is meaningfully average.
About That Claim That July 3-4 Were the 'Hottest Days on Record'...
The headlines were stark and specific. Reuters claimed, “World registers hottest day ever reco
 pjmedia.com
Lastamender
Diamond Member
- Dec 28, 2011
- 65,087
- 59,287
- 3,600
So more CO2 does nothing. Thanks.No, it wouldn't. The increase in greening on earth stopped in the 1990s. A little more CO2 initially helped, but that effect was saturated long ago, and more CO2 now does nothing.
mamooth
Diamond Member
- Thread starter
- #275
The topic, so of course you're going to start raving some butthurt conspiracy kookery. It's not like you can address the science, so you have to deflect somehow.No....it didn't........but thanks for being a dupe of the leftists who want more money, power and control over our lives.....
You're really that stupid? You're actually confusing "hottest average global temperature ever" with "it's warm in the summer"?But should we be worried that it’s very hot in the Western Hemiishere during the summer?
No wonder you fall for bad denier propaganda.
A noted paid-liar for all polluters. He's best known for his disinformation campaign about how cigarettes don't cause cancer. That's the sort of scumbag that the deniers employ.Stephen Milloy, a noted
If all the data said I was a crank liar, I'd probably make up that kind of story too.Perhaps the biggest problem with the “average global temperature” hysteria is that the entire system put in place by the National Oceanographic and Atmospheric Administration (NOAA) has been corrupted. The Heartland Institute alerted the media to this fact a year ago.
Oh wait, I wouldn't, because I'm ethical. If all the data said my views were wrong, I'd change my views.
Lastamender
Diamond Member
- Dec 28, 2011
- 65,087
- 59,287
- 3,600
The conspiracy is Climate change.The topic, so of course you're going to start raving some butthurt conspiracy kookery. It's not like you can address the science, so you have to deflect somehow.
You're really that stupid? You're actually confusing "hottest average global temperature ever" with "it's warm in the summer"?
No wonder you fall for bad denier propaganda.
A noted paid-liar for all polluters. He's best known for his disinformation campaign about how cigarettes don't cause cancer. That's the sort of scumbag that the deniers employ.
If all the data said I was a crank liar, I'd probably make up that kind of story too.
Oh wait, I wouldn't, because I'm ethical. If all the data said my views were wrong, I'd change my views.
CrusaderFrank
Diamond Member
- May 20, 2009
- 163,218
- 89,862
- 2,645
View attachment 802500
View attachment 802501
Figure TS.16 | (a) Evolution of equilibrium climate sensitivity (ECS) assessments from the Charney Report through a succession of IPCC Assessment
Reports to AR6, and lines of evidence and combined assessment for (b) ECS and (c) transient climate response (TCR) in AR6. The intent of this figure is to
show the progression in estimates of ECS, including uncertainty and the lines of evidence used for assessment, and to show the lines of assessment used to assess ECS and
TCR in AR6. In panel (a), the lines of evidence considered are listed below each assessment. Best estimates are marked by horizontal bars, likely ranges by vertical bars, and
very likely ranges by dotted vertical bars. In panel (b) and (c), assessed ranges are taken from Tables 7.13 and 7.14 for ECS and TCR respectively. Note that for the ECS
assessment based on both the instrumental record and paleoclimates, limits (i.e., one-sided distributions) are given, which have twice the probability of being outside the
maximum/minimum value at a given end, compared to ranges (i.e., two tailed distributions) which are given for the other lines of evidence. For example, the extremely likely limit
of greater than 95% probability corresponds to one side of the very likely (5% to 95%) range. Best estimates are given as either a single number or by a range represented by
grey box. Coupled Model Intercomparison Project Phase 6 (CMIP6) Earth system model (ESM) values are not directly used as a line of evidence but are presented on the figure
for comparison. {1.5, 7.5; Tables 7.13 and 7.14; Figure 7.18}
View attachment 802502
View attachment 802503
View attachment 802504
Figure TS.17 | An overview of physical and biogeochemical feedbacks in the climate system. The intent of this figure is to summarize assessed estimates of physical,
biogeophysical and biogeochemical feedbacks on global temperature based on Chapters 5, 6 and 7. (a) Synthesis of physical, biogeophysical and non-carbon dioxide (CO2)
biogeochemical feedbacks that are included in the definition of equilibrium climate sensitivity (ECS) assessed in this Technical Summary. These feedbacks have been assessed
using multiple lines of evidence including observations, models and theory. The net feedback is the sum of the Planck response, water vapour and lapse rate, surface albedo,
cloud, and biogeophysical and non-CO2 biogeochemical feedbacks. Bars denote the mean feedback values, and uncertainties represent very likely ranges; (b) Estimated values of
individual biogeophysical and non-CO2 biogeochemical feedbacks. The atmospheric methane (CH4) lifetime and other non-CO2 biogeochemical feedbacks have been calculated
using global Earth system model simulations from AerChemMIP, while the CH4 and nitrous oxide (N2O) source responses to climate have been assessed for the year 2100 using
a range of modelling approaches using simplified radiative forcing equations. The estimates represent the mean and 5–95% range. The level of confidence in these estimates
is low owing to the large model spread. (c) Carbon-cycle feedbacks as simulated by models participating in the C4MIP of the Coupled Model Intercomparison Project Phase 6
(CMIP6). An independent estimate of the additional positive carbon-cycle climate feedbacks from permafrost thaw, which is not considered in most C4MIP models, is added.
The estimates represent the mean and 5–95% range. Note that these feedbacks act through modifying the atmospheric concentration of CO2 and thus are not included in the
definition of ECS, which assumes a doubling of CO2, but are included in the definition and assessed range of the transient climate response to cumulative CO2 emissions (TCRE).
{5.4.7, 5.4.8, Box 5.1, Figure 5.29, 6.4.5, Table 6.9, 7.4.2, Table 7.10}
Still doesn't answer the basic question of how much raising CO2 from 250 to 500PP will "raise temperature"
It looks like the audit for Bernie Madoff's Equity Fund
Batcat
Diamond Member
- Aug 29, 2020
- 10,678
- 8,929
- 2,138
Much depends on where the official temperature is measured.
The hottest day in history just occurred. The global average temperature was 17.18C, the hottest in the historical record.
Discuss.
Does this mean global warming is very real, and the rational people have been spot-on correct for the past 40 years? Yes.
Does this mean the denier cultists have been laughably wrong for the past decade? Yes.
If you want to put forth a "DERP! DERP! ALL THE DATA IS FAKED! DEEEEERRRRRRP!" conspiracy as a way to run from the hard data, you have to back it up, with something more than a link to a kook conspiracy website. Explain it in your own words, then link to primary data sources. If you won't, that's an admission you're making it all up.
If you'd like to claim the warming is all.-natural, provide evidence for that. Don't just claim it. Back it up.
Needless to say, trolls will be instantly reported. Mods, please don't reward trolls by moving a thread to the Rubber Room after trolls overwhelm it, as the trolls always attempt to do.

BIG NEWS - Verified by NOAA - poor weather station siting leads to artificial long term warming - Watts Up With That?
I've been saying for years that surface temperature measurements (and long term trends) have been affected by encroachment of urbanization on the
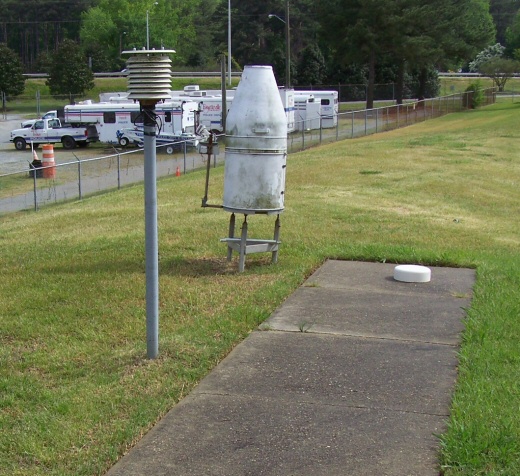
This is why you don't put an official NOAA temperature sensor over concrete - Watts Up With That?
You'd think the answer would be obvious, but here we have a NOAA operated USHCN climate station of record providing a live experiment. It always helps to
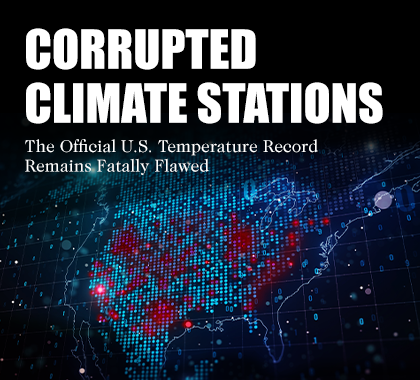
MEDIA ADVISORY: 96% of U.S. Climate Data Are Corrupted - The Heartland Institute
Official NOAA temperature stations produce corrupted data due to purposeful placement in man-made hot spots
heartland.org

Garbage In, Garbage Out: 96% of NOAA Temperature Stations Fail 'Uncorrupted Placement' Standards
A study found that 96% of heat measurement around the U.S. fail to meet NOAA's own “uncorrupted placement” standards.
 www.breitbart.com
jc456
Diamond Member
- Dec 18, 2013
- 160,703
- 40,235
- 2,180
Or, it’s just all made up nonsenseMuch depends on where the official temperature is measured.
BIG NEWS - Verified by NOAA - poor weather station siting leads to artificial long term warming - Watts Up With That?
I've been saying for years that surface temperature measurements (and long term trends) have been affected by encroachment of urbanization on thewattsupwiththat.com
This is why you don't put an official NOAA temperature sensor over concrete - Watts Up With That?
You'd think the answer would be obvious, but here we have a NOAA operated USHCN climate station of record providing a live experiment. It always helps to
MEDIA ADVISORY: 96% of U.S. Climate Data Are Corrupted - The Heartland Institute
Official NOAA temperature stations produce corrupted data due to purposeful placement in man-made hot spotsheartland.org
Garbage In, Garbage Out: 96% of NOAA Temperature Stations Fail 'Uncorrupted Placement' Standards
A study found that 96% of heat measurement around the U.S. fail to meet NOAA's own “uncorrupted placement” standards.
Similar threads
- Replies
- 13
- Views
- 225
- Replies
- 2
- Views
- 225
- Replies
- 95
- Views
- 1K
New Topics
-
Facial recognition ties Delaney Hall chaos to Portland and Minnesota, Homan says
- Started by Hollie
- Replies: 0
-

-

-
 Almost 10% of Toronto mortgage holders won’t qualify to refinance next year, BoC says
- Started by shockedcanadian
- Replies: 0
-
