My point is, the potus or congress are no more than mouthpieces
they account for very little of our economy, the well being of the middle class, or the future of America
they do, however, love partisans , best shield they have
~S~
My ass, dupe. The GOP is a giveaway to the rich end of story.
Demise of the American Middle Class In Numbers.
Over the past 35 years the American dream has gradually disappeared. The process was slow, so most people didn’t notice. They just worked a few more hours, borrowed a little more and cut back on non-essentials. But looking at the numbers and comparing them over long time periods, it is obvious that things have changed drastically. Here are the details:
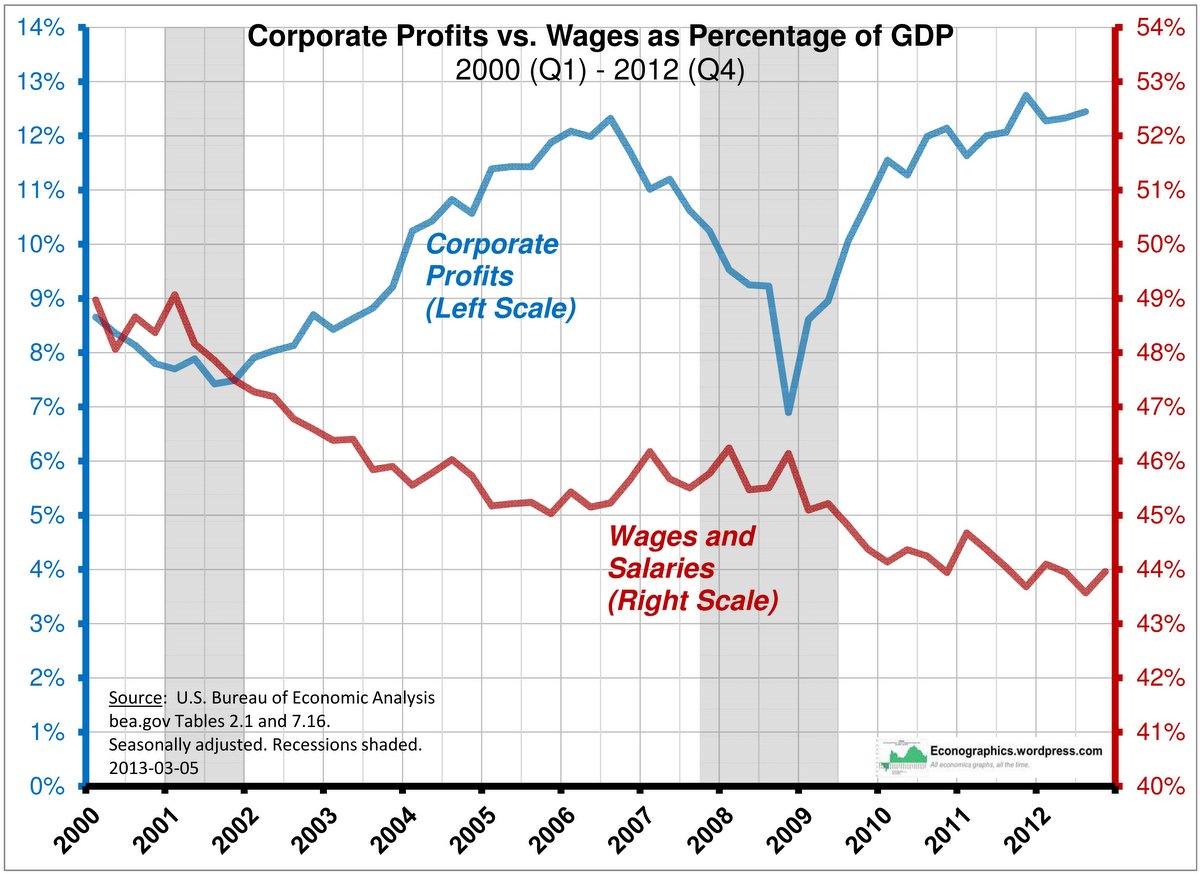
1. WORKERS PRODUCE MORE BUT THE GAINS GO TO BUSINESS.
Over the past 63 years worker productivity has grown by 2.0% per year.
But after 1980, workers received a smaller share every year. Labor’s share of income (1992 = 100%):
1950 = 101%
1960 = 105%
1970 = 105%
1980 = 105% – Reagan
1990 = 100%
2000 = 96%
2007 = 92%
A 13% drop since 1980
2. THE TOP 10% GET A LARGER SHARE.
Share of National Income going to Top 10%:
1950 = 35%
1960 = 34%
1970 = 34%
1980 = 34% – Reagan
1990 = 40%
2000 = 47%
2007 = 50%
An increase of 16% since Reagan.
3. WORKERS COMPENSATED FOR THE LOSS OF INCOME BY SPENDING THEIR SAVINGS.
The savings Rose up to Reagan and fell during and after.
1950 = 6.0%
1960 = 7.0%
1970 = 8.5%
1980 = 10.0% – Reagan
1982 = 11.2% – Peak
1990 = 7.0%
2000 = 2.0%
2006 = -1.1% (Negative = withdrawing from savings)
A 12.3% drop after Reagan.
4. WORKERS ALSO BORROWED TO MAKE UP FOR THE LOSS.
Household Debt as percentage of GDP:
1965 = 46%
1970 = 45%
1980 = 50% – Reagan
1990 = 61%
2000 = 69%
2007 = 95%
Oh, i remember.....>>>
Long-term disaster he was...lack of money to invest in education training and infrastructure is making us go to hell except for the rich of course.... So now we have the worst inequality and Upward Mobility and poverty ever not to mention the worst BS propaganda machine ever, the only reason they can stay in power is total doops. All downhill since Reagan, s*** heads.
Demise of the American Middle Class In Numbers.
Over the past 60 years the American dream has gradually disappeared. The process was slow, so most people didn’t notice. They just worked a few more hours, borrowed a little more and cut back on non-essentials. But looking at the numbers and comparing them over long time periods, it is obvious that things have changed drastically. Here are the details:
1. WORKERS PRODUCE MORE BUT THE GAINS GO TO BUSINESS.
Over the past 63 years worker productivity has grown by 2.0% per year.
But after 1980, workers received a smaller share every year. Labor’s share of income (1992 = 100%):
1950 = 101%
1960 = 105%
1970 = 105%
1980 = 105% – Reagan
1990 = 100%
2000 = 96%
2007 = 92%
A 13% drop since 1980
2. THE TOP 10% GET A LARGER SHARE.
Share of National Income going to Top 10%:
1950 = 35%
1960 = 34%
1970 = 34%
1980 = 34% – Reagan
1990 = 40%
2000 = 47%
2007 = 50%
An increase of 16% since Reagan.
3. WORKERS COMPENSATED FOR THE LOSS OF INCOME BY SPENDING THEIR SAVINGS.
The savings Rose up to Reagan and fell during and after.
1950 = 6.0%
1960 = 7.0%
1970 = 8.5%
1980 = 10.0% – Reagan
1982 = 11.2% – Peak
1990 = 7.0%
2000 = 2.0%
2006 = -1.1% (Negative = withdrawing from savings)
A 12.3% drop after Reagan.
4. WORKERS ALSO BORROWED TO MAKE UP FOR THE LOSS.
Household Debt as percentage of GDP:
1965 = 46%
1970 = 45%
1980 = 50% – Reagan
1990 = 61%
2000 = 69%
2007 = 95%