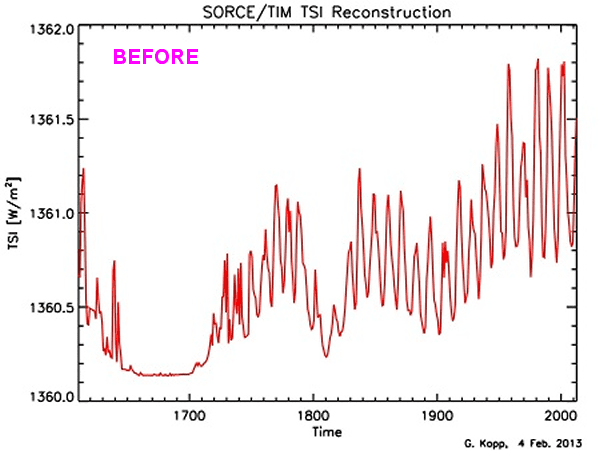
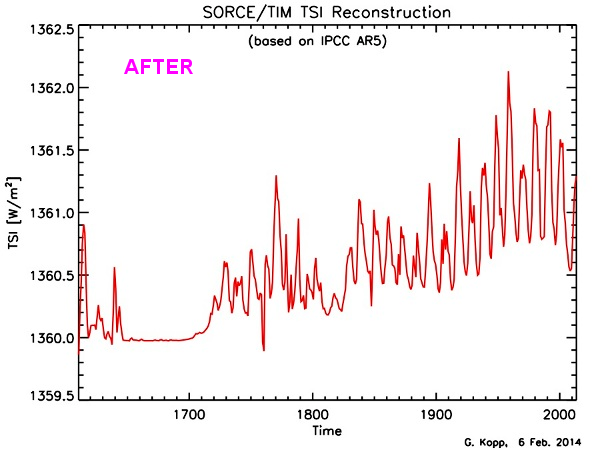
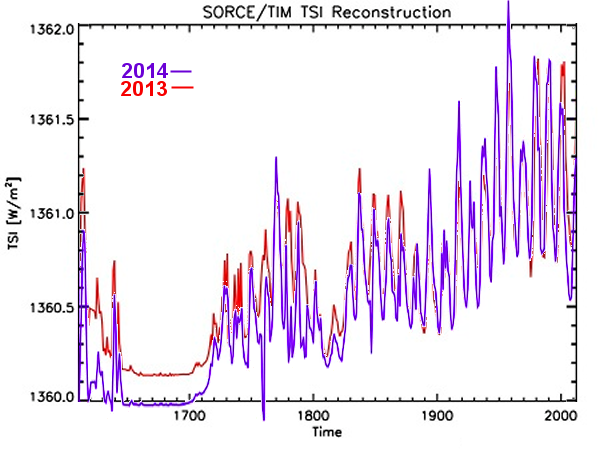
I have transcribed the accompanying text by hand since the PDF is protected. However, before you start reading, you might examine these data to see if they show ANYTHING like a sufficient increase in TSI to have driven the warming of the last 150 years, complex delays or no.
This is Figure 8.11 from AR5, WG I, The Physical Science Basis.
A transcription.
8.4.1.2 Total Solar Irradiance Variations Since Preindustrial Times
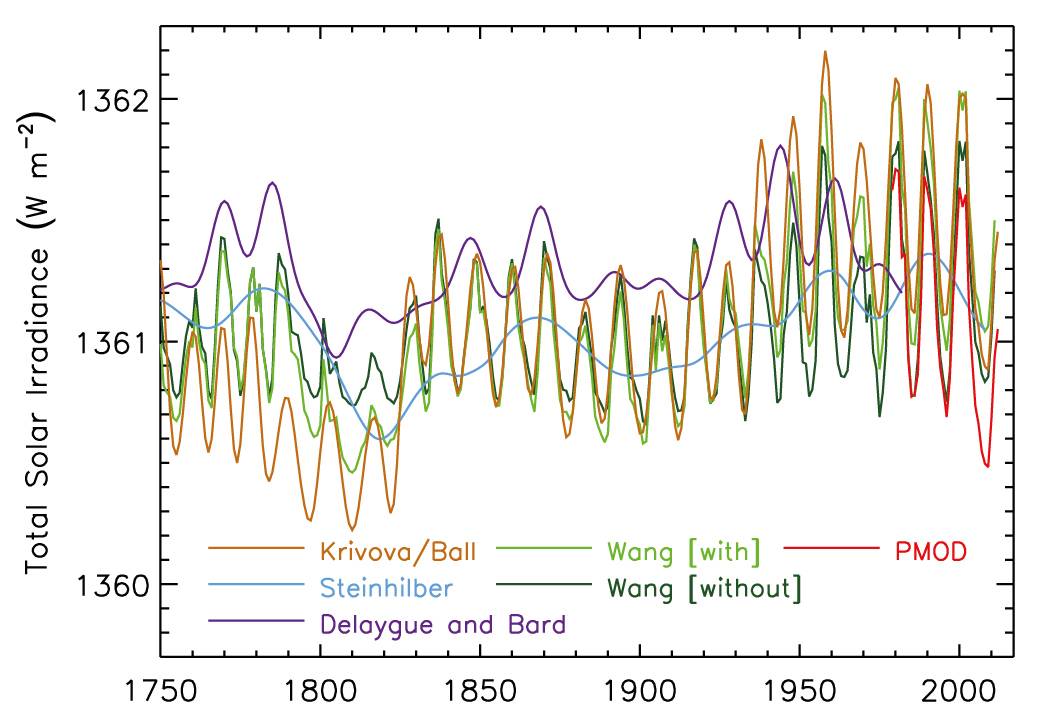
The year 1750, which is used as the preindustrial reference for estimating RF, corresponds to a maximum of the 11-year SC. Trend analysis are usually performed over the minima of the solar cycles that are more stable. For such trend estimates, it is then better to use the closest SC minimum, which is in 1745. To avoid trends caused by comparing different portions of the solar cycle, we analyze TSI changes using multi-year running means. For the best estimate we use a recent TSI reconstruction by Krivova et al (2010) between 1745 and 1973 and from 1974 to 2012 by Ball et al (2012). The reconstruction is based on physical modeling of the evolution of solar surface magnetic flux and its relationship with sunspot group number (before 1974) and sunspot umbra and penumbra and faculae afterwards. This provides a more detailed reconstruction than other models (see the time series in Supplementary Material Table 8.SM.3). The best estimate from our assessment of the most reliable TSI reconstruction gives
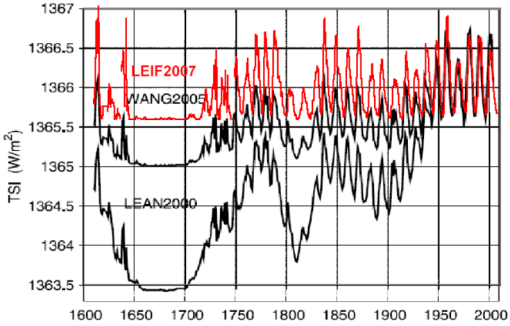
a 7-year running mean RF between the minima of 1745 and 2008 of 0.05Wm^-2. Our assessment of the range of RF from TSI changes is 0.0 to 0.10 Wm^-2 which covers several updated reconstructions using the same 7-year running mean past-to-present minima years (Wang et al, 2005; Steinhilber et al, 209; Delaygue and Bard, 2011), see Supplementary Material Table 8.SM.4. All reconstructions rely on indirect proxies that inherently do not give consistent results. There are relatively large discrepancies among the models (See Figure 8.11). With these considerations, we adopt this value and range for AR5. This RF is almost half of that in AR4, in part because the AR4 estimate was based on the previous solar cycle minimum while the AR5 estimate includes the drop of TSI in 2008 compared to the previous two SC minima (see 8.4.1). Concerning the uncertainty range in AR4 the upper limit corresponded to the reconstruction of Lean (2000), based on the reduced brightness of non-cycling Sun-like stars assumed typical of a Maunder minimum (MM) state. The use of such stellar analogues was based on the work of Bailunas and Jastrow (1990), but more recent surveys have not reproduced their results and suggest that the selection of the original set was flawed (Hal and Lockwood, 2004; Wright, 2004); the lower limit from 1750 to present in AR4 was due to the assumed increase in the amplitude of the 11-year cycle only. Thus the RF and uncertainty range have been obtained in a different way in AR5 compared to AR4. Maxima to maxima RF give a higher estimate than minima to minima RF, but the latter is more relevant for changes in solar activity. Given the
medium agreement and
medium evidence, this RF value has a
medium confidence level (although confidence is higher for the last three decades). Figure 8.11 shows several TSI reconstructions modeled using sunspot group numbers (Wang et al, 2005; Krivova et al, 2010; Ball et al, 2012) and sunspot umbra and penumbra and faculae (Ball et al, 2012) or cosmogenic isotopes (Steinhilber et al, 2009; Delaygue and Bard, 2011). These reconstructions are standardized to PMOD SC 23 (1996-2008) (see also Supplementary Material Section 8.SM.6).
For the MM-to-present AR4 gives a TOA instantaneous RF range of 0.1 to 0.28 Wm^-2, equivalent to 0.08 to 0.22 Wm^-2 with the RF definition used here. The reconstructions in Schmidt et al (2011 indicate a MM-to-present RF range of 0.08 to 0.18 Wm^-2, which is within the AR4 range although narrower. As discussed above, the estimates based on irradiance changes in Sun-like stars are not included in this range because the methodology has been shown to be flawed. A more detailed explanation of this is found in Supplementary Material Section 8.SM.6. For details about TSI reconstructions on millenia times scales see Section 5.2.1.2.