SSDD
Gold Member
- Nov 6, 2012
- 16,672
- 1,968
- 280
Dude, you're claiming that temperature causes CO2 levels to rise, when clearly no scientist is claiming that.I have provided charts that show definite correlation between CO2 levels and temperature which is causing our current warming.
Once more, you asked for peer reviewed rebuttals of your "correlation" chart, that isn't part of any peer reviewed work. That chart is from a blog and doesn't have any peer reviewed explanation attached.
If you are going to insist that the rebuttals to your claims be peer reviewed, you really should be presenting peer reviewed materials. I already provided some peer reviewed work which looked more closely at the data your chart supposedly demonstrated and found that the correlation simply was not there...no doubt there is the appearance of correlation, but upon close inspection, it just doesn't bear out. And even if it did, correlation does not equal causation...
Here is some peer reviewed science regarding the lag between temperature and CO2 increases...
From the AGUY
https://agupubs.onlinelibrary.wiley.com/doi/full/10.1029/2012GL053018
Clips: "During the last glacial period atmospheric carbon dioxide and temperature in Antarctica varied in a similar fashion on millennial time scales, but previous work indicates that these changes were gradual. In a detailed analysis of one event we now find that approximately half of the CO2increase that occurred during the 1500‐year cold period between Dansgaard‐Oeschger (DO) events 8 and 9 happened rapidly, over less than two centuries. This rise in CO2 was synchronous with, or slightly later than, a rapid increase of Antarctic temperature inferred from stable isotopes.”
"In a detailed analysis of one event we now find that approximately half of the CO2 increase that occurred during the 1500-year cold period between Dansgaard-Oeschger (DO) events 8 and 9 happened rapidly, over less than two centuries.”
The fact is that the research shows CO2 rising as a result of increased temperature. It is well known that cold oceans hold more CO2 than warm oceans. When temperatures increase, the oceans warm and start to lose CO2. You can do a very easy experiment in your home right now with items that most of us have on hand to demonstrate this physical reality.
Grab yourself a couple of unopened sodas, open them and set one in your refrigerator and the other out on the counter. Have a taste of them tomorrow morning. The one sitting on the counter will be dead flat....having out gassed all of its CO2 as it warmed...the one in the refrigerator, will still have some fizz...not as much as when it was first opened, but because it hasn't warmed as much as the one on the counter, it will not have outgassed all of its CO2. The same principle works in the oceans which hold a great deal of CO2 during cold glacial periods...they release a great deal of that CO2 during warm interglacial periods.
Here is some more peer reviewed research on the lag..
https://www.sciencedirect.com/science/article/pii/B9780128045886000094
Clip: CO2 makes up only a tiny portion of the atmosphere (0.040%) and constitutes only 3.6% of the greenhouse effect. The atmospheric content of CO2 has increased only 0.008% since emissions began to soar after 1945. Such a tiny increment of increase in CO2 cannot cause the 10°F increase in temperature predicted by CO2 advocates. Computer climate modelers build into their models a high water vapor component, which they claim is due to increased atmospheric water vapor caused by very small warming from CO2, and since water vapor makes up 90–95% of the greenhouse effect, they claim the result will be warming. The problem is that atmospheric water vapor has actually declined since 1948, not increased as demanded by climate models. If CO2 causes global warming, then CO2 should always precede warming when the Earth’s climate warms up after an ice age. However, in all cases, CO2 lags warming by ∼800 years. Shorter time spans show the same thing—warming always precedes an increase in CO2 and therefore it cannot be the cause of the warming.
From NASA
Carbon Dioxide Controls Earth's Temperature
› View larger
A new atmosphere-ocean climate modeling study shows that atmospheric carbon dioxide acts as a thermostat in regulating the temperature of Earth. Credit: NASA GISS/ Lilly Del Valle
› View larger
Various atmospheric components differ in their contributions to the greenhouse effect, some through feedbacks and some through forcings. Without carbon dioxide and other non-condensing greenhouse gases, water vapor and clouds would be unable to provide the feedback mechanisms that amplify the greenhouse effect. Credit: NASA GISSWater vapor and clouds are the major contributors to Earth's greenhouse effect, but a new atmosphere-ocean climate modeling study shows that the planet's temperature ultimately depends on the atmospheric level of carbon dioxide.
The study, conducted by Andrew Lacis and colleagues at NASA's Goddard Institute for Space Studies (GISS) in New York, examined the nature of Earth's greenhouse effect and clarified the role that greenhouse gases and clouds play in absorbing outgoing infrared radiation. Notably, the team identified non-condensing greenhouse gases -- such as carbon dioxide, methane, nitrous oxide, ozone, and chlorofluorocarbons -- as providing the core support for the terrestrial greenhouse effect.
Without non-condensing greenhouse gases, water vapor and clouds would be unable to provide the feedback mechanisms that amplify the greenhouse effect. The study's results will be published Friday, Oct. 15 in Science.
A companion study led by GISS co-author Gavin Schmidt that has been accepted for publication in the Journal of Geophysical Research shows that carbon dioxide accounts for about 20 percent of the greenhouse effect, water vapor and clouds together account for 75 percent, and minor gases and aerosols make up the remaining five percent. However, it is the 25 percent non-condensing greenhouse gas component, which includes carbon dioxide, that is the key factor in sustaining Earth’s greenhouse effect. By this accounting, carbon dioxide is responsible for 80 percent of the radiative forcing that sustains the Earth’s greenhouse effect.
The climate forcing experiment described in Science was simple in design and concept -- all of the non-condensing greenhouse gases and aerosols were zeroed out, and the global climate model was run forward in time to see what would happen to the greenhouse effect. Without the sustaining support by the non-condensing greenhouse gases, Earth’s greenhouse effect collapsed as water vapor quickly precipitated from the atmosphere, plunging the model Earth into an icebound state -- a clear demonstration that water vapor, although contributing 50 percent of the total greenhouse warming, acts as a feedback process, and as such, cannot by itself uphold the Earth's greenhouse effect.
"Our climate modeling simulation should be viewed as an experiment in atmospheric physics, illustrating a cause and effect problem which allowed us to gain a better understanding of the working mechanics of Earth’s greenhouse effect, and enabled us to demonstrate the direct relationship that exists between rising atmospheric carbon dioxide and rising global temperature," Lacis said.
The study ties in to the geologic record in which carbon dioxide levels have oscillated between approximately 180 parts per million during ice ages, and about 280 parts per million during warmer interglacial periods. To provide perspective to the nearly 1 C (1.8 F) increase in global temperature over the past century, it is estimated that the global mean temperature difference between the extremes of the ice age and interglacial periods is only about 5 C (9 F).
"When carbon dioxide increases, more water vapor returns to the atmosphere. This is what helped to melt the glaciers that once covered New York City," said co-author David Rind, of NASA's Goddard Institute for Space Studies. "Today we are in uncharted territory as carbon dioxide approaches 390 parts per million in what has been referred to as the 'superinterglacial.'"
"The bottom line is that atmospheric carbon dioxide acts as a thermostat in regulating the temperature of Earth," Lacis said. "The Intergovernmental Panel on Climate Change has fully documented the fact that industrial activity is responsible for the rapidly increasing levels of atmospheric carbon dioxide and other greenhouse gases. It is not surprising then that global warming can be linked directly to the observed increase in atmospheric carbon dioxide and to human industrial activity in general."
 › View larger
 › View larger
A modelling simulation? And once again...not peer reviewed literature. That is hardly evidence. Then there is the fact that is almost 10 years old. In that time the models have proven over and over that they simply can not model reality.
Here....some recent (2018) PEER REVIEWED work regarding climate models...
May common model biases reduce CMIP5’s ability to simulate the recent Pacific La Niña-like cooling?
“Over the recent three decades sea surface temperate (SST) in the eastern equatorial Pacific has decreased, which helps reduce the rate of global warming. However, most CMIP5 model simulations with historical radiative forcing do not reproduce this Pacific La Niña-like cooling. Based on the assumption of “perfect” models, previous studies have suggested that errors in simulated internal climate variations and/or external radiative forcing may cause the discrepancy between the multi-model simulations and the observation…. Based on the total 126 realizations of the 38 CMIP5 model Historical simulations, the results show that none of the 126 model historical realizations reproduce the intensity of the observed eastern Pacific [1981-2010] cooling and only one simulation produces a weak cooling (−0.007 °C per decade).”
TC - Peer review - Brief communication: Recent changes in summer Greenland blocking captured by none of the CMIP5 models
“Recent studies note a significant increase in high-pressure blocking over the Greenland region (Greenland Blocking Index, GBI) in summer since the 1990s. … We find that the recent summer GBI increase lies well outside the range of modelled past reconstructions (Historical scenario) and future GBI projections (RCP4.5 and RCP8.5). The models consistently project a future decrease in GBI (linked to an increase in NAO), which highlights a likely key deficiency of current climate models if the recently-observed circulation changes continue to persist. Given well-established connections between atmospheric pressure over the Greenland region and air temperature and precipitation extremes downstream, e.g. over Northwest Europe, this brings into question the accuracy of simulated North Atlantic jet stream changes and resulting climatological anomalies […] as well as of future projections of GrIS mass balance produced using global and regional climate models.”
EmeraldInsight
“The temperature effects of the water and CO2 are based on spectral analysis calculations, which show that water is 11.8 times stronger a GH gas than CO2 in the present climate. … There are essential features in the long-term trends of temperature and TPW [total precipitable water], which are calculated and depicted as mean values 11 years running. The temperature has increased about 0.4°C since 1979 and has now paused at this level. The long-term trend of TPW [total precipitable water] effects shows that it has slightly decreased during the temperature-increasing period from 1979 to 2000. This means that the absolute water amount in the atmosphere does not follow the temperature increase, but is practically constant, reacting only very slightly to the long-term trends of temperature changes. The assumption that relative humidity is constant and that it amplifies the GH gas changes over the longer periods by doubling the warming effects finds no grounds based on the behavior of the TWP [total precipitable water] trend. The positive water feedback exists only during the short-term ENSO events (≤4 years).”
“The validity of the IPCC model can be tested against the observed temperature. It turns out that the IPCC-calculated temperature increase for 2016 is 1.27°C, which is 49 per cent higher than the observed 0.85°C. This validity test means that the IPCC climate forcing model using the radiative forcing value of CO2 is too sensitive for CO2 increase, and the CS [climate sensitivity] parameter, including the positive water feedback doubling the GH gas effects, does not exist.”
“The CO2 emissions from 2000 onward represent about one-third of the total emissions since 1750, but the temperature has not increased, and it has paused at the present level. This is worthy proof that the IPCC’s climate model has overestimated human-induced causes and has probably underestimated natural causes like the sun’s activity changes, considering the historical temperatures during the past 2000 years.”
“The RF [radiative forcing] value for the CO2 concentration of 560 ppm is 2.16 Wm−2 according to equation (3), which is 42 per cent smaller than 3.7 Wm−2 used by the IPCC. The same study of Ollila (2014) shows that the CS [climate sensitivity] parameter λ is 0.27 K/(Wm−2), which means that there is no water feedback. Using this λ value, equation (3) gives a TCS [transient climate sensitivity] value of 0.6°C only. This same result is also reported by Harde (2014) using the spectral analysis method. …There are both theoretical- and measurement-based studies showing results that can be explained only by the fact that there is no positive water feedback. This result reduces the CS [climate sensitivity] by 50 per cent. Some research studies show that the RF [radiative forcing] value of carbon dioxide is considerably smaller than the commonly used RF value, according to the equation of Myhre et al. (1998). Because of these two causes, the critical studies show a TCS [transient climate sensitivity] of about 0.6°C instead of 1.9°C by the IPCC, a 200 per cent difference.”
https://www.tandfonline.com/doi/full/10.1080/01431161.2018.1444293
“All datasets produce high correlations of anomalies versus independent observations from radiosondes (balloons), but differ somewhat in the metric of most interest, the linear trend beginning in 1979. The trend is an indicator of the response of the climate system to rising greenhouse gas concentrations and other forcings, and so is critical to understanding the climate. The satellite results indicate a range of near-global (+0.07 to +0.13°C decade−1) […] trends (1979–2016), and suggestions are presented to account for these differences. We show evidence that MSUs on National Oceanic and Atmospheric Administration’s satellites (NOAA-12 and −14, 1990–2001+) contain spurious warming, especially noticeable in three of the four satellite datasets.”
“Comparisons with radiosonde datasets independently adjusted for inhomogeneities and Reanalyses suggest the actual tropical (20°S-20°N) trend is +0.10 ± 0.03°C decade−1. This tropical result is over a factor of two less than the trend projected from the average of the IPCC climate model simulations for this same period (+0.27°C decade−1). … Because the model trends are on average highly significantly more positive and with a pattern in which their warmest feature appears in the latent-heat release region of the atmosphere, we would hypothesize that a misrepresentation of the basic model physics of the tropical hydrologic cycle (i.e. water vapour, precipitation physics and cloud feedbacks) is a likely candidate.”
Challenges and opportunities for improved understanding of regional climate dynamics | Nature Climate Change
“Here there is a dynamical gap in our understanding. While we have conceptual models of how weather systems form and can predict their evolution over days to weeks, we do not have theories that can adequately explain the reasons for an extreme cold or warm, or wet or dry, winter at continental scales. More importantly, we do not have the ability to credibly predict such states. Likewise, we can build and run complex models of the Earth system, but we do not have adequate enough understanding of the processes and mechanisms to be able to quantitatively evaluate the predictions and projections they produce, or to understand why different models give different answers. … The global warming ‘hiatus’ provides an example of a climate event potentially related to inter-basin teleconnections. While decadal climate variations are expected, the magnitude of the recent event was unforeseen. A decadal period of intensified trade winds in the Pacific and cooler sea surface temperatures (SSTs) has been identified as a leading candidate mechanism for the global slowdown in warming.”
Global models underestimate large decadal declining and rising water storage trends relative to GRACE satellite data
“The models underestimate the large decadal (2002–2014) trends in water storage relative to GRACE satellites, both decreasing trends related to human intervention and climate and increasing trends related primarily to climate variations. The poor agreement between models and GRACE underscores the challenges remaining for global models to capture human or climate impacts on global water storage trends. … Increasing TWSA [total water storage anomalies] trends are found primarily in nonirrigated basins, mostly in humid regions, and may be related to climate variations. Models also underestimate median GRACE increasing trends(1.6–2.1 km3/y) by up to a factor of ∼8 in GHWRMs [global hydrological and water resource models] (0.3–0.6 km3/y). Underestimation of GRACE-derived TWSA increasing trends is much greater for LSMs [global land surface models], with four of the five LSMs [global land surface models] yielding opposite trends (i.e., median negative rather than positive trends).”
“Increasing GRACE trends are also found in surrounding basins, with most models yielding negative trends. Models greatly underestimate the increasing trends in Africa, particularly in southern Africa. .. TWSA trends from GRACE in northeast Asia are generally increasing, but many models show decreasing trends, particularly in the Yenisei. … Subtracting the modeled human intervention contribution from the total land water storage contribution from GRACE results in an estimated climate-driven contribution of −0.44 to −0.38 mm/y. Therefore, the magnitude of the estimated climate contribution to GMSL [global mean sea level] is twice that of the human contribution and opposite in sign. While many previous studies emphasize the large contribution of human intervention to GMSL [global mean sea level], it has been more than counteracted by climate-driven storage increase on land over the past decade.”
And those are just the tip of the iceberg, and were published in the past year... There are dozens of studies highlighting the weakness, and unreliability of climate models. The output of climate modeling simulations simply is not data that is useful support if you are trying to demonstrate man made climate change.
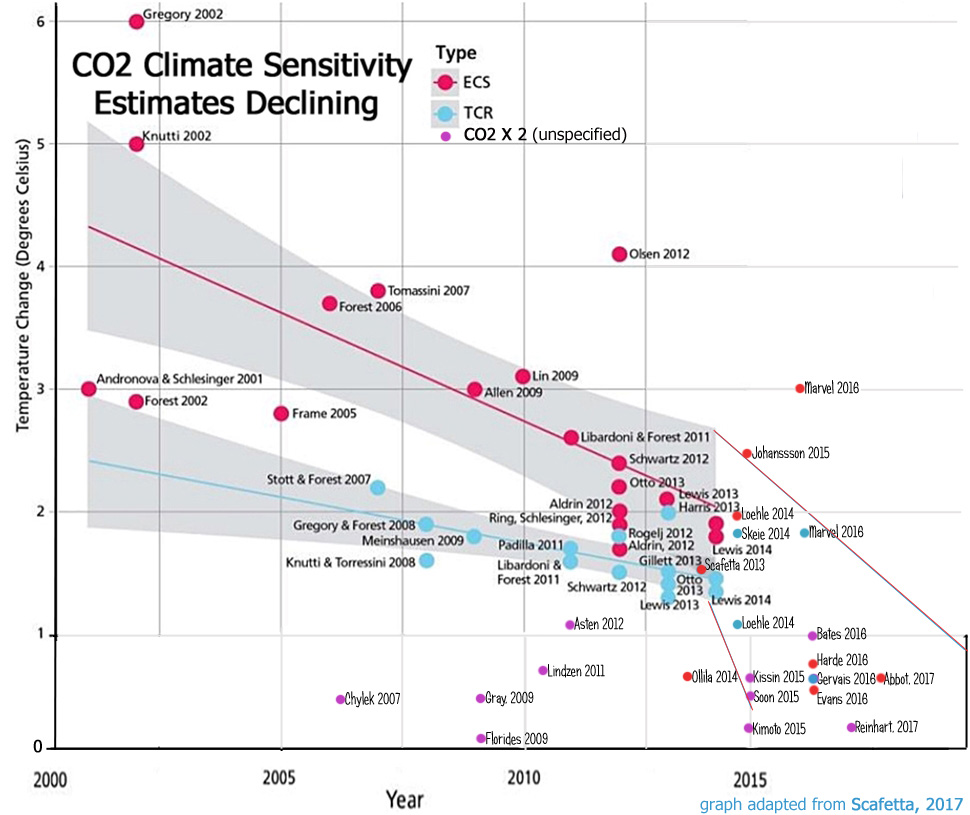
The very idea of CO2 being a control knob for the climate is laughable...way back in 2000, climate science was quite sure that the climate sensitivity to CO2 was somewhere between 3 and 5 degrees and some thought it was as high as 6 degrees per doubling of CO2... In the years since then, that number has continued to drop...and drop quite rapidly indicating that the 2010 NASA claim of CO2 being a control knob was quite wrong. By 2010 that figure had dropped considerably...and it has dropped even further since then...by 2015 the number was less than 1 degree and by the end of last year, it was closer to 0.5 degrees per doubling and the number is still falling. Hardly a control knob.
The climate sensitivity to CO2 is trending towards zero...and even the hard core climate alarmists on this board have been backing away from any mention of CO2 being a control knob and have even gone so far as to deny that such a term was ever used in association with CO2...I appreciate you providing a link to that...It will be a handy reminder to the hard core alarmists that in fact, climate science did claim that CO2 was the control knob of the climate..
Infrared Atmospheric Emission (~0.4C)
http://www.entrelemanetjura.ch/BLOG_WP_351/wp-content/uploads/2017/01/2017.01-20-FKR-sur-CO2.pdf (<0.24C)
https://www.sciencedirect.com/science/article/pii/S2214242817300426 (~0.6C equilibrium)
One other thing regarding the claim that CO2 is any sort of a control knob for the climate...Are you aware, that there has not been a single paper published in which the claimed warming due to our emission of CO2 and other so called greenhouse gasses has been empirically measured, quantified, and ascribed to said greenhouse gasses? Not one single paper...
That being the case, it surprises me how many people will look at you with a straight face and tell you that the science is settled..or that the debate is over...
And again....I find it very interesting that in your initial post you were very explicit about peer reviewed research, and correct me if I am wrong but thus far, you have not provided the first piece of peer reviewed research.
Last edited:
