Noaa says July was hottest in 136 years!

Proxies. Yeah right. Those are so accurate they can be calculated down to the hundredth of a degree.
Another idiot who doesn't understand how averaging a group of numbers involves division, which can produce any number of decimal places even when dividing whole numbers. :cuckoo:

I love how these morons, who can't comprehend the simplest arithmetic, have convinced themselves that they are smarter than any scientist! :cuckoo:

When ya got only 78 actual measurements (see Marcott for example) to cover the globe in a proxy temperature study --- MOST of your data is interpolated, homogenized or otherwise modeled. Under those conditions doesn't matter how many places to the right of the division result you preserve. Furthermore since you can't get ice cores in the middle of Africa, you use some OTHER proxy with lesser or greater accuracy. So your 78 global measurements are now a muddle of sea shells, tree rings, and ice cores that aren't REAL thermometers and require a TON of filtering and screwing around with.

Results are such that they would NEVER show a temperature blip like ours over 50 or 70 years of time. In fact, Marcott says his 10,000 year proxy temp study can NOT resolve events shorter than about 400 years !!!!
And at 200 years -- it will attenuate the highest and fastest events to about 50% of their REAL magnitude.

THAT'S not 0.1deg accuracy and WestWall was just being generous..:lmao:

And this shit about you better not TRY to understand this science -- is full of crap.. MANY of us work in disciplines that use the same scientific methods and tools and this data preparation and reading of a temperature curve is not really rocket science.
And yet deniers have no trouble using the same "proxy" data to claim it was warmer 10,000, or 100,000 or 1,000,000 or more years ago. Funny how when the same proxy data seems to support deniers it is suddenly infallible.


First off we use data that your side produces. Secondly the warming that the proxies, that we use, show is significant. We're not talking tenths of a degree like you love to point out, we're talking 3 to 5 degree's which MAY be factual. Proxy data (especially the use of tree rings which while very useful in determining RAINFALL, but far less compelling when it comes to determining temperature) is useful only when looking at large trends.

Trying to use proxy data to suggest a temperature to within a tenth of a degree is ludicrous.
 
Proxies. Yeah right. Those are so accurate they can be calculated down to the hundredth of a degree.
Another idiot who doesn't understand how averaging a group of numbers involves division, which can produce any number of decimal places even when dividing whole numbers. :cuckoo:

I love how these morons, who can't comprehend the simplest arithmetic, have convinced themselves that they are smarter than any scientist! :cuckoo:

When ya got only 78 actual measurements (see Marcott for example) to cover the globe in a proxy temperature study --- MOST of your data is interpolated, homogenized or otherwise modeled. Under those conditions doesn't matter how many places to the right of the division result you preserve. Furthermore since you can't get ice cores in the middle of Africa, you use some OTHER proxy with lesser or greater accuracy. So your 78 global measurements are now a muddle of sea shells, tree rings, and ice cores that aren't REAL thermometers and require a TON of filtering and screwing around with.

Results are such that they would NEVER show a temperature blip like ours over 50 or 70 years of time. In fact, Marcott says his 10,000 year proxy temp study can NOT resolve events shorter than about 400 years !!!!
And at 200 years -- it will attenuate the highest and fastest events to about 50% of their REAL magnitude.

THAT'S not 0.1deg accuracy and WestWall was just being generous..:lmao:

And this shit about you better not TRY to understand this science -- is full of crap.. MANY of us work in disciplines that use the same scientific methods and tools and this data preparation and reading of a temperature curve is not really rocket science.
And yet deniers have no trouble using the same "proxy" data to claim it was warmer 10,000, or 100,000 or 1,000,000 or more years ago. Funny how when the same proxy data seems to support deniers it is suddenly infallible.

Hey !!! I MIGHT have done that a time or two..:whip:


Especially as it applies to proxy data on the Solar Irradiance.
So you're right in a fashion.. But what I believe after looking at the accuracy of these tree ring, and mud bug studies is that the INDIVIDUAL studies are far more instructive than these wild ass attempts to reconstruct GLOBAL temperatures from 1000s of years ago. And if you look at the number of INDIVIDUAL proxies concerning the MEd. Warm Period for example -- It's pretty clear you can see signatures of that event all around the globe. NOT just limited to northern tier.. And yes -- MANY of these studies do indicate comparable or GREATER warming than today..
 
UAH_LT_1979_thru_July_2015_v6.png


Now look closely A.P. and all the other Chicken Littles. This is the satellite record which up to recently has been agreeing BRILLIANTLY with the surface readings that are held and cooked by the same folks CLAIMING records.
Yeah, right up to Spencer & Christy changing the UAH measurement standards yet again, the same Spencer & Christy who got caught fudging the numbers in the past to turn global warming into global cooling which were corrected in v5.2 when they then matched the ground stations almost exactly. Each following new version deviated more and more from the surface measurements, funny that! In the current v6.0 UAH has reduced sensitivity to land surface emission, making it a more purely tropospheric measure and more different from the surface, but the deniers never bitch about that fudging of the numbers because Spencer's manipulations reduce global warming.

There is no continuing "scandal" surrounding the VERY SMALL adjustment and error that you are referring to. That happened a long time ago now and both satellite records UAH and RSS have been extremely stable for decades. Can't believe the # of folk who want to impeach space science in favor of 100,000 thermometers with big gaps in the coverage.

UAH and RSS track a lot better together than the cooked GISS and Hadley data...
Even Spencer has admitted that the RSS data UNDERESTIMATES global temperature, and now with his v6.0 his fudged numbers are cooler than RSS.

Anyway, my UAH cohort and boss John Christy, who does the detailed matching between satellites, is pretty convinced that the RSS data is undergoing spurious cooling because RSS is still using the old NOAA-15 satellite which has a decaying orbit, to which they are then applying a diurnal cycle drift correction based upon a climate model, which does not quite match reality.
-Roy Spencer, 2011

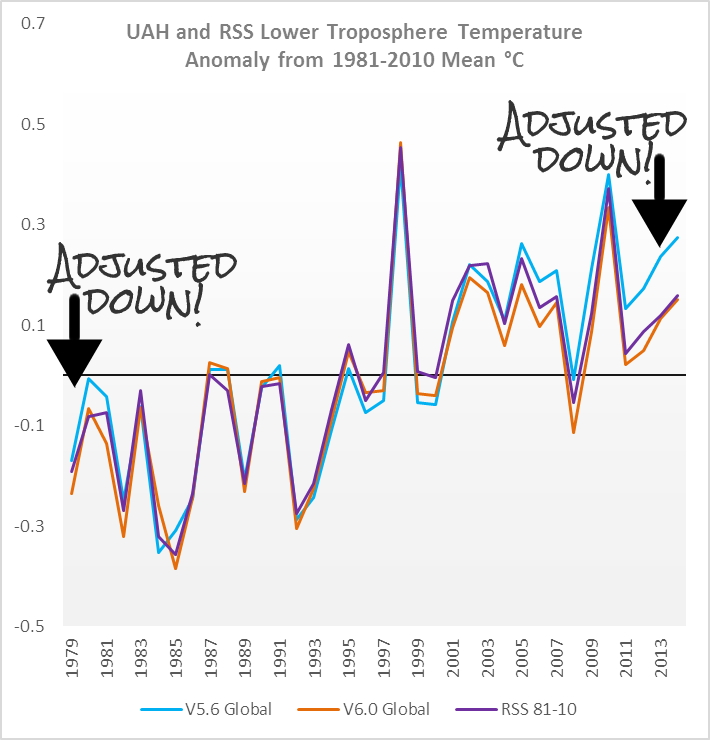
Everything in temperature measurement that USED have generally good agreement is diverging. But from the chart below.. Either UAH is ADDING warming or Dr Roy's comments above might be correct..

Yearly-global-LT-UAH-RSS-thru-Sept-2014.png


What you DON'T have in the satellite record is CONTINUOUS wholesale adjustments of historical value by DATE that truly seem to want to hockey stick the fuck out of the raw data. When UAH or RSS is updated -- it is generally uniformly updated over the whole 40 year time span. With the exception of orbital issues like what might be appearing above..
That is NOT v6.0, that is v5.6. You are not smart enough to deceive me, there Slick!

V6-vs-v5.6-LT-1979-Mar2015.gif

UAH%2Bv6%2BRSS%2Band%2BUAH%2Bv5.6.png
 
Last edited:
Warm Period for example -- It's pretty clear you can see signatures of that event all around the globe

To most people, it pretty clear that's nonsense, because the evidence says it's nonsense.

But then, as usual, you're one of the very special crowd who understands the RealTruth.

NOT just limited to northern tier.. And yes -- MANY of these studies do indicate comparable or GREATER warming than today..

You understand that the "CO2 Science" website is dishonest cherrypicked nonsense? And that even what it cherrypicks doesn't back up such crazy claims?

No matter. The scientists all understand.
 
There is no continuing "scandal" surrounding the VERY SMALL adjustment and error that you are referring to. That happened a long time ago now and both satellite records UAH and RSS have been extremely stable for decades. Can't believe the # of folk who want to impeach space science in favor of 100,000 thermometers with big gaps in the coverage.

UAH and RSS track a lot better together than the cooked GISS and Hadley data...
Even Spencer has admitted that the RSS data UNDERESTIMATES global temperature, and now with his v6.0 his fudged numbers are cooler than RSS.

Anyway, my UAH cohort and boss John Christy, who does the detailed matching between satellites, is pretty convinced that the RSS data is undergoing spurious cooling because RSS is still using the old NOAA-15 satellite which has a decaying orbit, to which they are then applying a diurnal cycle drift correction based upon a climate model, which does not quite match reality.
-Roy Spencer, 2011

Everything in temperature measurement that USED have generally good agreement is diverging. But from the chart below.. Either UAH is ADDING warming or Dr Roy's comments above might be correct..

Yearly-global-LT-UAH-RSS-thru-Sept-2014.png


What you DON'T have in the satellite record is CONTINUOUS wholesale adjustments of historical value by DATE that truly seem to want to hockey stick the fuck out of the raw data. When UAH or RSS is updated -- it is generally uniformly updated over the whole 40 year time span. With the exception of orbital issues like what might be appearing above..
That is NOT v6.0, that is v5.6. You are not smart enough to deceive me, there Slick!

V6-vs-v5.6-LT-1979-Mar2015.gif

UAH%2Bv6%2BRSS%2Band%2BUAH%2Bv5.6.png

Your top chart shows no warming since 2001
 
Can we agree that since CO2 has never evah been this high, I mean evah, that this was the Hottest Summa Evah!

If the land records don't show it, just add in the oceans.

Yeah, that's the ticket
 
There is no continuing "scandal" surrounding the VERY SMALL adjustment and error that you are referring to. That happened a long time ago now and both satellite records UAH and RSS have been extremely stable for decades. Can't believe the # of folk who want to impeach space science in favor of 100,000 thermometers with big gaps in the coverage.

UAH and RSS track a lot better together than the cooked GISS and Hadley data...
Even Spencer has admitted that the RSS data UNDERESTIMATES global temperature, and now with his v6.0 his fudged numbers are cooler than RSS.

Anyway, my UAH cohort and boss John Christy, who does the detailed matching between satellites, is pretty convinced that the RSS data is undergoing spurious cooling because RSS is still using the old NOAA-15 satellite which has a decaying orbit, to which they are then applying a diurnal cycle drift correction based upon a climate model, which does not quite match reality.
-Roy Spencer, 2011

Everything in temperature measurement that USED have generally good agreement is diverging. But from the chart below.. Either UAH is ADDING warming or Dr Roy's comments above might be correct..

Yearly-global-LT-UAH-RSS-thru-Sept-2014.png


What you DON'T have in the satellite record is CONTINUOUS wholesale adjustments of historical value by DATE that truly seem to want to hockey stick the fuck out of the raw data. When UAH or RSS is updated -- it is generally uniformly updated over the whole 40 year time span. With the exception of orbital issues like what might be appearing above..
That is NOT v6.0, that is v5.6. You are not smart enough to deceive me, there Slick!

V6-vs-v5.6-LT-1979-Mar2015.gif

UAH%2Bv6%2BRSS%2Band%2BUAH%2Bv5.6.png

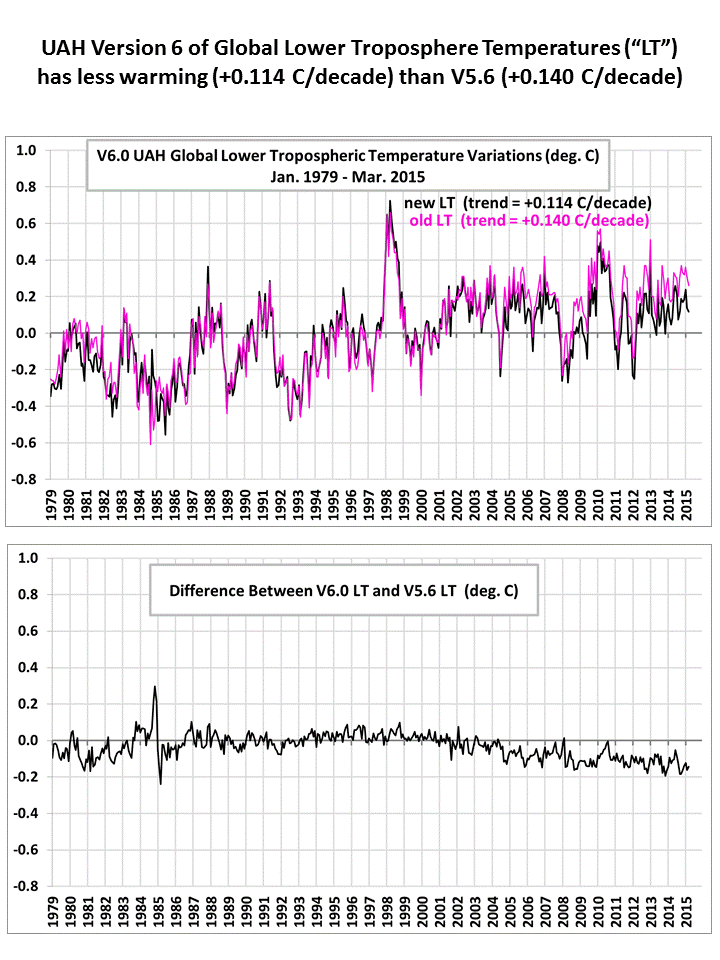
Good job. Version 6. just released this month.. The differences are miniscule for a GLOBAL result. If you read the detailed description of the changes it comes from regional differences due to geometry corrections for the new methodology. Some regions up -- other down. The difference chart is on the order 0.12 MAX for the entire freaking globe !!! And the difference to the decadal trend rate is 0.02deg/decade.

Version 6.0 of the UAH Temperature Dataset Released: New LT Trend = +0.11 C/decade « Roy Spencer, PhD

UAH NEW results end the discrepancy with RSS --- you should be thrilled. Better result since they both use the same satellite resources AND --- UAH EXPLAINS the adjustments.. Go fetch me the GISS description of their adjustments and WHY they occur CONSTANTLY to 1930's data.. Go fix THAT divergence with the sat record now..

They'll eventually tell you that "expert interpretation" is required for most of their "data creation" to fill in the reporting gaps.

Would MUCH rather correct for a fleet of 12 satellites that cover more area more consistently -- than 100,000 thermometers with random surface coverage..
You just want to keep playing dumb rather than admit Spencer and Christy are up to their old tricks of cooking the data. As I pointed out Spencer admitted in 2011 that the RSS data was artificially LOW, and now he has fudged his UAH data so it is LOWER than RSS.

Just to refresh your faulty memory:

Anyway, my UAH cohort and boss John Christy, who does the detailed matching between satellites, is pretty convinced that the RSS data is undergoing spurious cooling because RSS is still using the old NOAA-15 satellite which has a decaying orbit, to which they are then applying a diurnal cycle drift correction based upon a climate model, which does not quite match reality.
-Roy Spencer, 2011
 
Proxies. Yeah right. Those are so accurate they can be calculated down to the hundredth of a degree.
Another idiot who doesn't understand how averaging a group of numbers involves division, which can produce any number of decimal places even when dividing whole numbers. :cuckoo:

I love how these morons, who can't comprehend the simplest arithmetic, have convinced themselves that they are smarter than any scientist! :cuckoo:

When ya got only 78 actual measurements (see Marcott for example) to cover the globe in a proxy temperature study --- MOST of your data is interpolated, homogenized or otherwise modeled. Under those conditions doesn't matter how many places to the right of the division result you preserve. Furthermore since you can't get ice cores in the middle of Africa, you use some OTHER proxy with lesser or greater accuracy. So your 78 global measurements are now a muddle of sea shells, tree rings, and ice cores that aren't REAL thermometers and require a TON of filtering and screwing around with.

Results are such that they would NEVER show a temperature blip like ours over 50 or 70 years of time. In fact, Marcott says his 10,000 year proxy temp study can NOT resolve events shorter than about 400 years !!!!
And at 200 years -- it will attenuate the highest and fastest events to about 50% of their REAL magnitude.

THAT'S not 0.1deg accuracy and WestWall was just being generous..:lmao:

And this shit about you better not TRY to understand this science -- is full of crap.. MANY of us work in disciplines that use the same scientific methods and tools and this data preparation and reading of a temperature curve is not really rocket science.
And yet deniers have no trouble using the same "proxy" data to claim it was warmer 10,000, or 100,000 or 1,000,000 or more years ago. Funny how when the same proxy data seems to support deniers it is suddenly infallible.
Well other than oil and fossilized palm trees above the artic ,thinking that's not proxy data
 
There is no continuing "scandal" surrounding the VERY SMALL adjustment and error that you are referring to. That happened a long time ago now and both satellite records UAH and RSS have been extremely stable for decades. Can't believe the # of folk who want to impeach space science in favor of 100,000 thermometers with big gaps in the coverage.

UAH and RSS track a lot better together than the cooked GISS and Hadley data...
Even Spencer has admitted that the RSS data UNDERESTIMATES global temperature, and now with his v6.0 his fudged numbers are cooler than RSS.

Anyway, my UAH cohort and boss John Christy, who does the detailed matching between satellites, is pretty convinced that the RSS data is undergoing spurious cooling because RSS is still using the old NOAA-15 satellite which has a decaying orbit, to which they are then applying a diurnal cycle drift correction based upon a climate model, which does not quite match reality.
-Roy Spencer, 2011

Everything in temperature measurement that USED have generally good agreement is diverging. But from the chart below.. Either UAH is ADDING warming or Dr Roy's comments above might be correct..

Yearly-global-LT-UAH-RSS-thru-Sept-2014.png


What you DON'T have in the satellite record is CONTINUOUS wholesale adjustments of historical value by DATE that truly seem to want to hockey stick the fuck out of the raw data. When UAH or RSS is updated -- it is generally uniformly updated over the whole 40 year time span. With the exception of orbital issues like what might be appearing above..
That is NOT v6.0, that is v5.6. You are not smart enough to deceive me, there Slick!

V6-vs-v5.6-LT-1979-Mar2015.gif

UAH%2Bv6%2BRSS%2Band%2BUAH%2Bv5.6.png

Good job. Version 6. just released this month.. The differences are miniscule for a GLOBAL result. If you read the detailed description of the changes it comes from regional differences due to geometry corrections for the new methodology. Some regions up -- other down. The difference chart is on the order 0.12 MAX for the entire freaking globe !!! And the difference to the decadal trend rate is 0.02deg/decade.

Version 6.0 of the UAH Temperature Dataset Released: New LT Trend = +0.11 C/decade « Roy Spencer, PhD

UAH NEW results end the discrepancy with RSS --- you should be thrilled. Better result since they both use the same satellite resources AND --- UAH EXPLAINS the adjustments.. Go fetch me the GISS description of their adjustments and WHY they occur CONSTANTLY to 1930's data.. Go fix THAT divergence with the sat record now..

They'll eventually tell you that "expert interpretation" is required for most of their "data creation" to fill in the reporting gaps.

Would MUCH rather correct for a fleet of 12 satellites that cover more area more consistently -- than 100,000 thermometers with random surface coverage..
You just want to keep playing dumb rather than admit Spencer and Christy are up to their old tricks of cooking the data. As I pointed out Spencer admitted in 2011 that the RSS data was artificially LOW, and now he has fudged his UAH data so it is LOWER than RSS.

Just to refresh your faulty memory:

Anyway, my UAH cohort and boss John Christy, who does the detailed matching between satellites, is pretty convinced that the RSS data is undergoing spurious cooling because RSS is still using the old NOAA-15 satellite which has a decaying orbit, to which they are then applying a diurnal cycle drift correction based upon a climate model, which does not quite match reality.
-Roy Spencer, 2011

Fudge eh? Entirely new algorithm that gives approximately the same results as RSS for the entire globe..
I'd say both these groups are doing well. In the realm of statistical significance for a measurement like that -- it is not LOWER than RSS...

Why don't you be objective and see what the performance IS for a year or two? You or anyone else can always go back and ask them to compare to the last revision.
It IS lower than RSS and Spencer and Christy admit RSS is artificially low.
Deniers depend entirely on flawed data and fudged data and any data that doesn't match their flawed fudged data is suspect.

C'mon. I know you are cynic -- but the difference after this change is on the order of 0.04degC for the ENTIRE GLOBE. Meaning that for any one measurement -- the likely "disagreement" would be in the THIRD digit to the right of the decimal point. Doesn't matter a WHIT to calculating the degrees/decade rate..

And Spencer tossed out that comment on RSS --- FOUR YEARS AGO --- because at that time they may have believed an issue with an errant satellite that is not being corrected for. But this revamp may have answered that question.. What they are doing is DIFFERENT in many ways from RSS -- and when they saw the result 4 years later -- maybe that changed their minds. Or RSS convinced them otherwise.

Everybody is happy with the OPEN DOCUMENTED work that done there in data preparation. GISS and Hadley --- secret butcher shops for data and no transparency at all..
 
And Spencer tossed out that comment on RSS --- FOUR YEARS AGO --- because at that time they may have believed an issue with an errant satellite that is not being corrected for. But this revamp may have answered that question.. What they are doing is DIFFERENT in many ways from RSS -- and when they saw the result 4 years later -- maybe that changed their minds. Or RSS convinced them otherwise.
Pure hogwash!
Notice how deniers can rationalize that data they know is fudged is better than real data. All that matters is that they can claim the globe is cooling and that settles the reliability of any data that gets them there.
 
July

July 2015 Blended Land and Sea Surface
Temperature Percentiles

The combined average temperature over global land and ocean surfaces for July 2015 was the highest for July in the 136-year period of record, at 0.81°C (1.46°F) above the 20th century average of 15.8°C (60.4°F), surpassing the previous record set in 1998 by 0.08°C (0.14°F). As July is climatologically the warmest month of the year globally, this monthly global temperature of 16.61°C (61.86°F) was also the highest among all 1627 months in the record that began in January 1880. The July temperature is currently increasing at an average rate of 0.65°C (1.17°F) per century.

Separately, the July average temperature across global land surfaces was 0.96°C (1.73°F) above the 20th century average, the sixth warmest for July on record. Large regions of Earth's land surfaces were much warmer than average, according to the Land & Ocean Temperature Percentiles map above. The average temperature for Africa was the second highest for July on record, behind only 2002, with regional record warmth across much of eastern Africa into central areas of the continent. Record warmth was also observed across much of northern South America, parts of southern Europe and central Asia, and the far western United States. A large swath stretching from eastern Scandinavia into western Siberia was cooler than average, with part of western Russia much cooler than average. Cooler than average temperatures were also observed across parts of eastern and southern Asia and scattered areas in central and northern North America.

The first seven months of 2015 comprised the warmest such period on record across the world's land and ocean surfaces, at 0.85°C (1.53°F) above the 20th century average, surpassing the previous record set in 2010 by 0.09°C (0.16°F).
Five months this year, including the past three, have been record warm for their respective months. January was the second warmest January on record and April third warmest.

The average global sea surface temperature of +0.67°C (+1.21°F) for the year-to-date was the highest for January–July in the 136-year period of record, surpassing the previous record of 2010 by 0.06°C (0.11°F). The average land surface temperature of +1.34°C (+2.41°F) was also the highest on record, surpassing the previous record of 2007 by 0.15°C (0.27°F).

Global Analysis - July 2015 | National Centers for Environmental Information (NCEI)

Damn,,,That is all that needs to be said.
Ok, cool. the cool of the day .quite cool to the touch. the shadows are getting longer .sometimes in late summer a cool breeze arrives, unnoticeable at first. then
 

Forum List

Back
Top