Arctic Sea Ice News at NSIDC.org
Conditions in context

Figure 2a. The graph above shows daily Arctic sea ice extent as of December 5, 2016, along with daily ice extent data for four previous years. 2016 is shown in blue, 2015 in green, 2014 in orange, 2013 in brown, and 2012 in purple. The 1981 to 2010 average is in dark gray. The gray area around the average line shows the two standard deviation range of the data.
Sea Ice Index data.
Credit: National Snow and Ice Data Center
High-resolution image

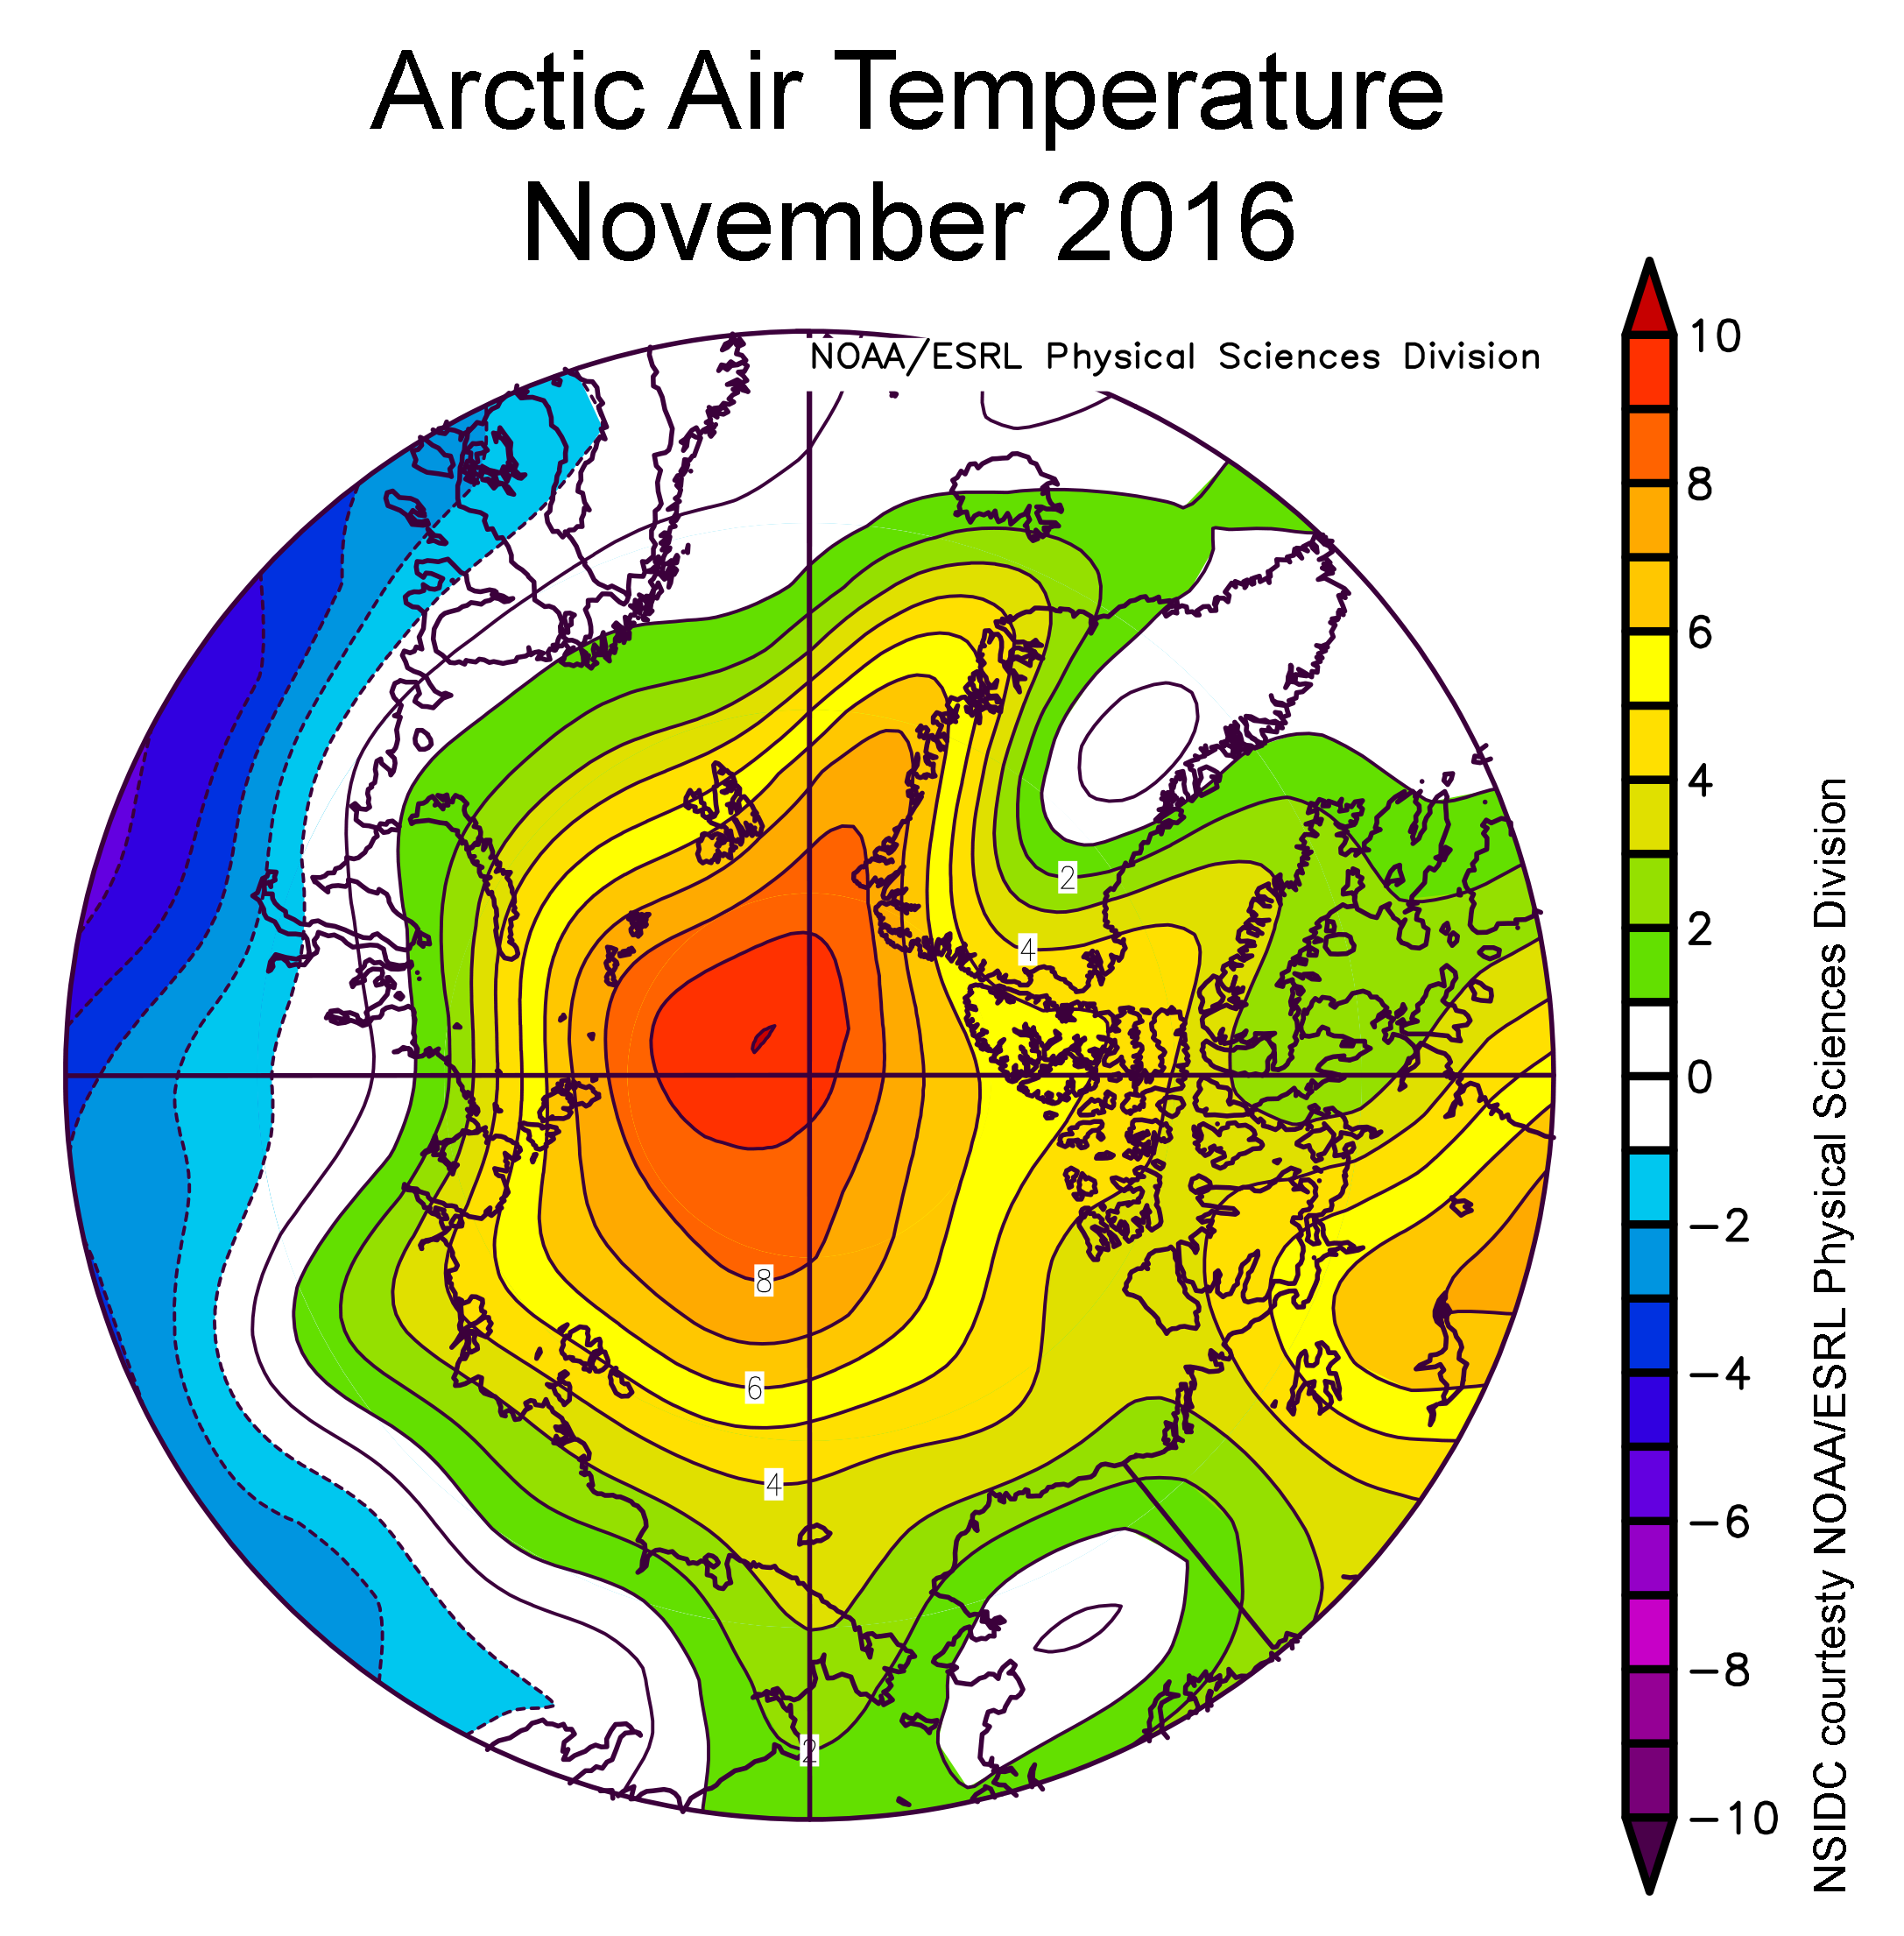
Figure 2b. This plot shows air temperature difference from average in the Arctic for November 2016. Air temperatures at the 925 hPa (approximately 2,500 feet) level in the atmosphere were above the 1981 to 2010 average over the entire Arctic Ocean and, locally up to 10 degrees Celsius (18 degrees Fahrenheit) above average near the North Pole. This is in sharp contrast to northern Eurasia, where temperatures were up to 4 to 8 degrees Celsius (7 to 14 degrees Fahrenheit) below average.
Credit: NSIDC courtesy NOAA/ESRL Physical Sciences Division
High-resolution image
Continuing the warm Arctic pattern seen in October, November air temperatures were far above average over the Arctic Ocean and Canada. Air temperatures at the 925 hPa level (about 2,500 feet above sea level) were above the 1981 to 2010 average over the entire Arctic Ocean and, locally up to 10 degrees Celsius (18 degrees Fahrenheit) above average near the North Pole. This is in sharp contrast to northern Eurasia, where temperatures were as much as 4 to 8 degrees Celsius (7 to 14 degrees Fahrenheit) below average (Figure 2b). Record snow events were reported in Sweden and across Siberia early in the month.
In autumn and winter, the typical cyclone path is from Iceland, across the Norwegian Sea and into the Barents Sea. This November, an unusual jet stream pattern set up, and storms instead tended to enter the Arctic Ocean through Fram Strait (between Svalbard and Greenland). This set up a pattern of southerly wind in Fram Strait, the Eurasian Arctic and the Barents Sea and accounts for some of the unusual warmth over the Arctic Ocean. The wind pattern also helped push the ice northwards and helps to explain why sea ice in the Barents Sea retreated during November.
Sea surface temperatures in the Barents and Kara Seas remained unusually high, which also helped prevent ice formation. These high sea surface temperatures are a result of warm Atlantic water circulating onto the Arctic continental shelf seas.
November 2016 compared to previous years

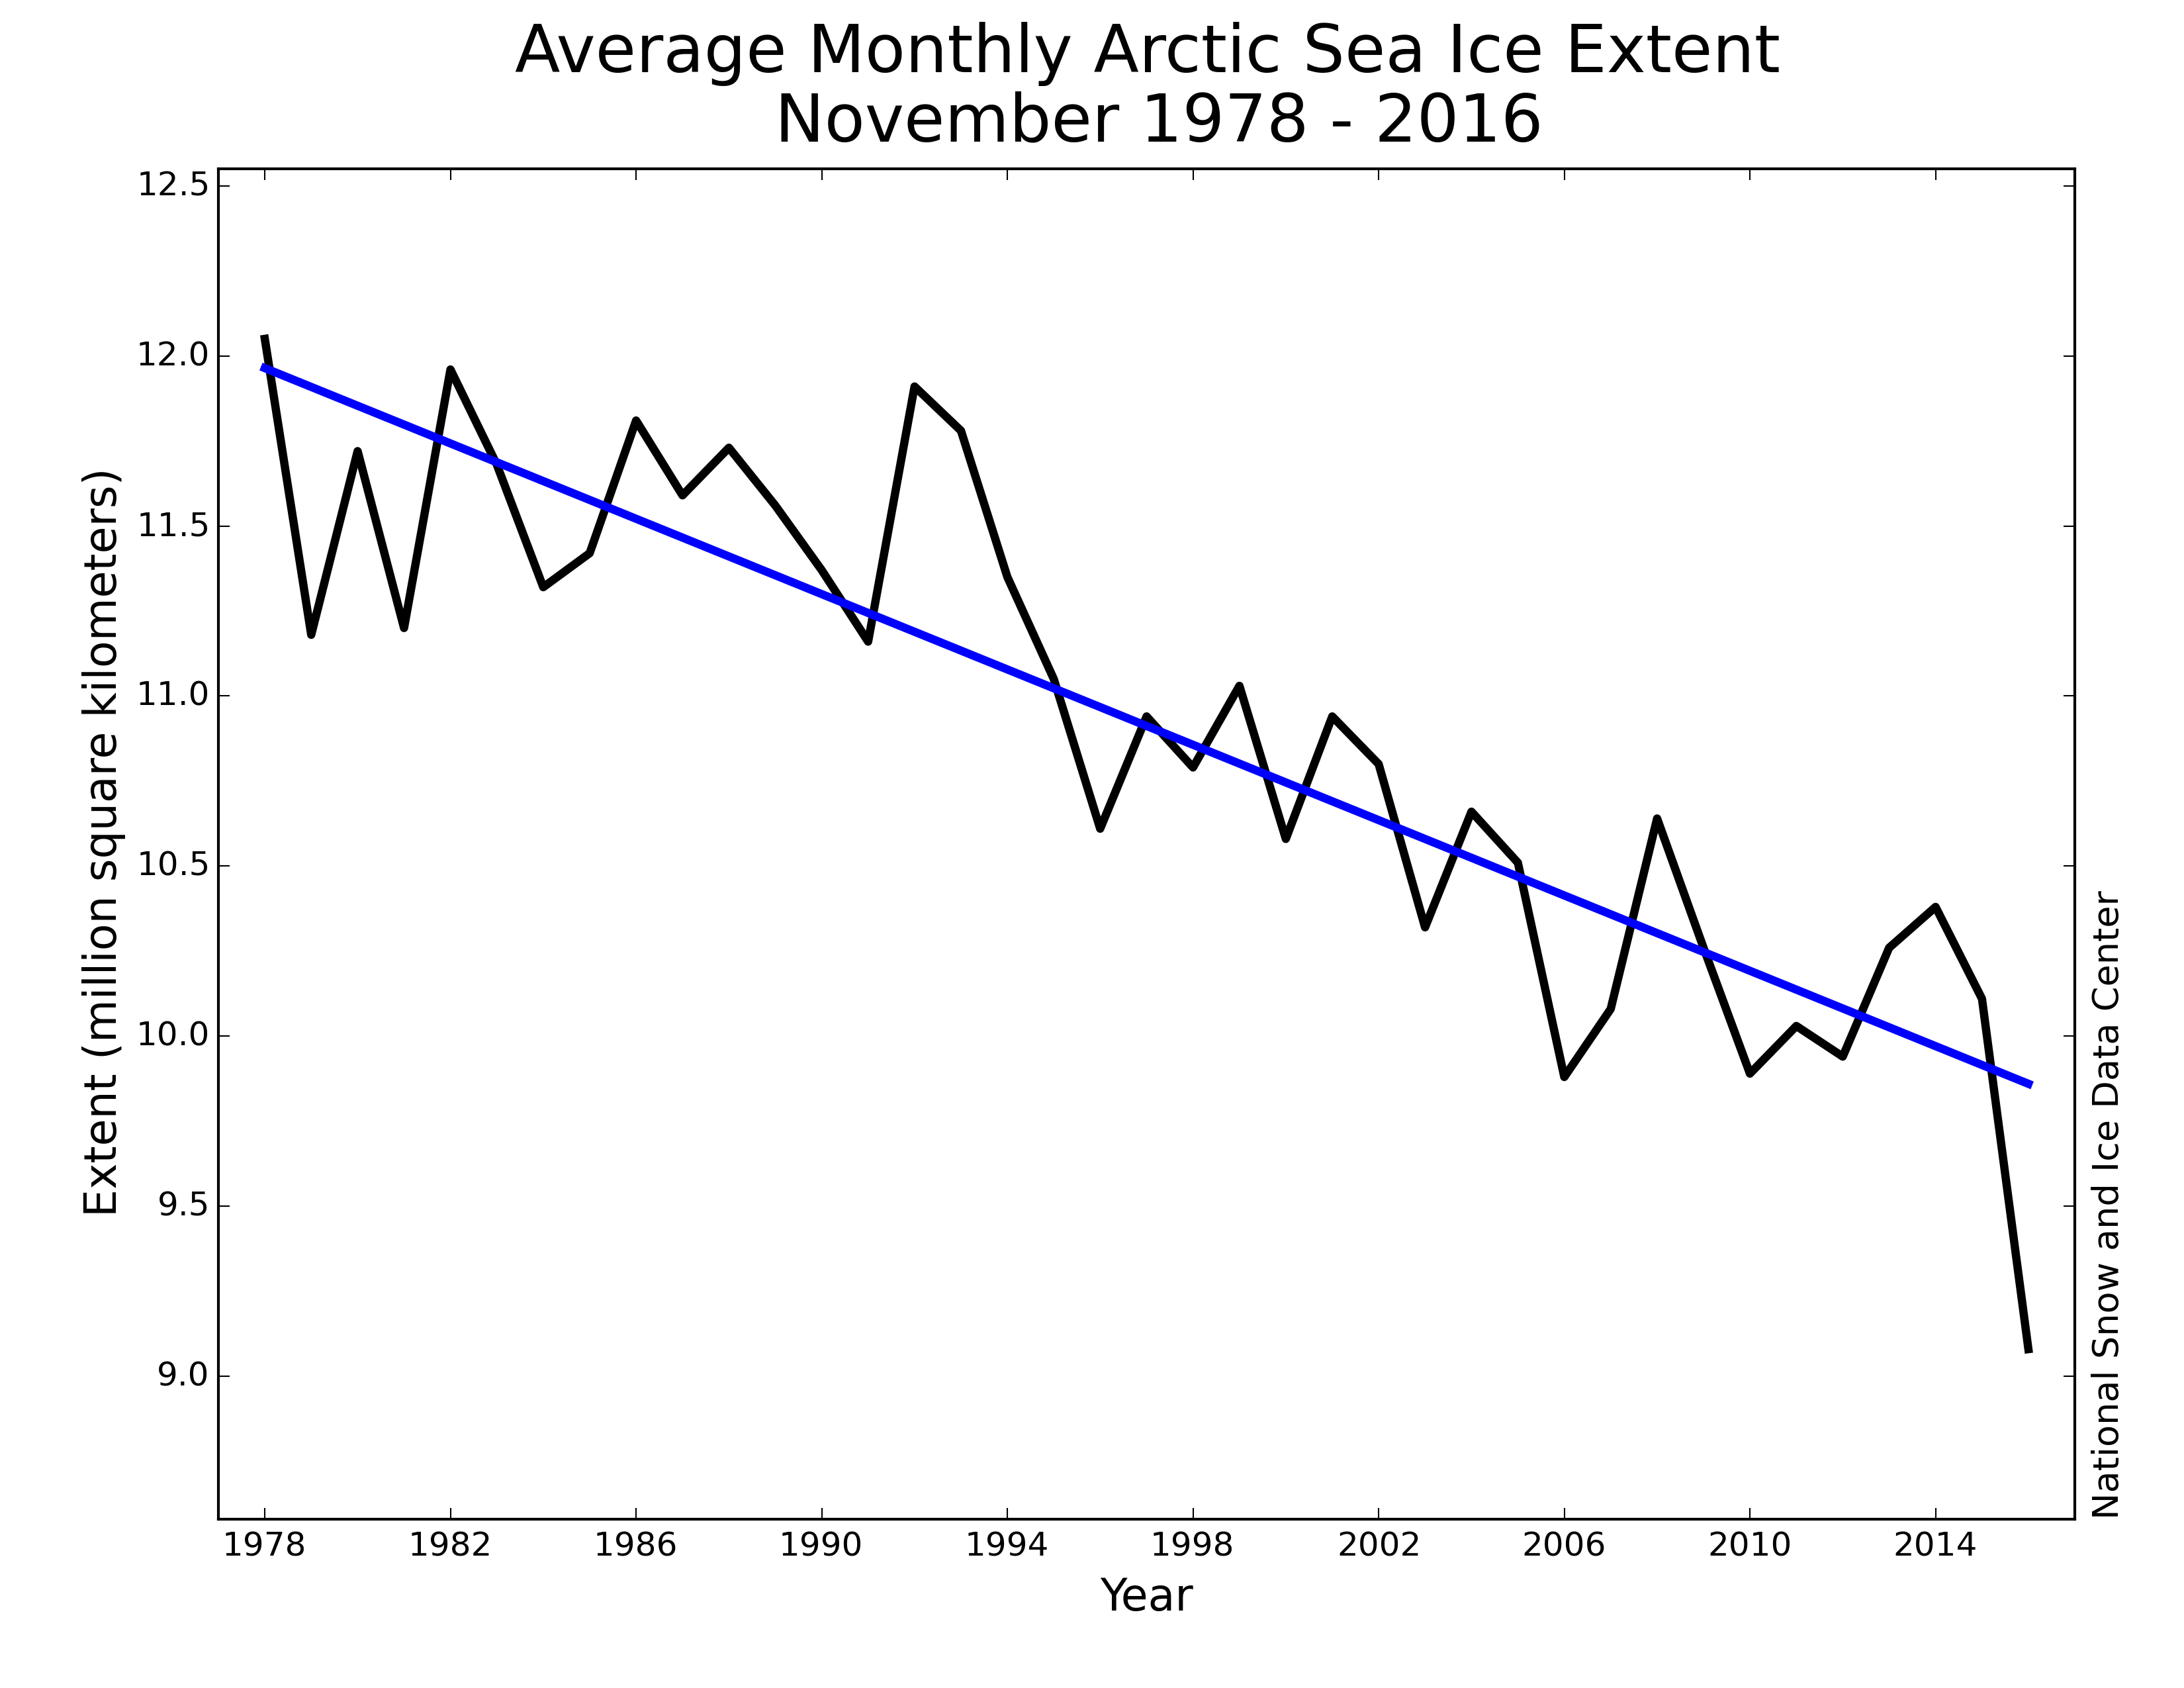
Figure 3. Monthly November ice extent for 1979 to 2016 shows a decline of 5.0 percent per decade.
Credit: National Snow and Ice Data Center
High-resolution image
Through 2016, the linear rate of decline for November is 55,400 square kilometers (21,400 square miles) per year, or 5.0 percent per decade.
Warm Arctic delays ice formation in Svalbard’s fjords

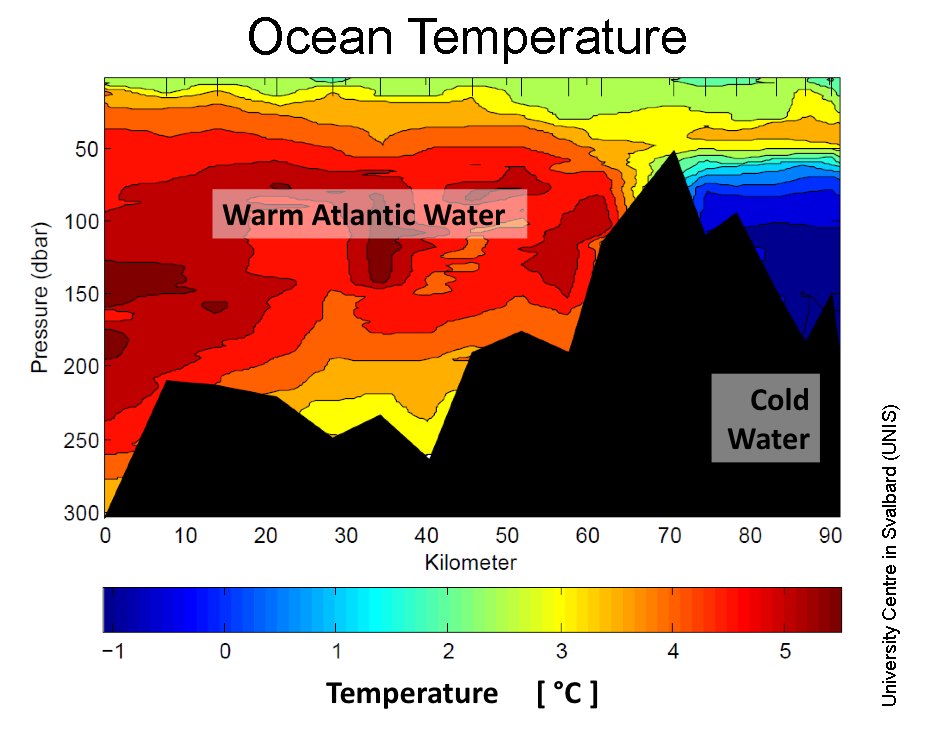
Figure 4a. This plot shows ocean temperature by depth (y axis, in decibars; a decibar is approximately one meter) along a transect (x axis, in kilometers) from the outer continental shelf to the inner parts of Isfjorden, the largest fjord in the Svalbard archipelago, for mid November 2016. (Areas in black show the undersea topography.) Atlantic Water is as warm as 5 degrees Celsius (41 degrees Fahrenheit) and the surface layer still about 2 degrees Celsius (36 degrees Fahrenheit). The surface layer would normally have cooled to the salinity adjusted freezing point at (-1.8 degrees Celsius, 29 degrees Fahrenheit) at this time of year, enabling sea ice formation.
Credit: University Centre in Svalbard
High-resolution image

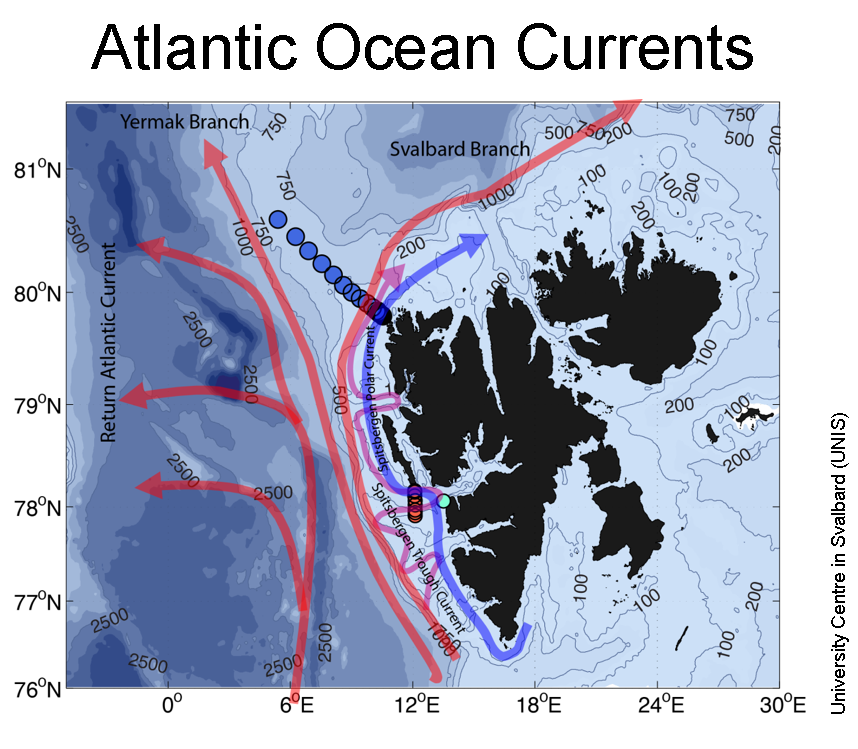
Figure 4b. The West Spitsbergen Current consists of three branches (red arrows) that transport warm and salty Atlantic Water northward: the Return Atlantic Current (westernmost branch), the Yermak Branch and the Svalbard Branch. The Spitsbergen Trough Current (purple) transports Atlantic Water from the Svalbard Branch into the troughs indenting the shelf along Svalbard. Since 2006, changes in atmospheric circulation have resulted in more warm Atlantic Water reaching these fjords. The blue and red circles on the figure indicate locations where hydrographic data were collected.
Credit: University Centre in Svalbard (UNIS)
High-resolution image

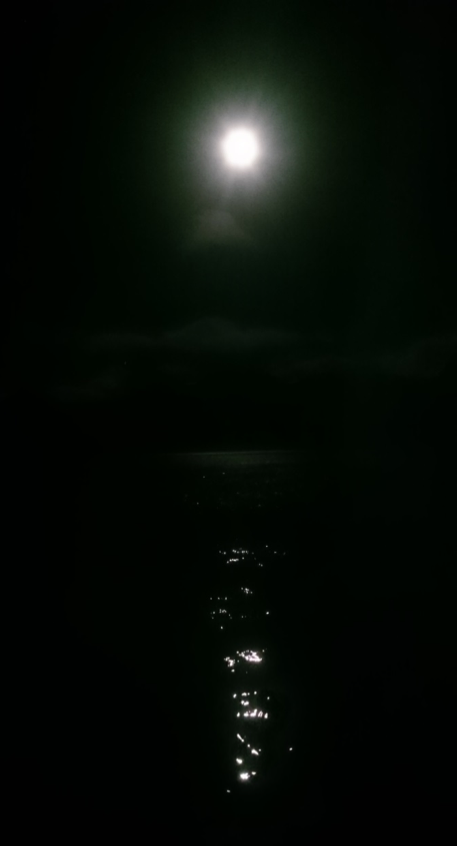
Figure 4c. An inky-black polar night—but no cooling. The moon is the only source of light in the Arctic now, and here shines over open water in Isfjorden, the largest fjord in the Svalbard archipelago, in mid-November 2016.
Credit: Lars H. Smedsrud
High-resolution image
In the Svalbard archipelago, sea ice usually begins to form in the inner parts of the fjords in early November. This November, however, no sea ice was observed. Throughout autumn, the wind pattern transported warm and moist air to Svalbard, leading to exceptionally high air temperatures and precipitation, which fell as rain.
Atmospheric and oceanic conditions in the fjord system were assessed by students from the University Centre in Svalbard. They noted an unusually warm ocean surface layer about 4 degrees Celsius (7 degrees Fahrenheit) above the salinity-adjusted freezing point (Figure 4a). Coinciding with exceptionally high air temperatures over Svalbard during autumn, the water has hardly cooled at all, and it is possible that no sea ice will form this winter.
The above average ocean temperatures arose in part from changes in ocean currents that bring warm and salty Atlantic Water into the fjords. As the warm Gulf Stream moves east, it becomes the branching North Atlantic Drift. One small branch is named the West Spitsbergen Current (Figure 4b). This current flows along the continental shelf on the west coast of Svalbard and is one mechanism for transporting heat towards the fjords. Since 2006, changes in atmospheric circulation have resulted in more Atlantic water reaching these fjords, reducing sea ice production in some and stopping ice formation entirely in others.


 Ryan Maue