From NSIDC.org. Not a word about satellite issues. And, since both temperatures and ice extents are changing, the problem would have to be simultaneous and synchronous in multiple satellites.
Sea ice hits record lows
December 6, 2016
Average Arctic sea ice extent for November set a record low, reflecting unusually high air temperatures, winds from the south, and a warm ocean. Since October, Arctic ice extent has been more than two standard deviations lower than the long-term average. Antarctic sea ice extent quickly declined in November, also setting a record low for the month and tracking more than two standard deviations below average during the entire month. For the globe as a whole, sea ice cover was exceptionally low.
Overview of conditions
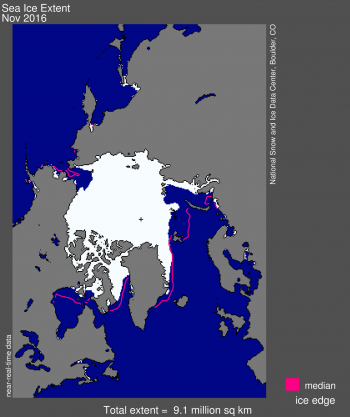
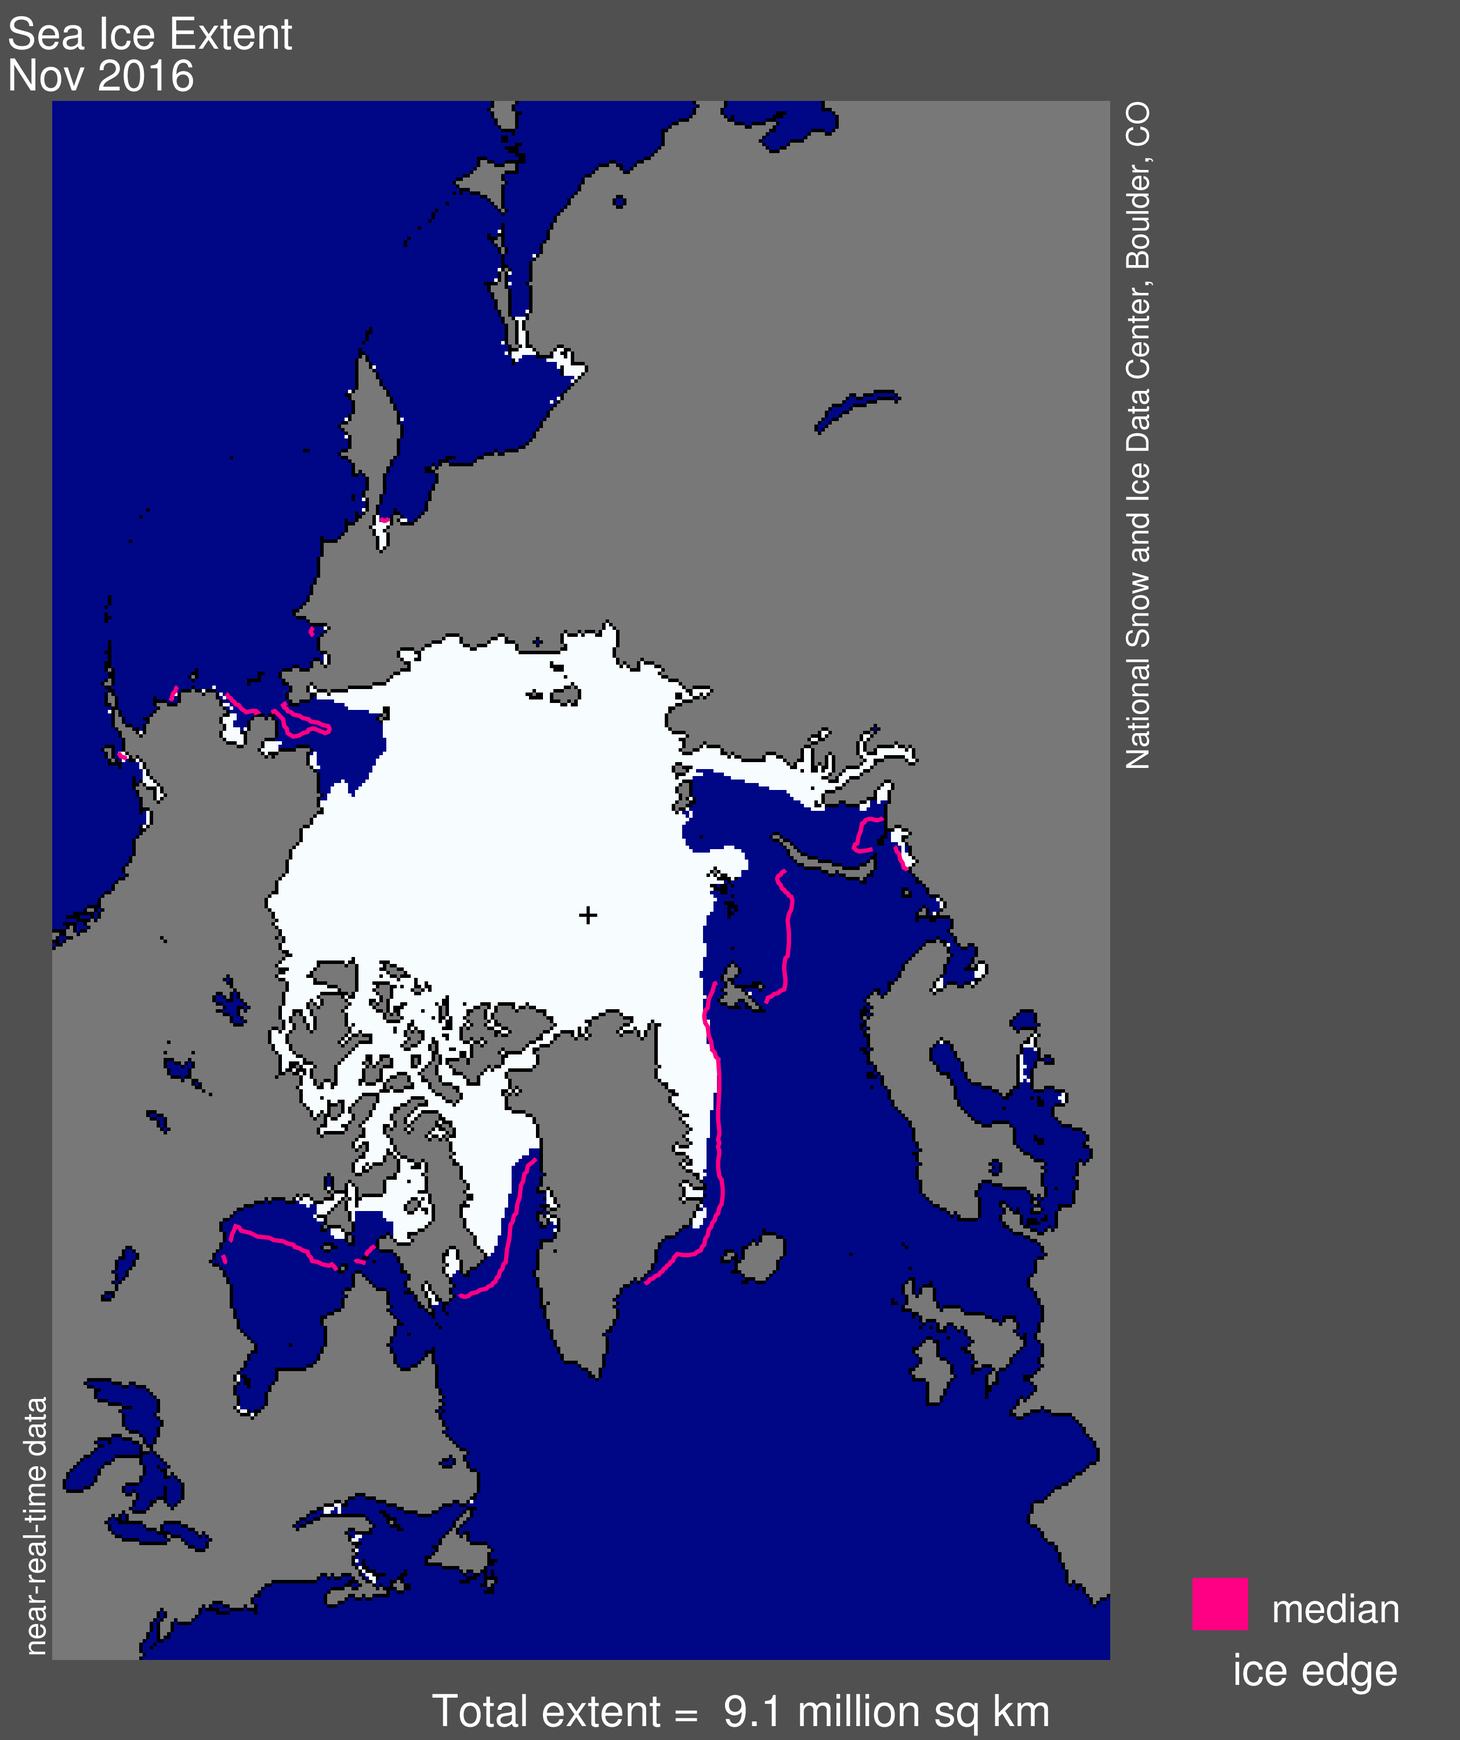
Figure 1. Arctic sea ice extent for November 2016 was 9.08 million square kilometers (3.51 million square miles). The magenta line shows the 1981 to 2010 median extent for the month. The black cross indicates the geographic North Pole.
Sea Ice Index data.
About the data
Credit: National Snow and Ice Data Center
High-resolution image
In November 2016, Arctic sea ice extent averaged 9.08 million square kilometers (3.51 million square miles), the lowest November in the satellite record. This is 800,000 square kilometers (309,000 square miles) below November 2006, the previous lowest November, and 1.95 million square kilometers (753,000 square miles) below the 1981 to 2010 long-term average for November. For the month, ice extent was 3.2 standard deviations below the long-term average, a larger departure than observed in September 2012 when the Arctic summer minimum extent hit a record low.
At this time of year, air temperatures near the surface of the Arctic Ocean are generally well below freezing, but this year has seen exceptional warmth. The overall rate of ice growth this November was 88,000 square kilometers (34,000 square miles) per day, a bit faster than the long-term average of 69,600 square kilometers (26,900 square miles) per day. However, for a brief period in the middle the month, total extent actually decreased by 50,000 square kilometers, or 19,300 square miles—an almost unprecedented occurrence for November over the period of satellite observations. A less pronounced and brief retreat of 14,000 square kilometers (5,400 square miles) occurred in 2013.
Ice growth during November as a whole occurred primarily within the Beaufort, Chukchi and East Siberian Seas, as well as within Baffin Bay. Ice extent slightly retreated in the Barents Sea for the month. Compared to the previous record low for the month set in 2006, sea ice was less extensive in the Kara, Barents, East Greenland, and Chukchi Seas, and more extensive in Baffin Bay this year.
Conditions in context

Figure 2a. The graph above shows daily Arctic sea ice extent as of December 5, 2016, along with daily ice extent data for four previous years. 2016 is shown in blue, 2015 in green, 2014 in orange, 2013 in brown, and 2012 in purple. The 1981 to 2010 average is in dark gray. The gray area around the average line shows the two standard deviation range of the data.
Sea Ice Index data.
Credit: National Snow and Ice Data Center
High-resolution image

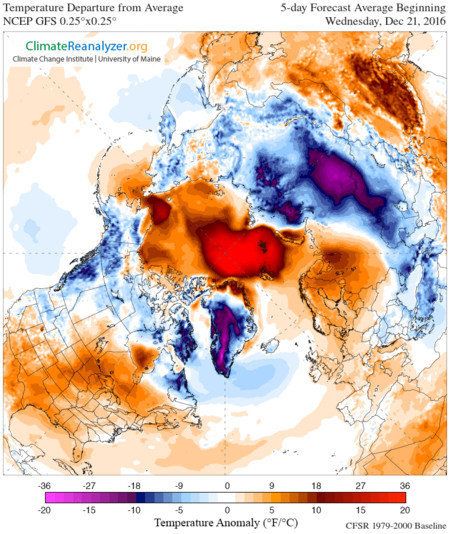
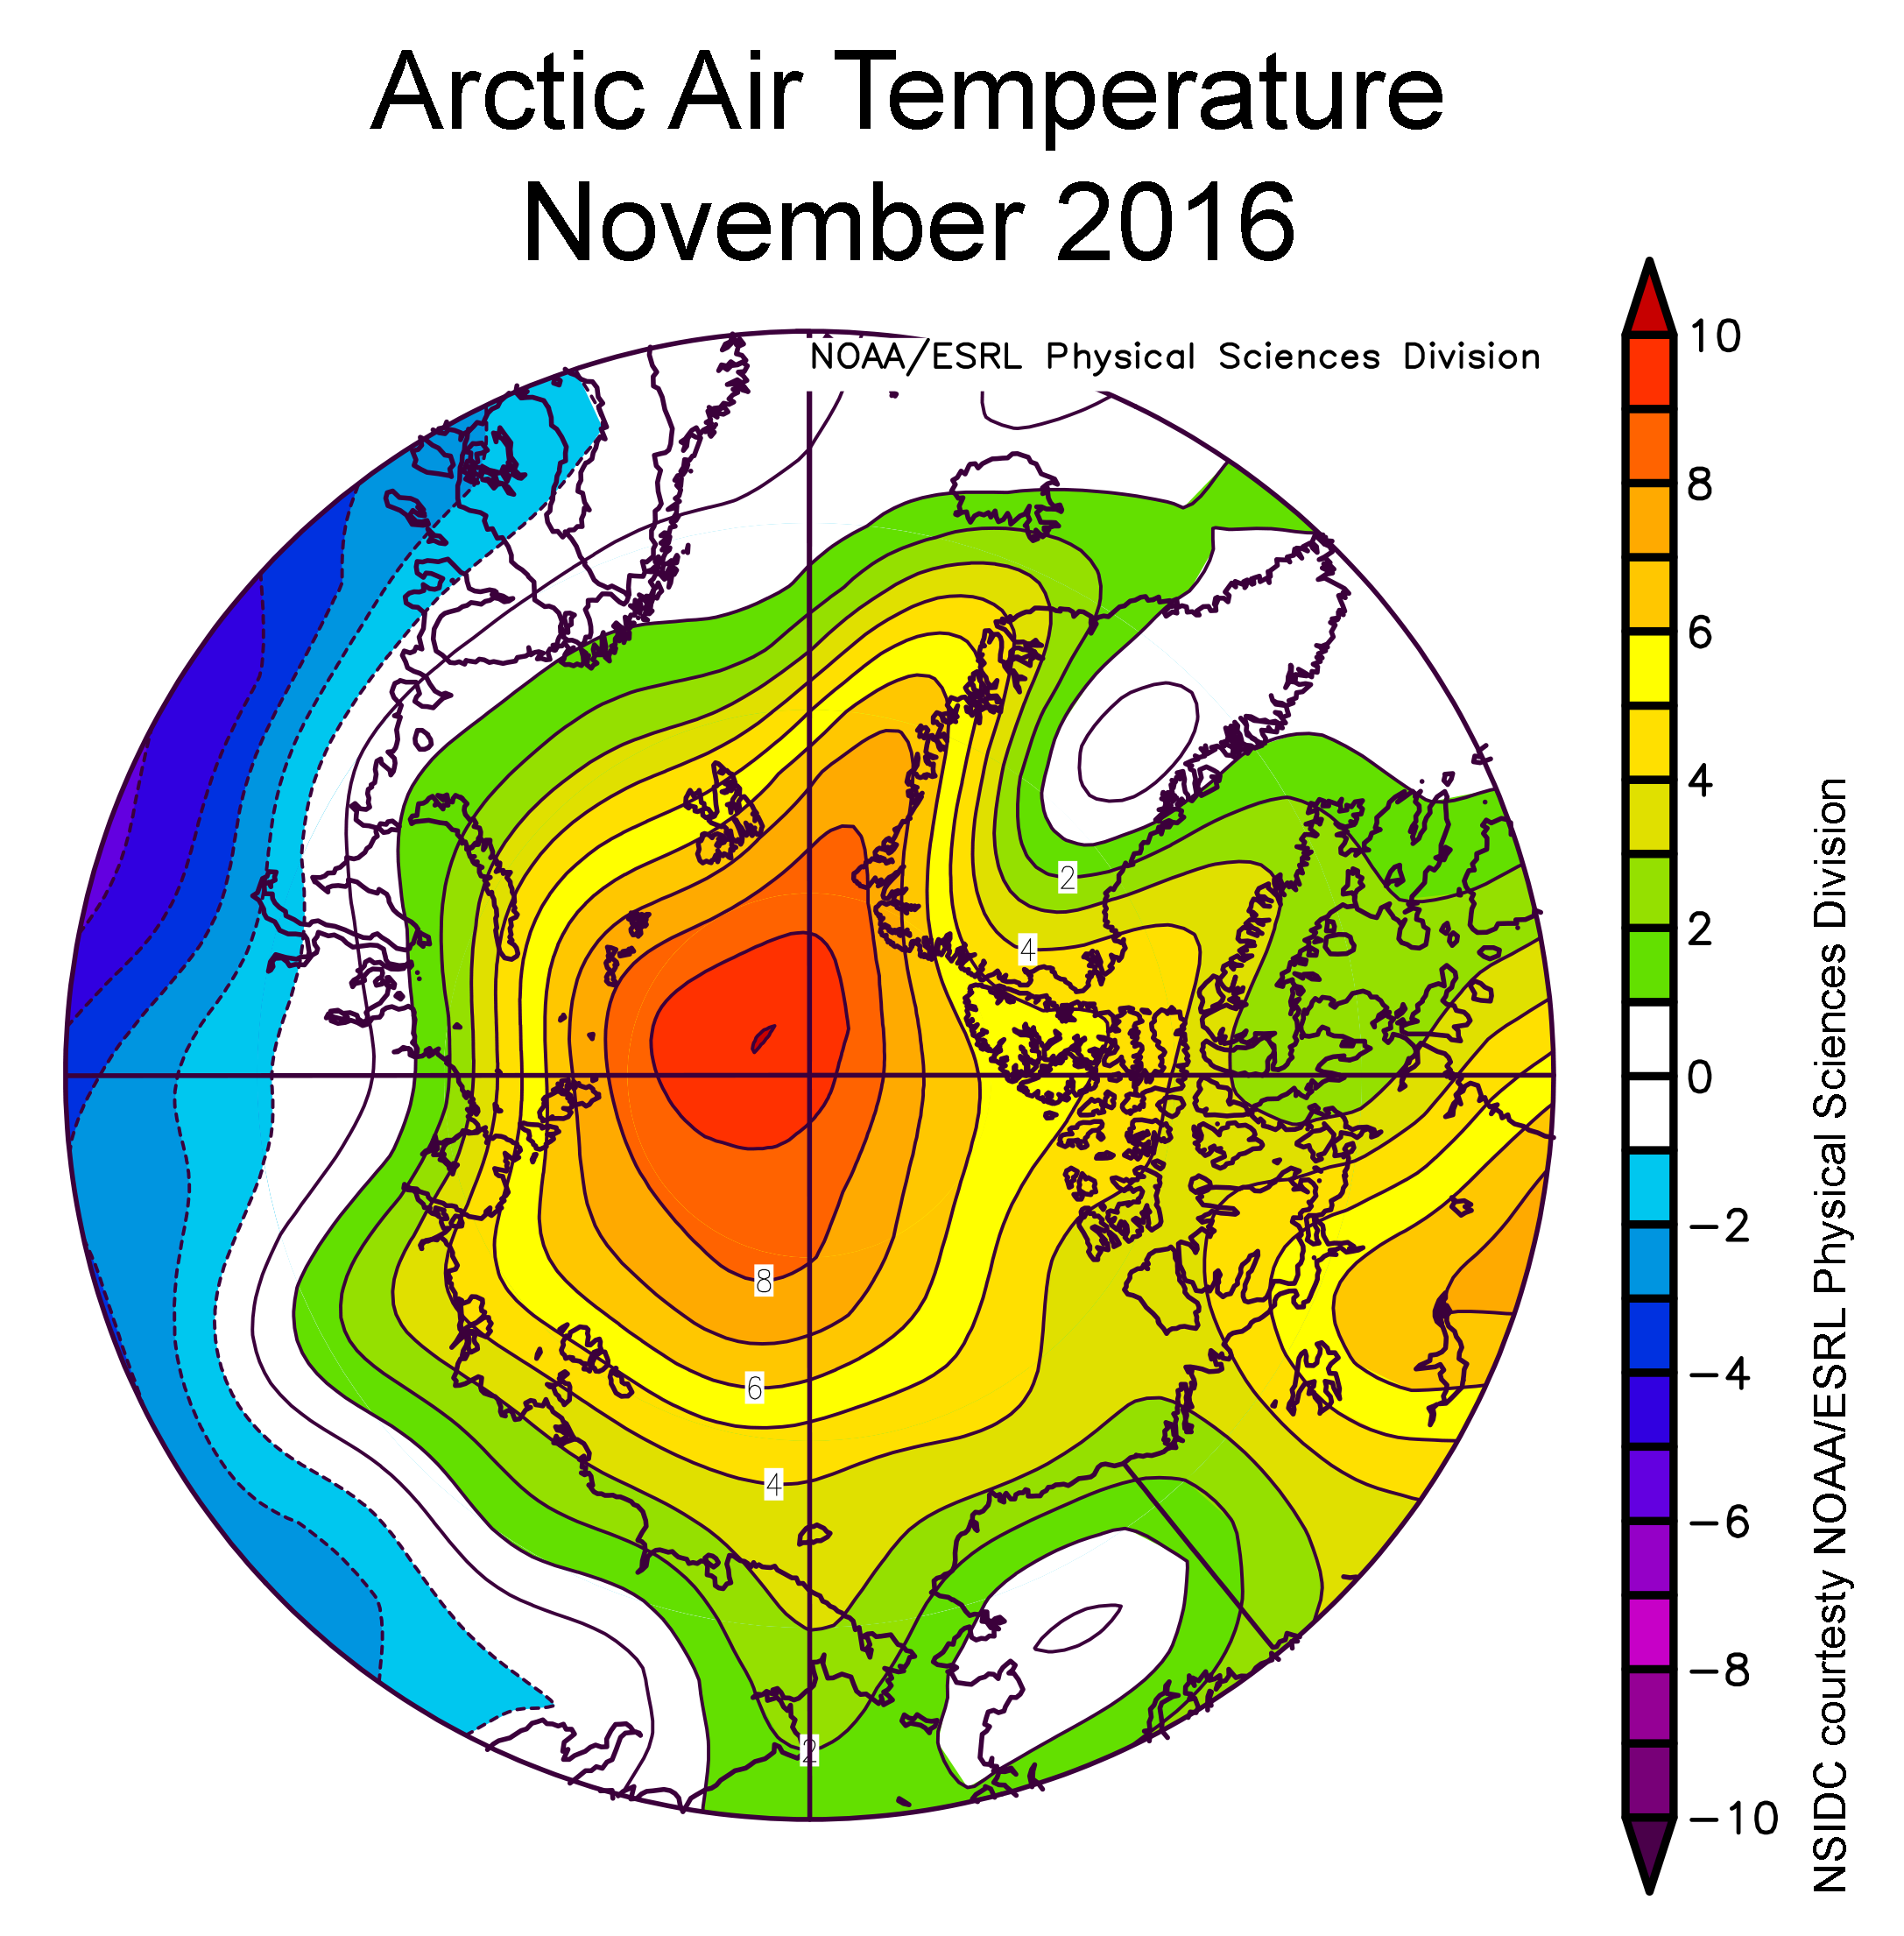
Figure 2b. This plot shows air temperature difference from average in the Arctic for November 2016. Air temperatures at the 925 hPa (approximately 2,500 feet) level in the atmosphere were above the 1981 to 2010 average over the entire Arctic Ocean and, locally up to 10 degrees Celsius (18 degrees Fahrenheit) above average near the North Pole. This is in sharp contrast to northern Eurasia, where temperatures were up to 4 to 8 degrees Celsius (7 to 14 degrees Fahrenheit) below average.
Credit: NSIDC courtesy NOAA/ESRL Physical Sciences Division
High-resolution image
Continuing the warm Arctic pattern seen in October, November air temperatures were far above average over the Arctic Ocean and Canada. Air temperatures at the 925 hPa level (about 2,500 feet above sea level) were above the 1981 to 2010 average over the entire Arctic Ocean and, locally up to 10 degrees Celsius (18 degrees Fahrenheit) above average near the North Pole. This is in sharp contrast to northern Eurasia, where temperatures were as much as 4 to 8 degrees Celsius (7 to 14 degrees Fahrenheit) below average (Figure 2b). Record snow events were reported in Sweden and across Siberia early in the month.
In autumn and winter, the typical cyclone path is from Iceland, across the Norwegian Sea and into the Barents Sea. This November, an unusual jet stream pattern set up, and storms instead tended to enter the Arctic Ocean through Fram Strait (between Svalbard and Greenland). This set up a pattern of southerly wind in Fram Strait, the Eurasian Arctic and the Barents Sea and accounts for some of the unusual warmth over the Arctic Ocean. The wind pattern also helped push the ice northwards and helps to explain why sea ice in the Barents Sea retreated during November.
Sea surface temperatures in the Barents and Kara Seas remained unusually high, which also helped prevent ice formation. These high sea surface temperatures are a result of warm Atlantic water circulating onto the Arctic continental shelf seas.
November 2016 compared to previous years

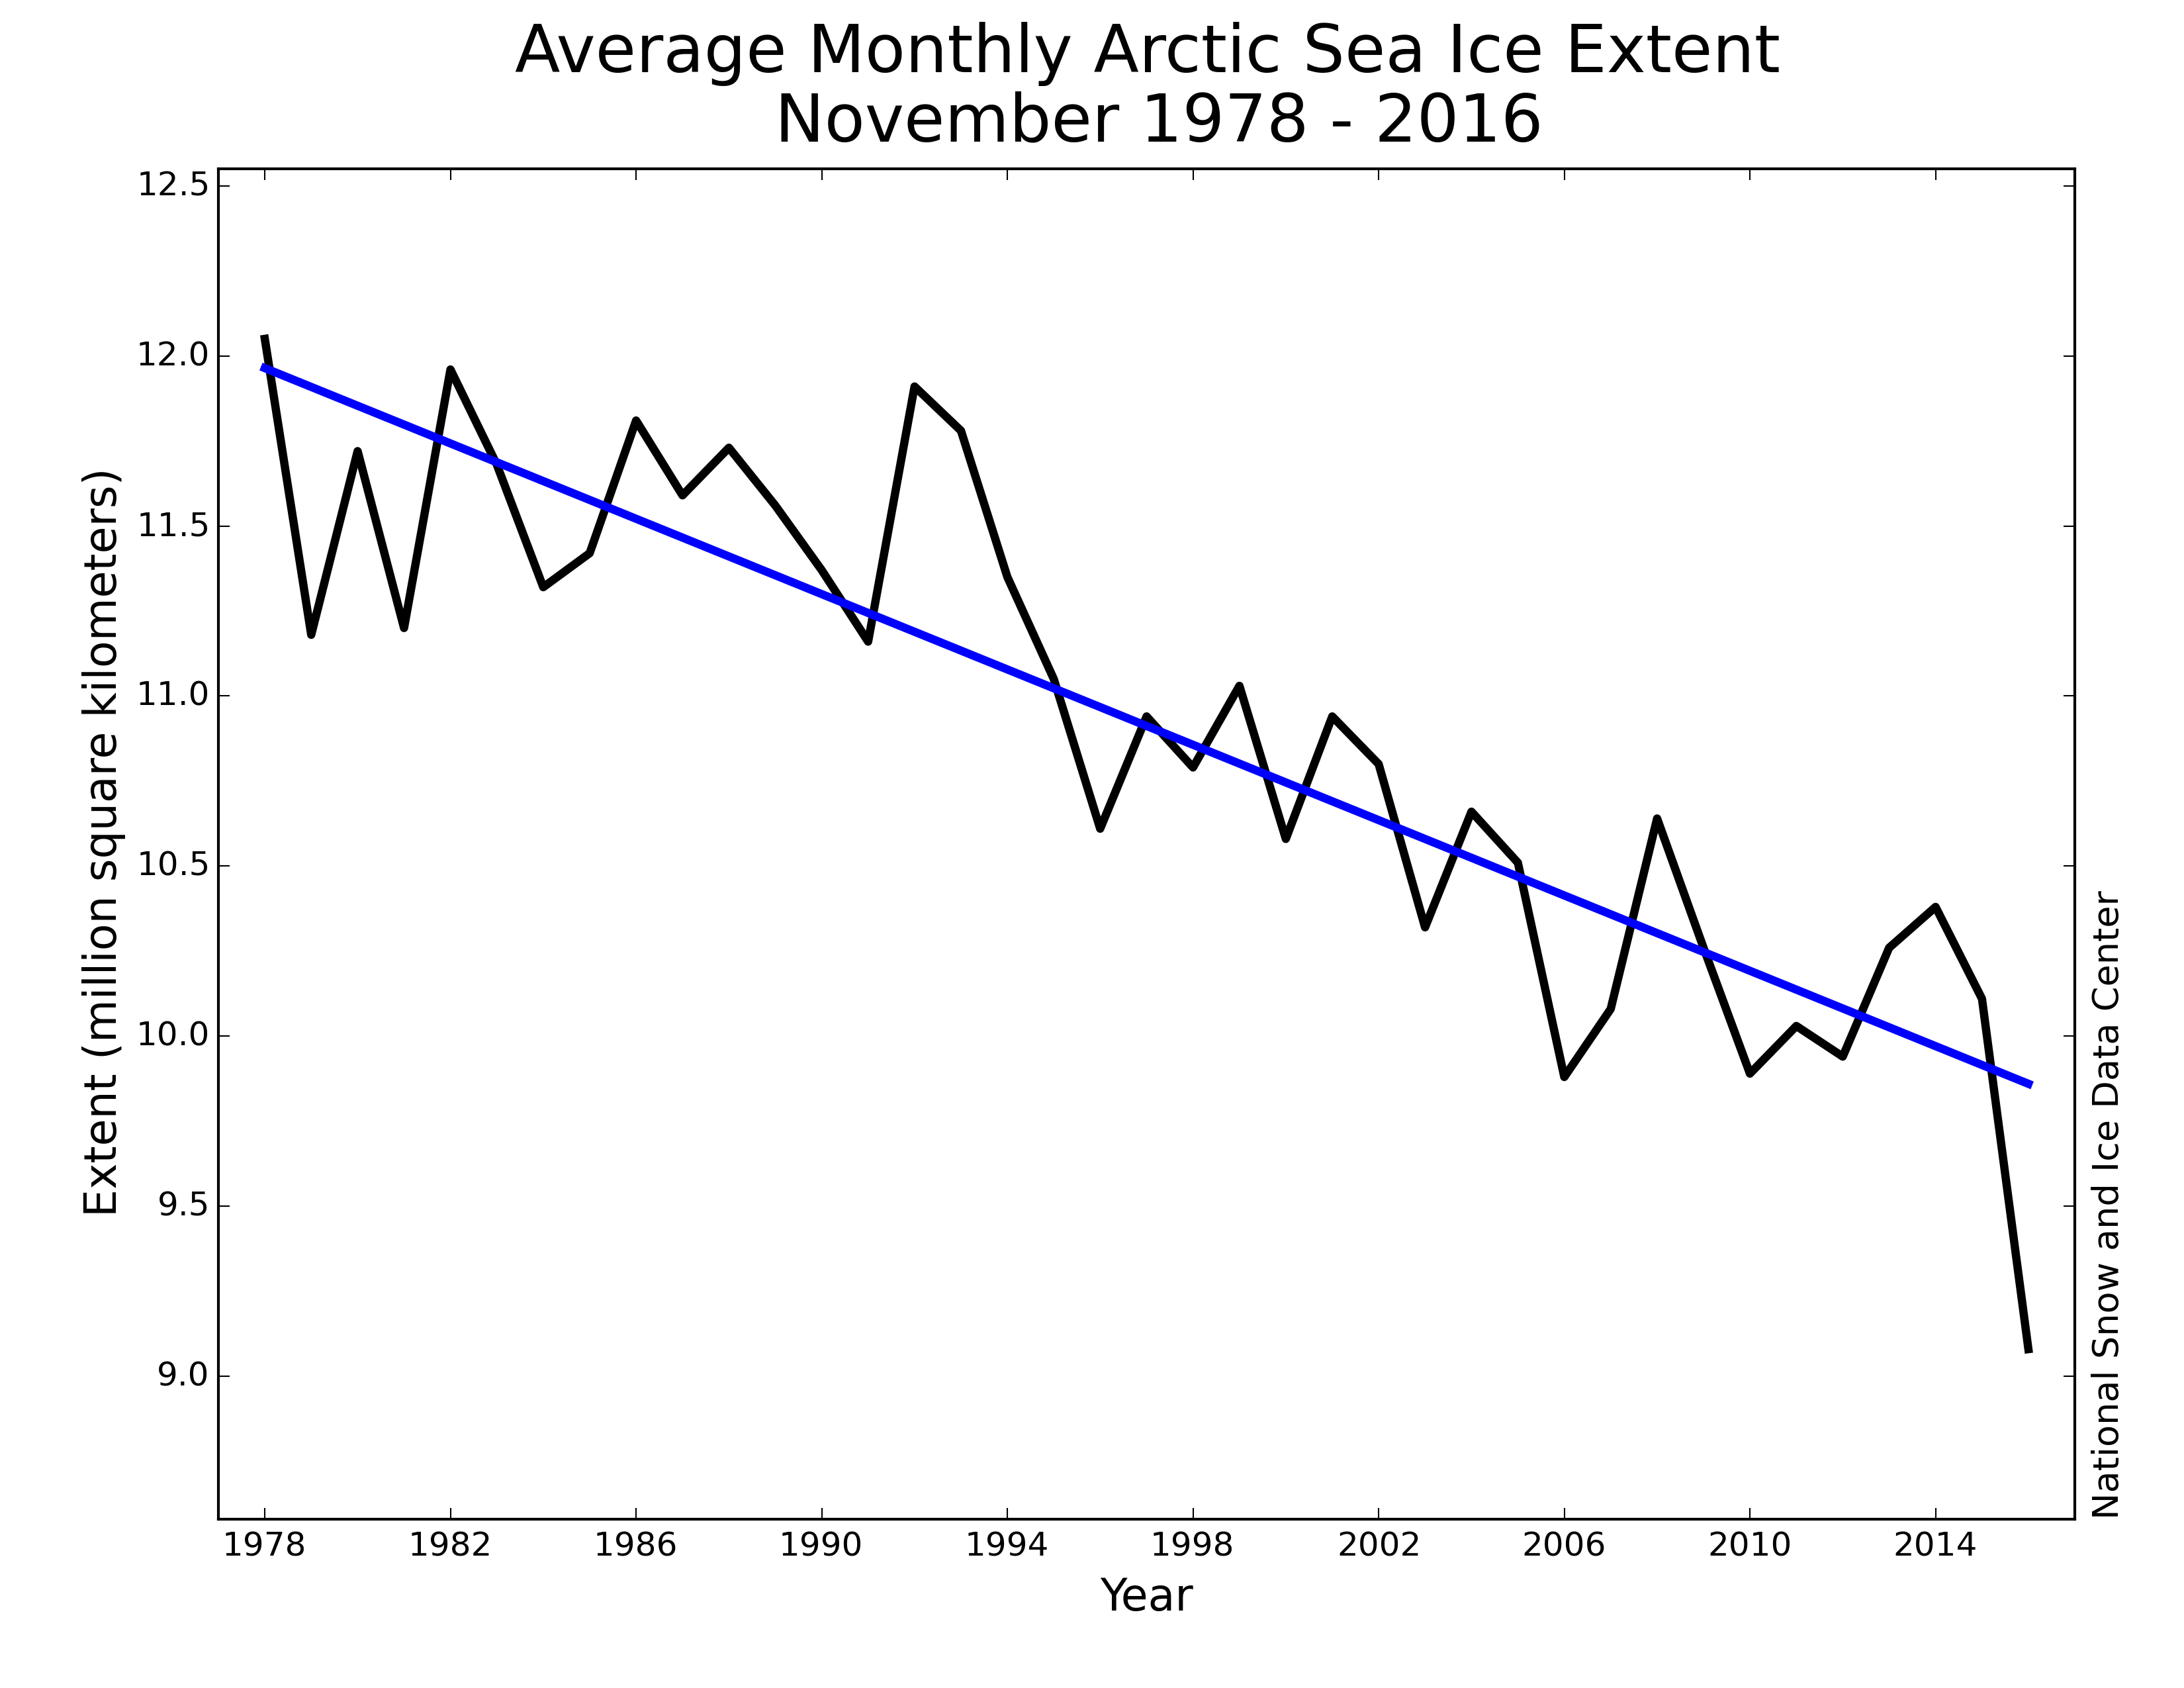
Figure 3. Monthly November ice extent for 1979 to 2016 shows a decline of 5.0 percent per decade.
Credit: National Snow and Ice Data Center
High-resolution image
Through 2016, the linear rate of decline for November is 55,400 square kilometers (21,400 square miles) per year, or 5.0 percent per decade.


 . Again.....this has happened many, many times and the cold shifts ( as it has to ). Never see the religion talking about that though.