Let's see your data. Here's mine:
View attachment 624530

en.wikipedia.org
View attachment 624532
The past eight years have been the warmest in the global record.

earthobservatory.nasa.gov
View attachment 624537
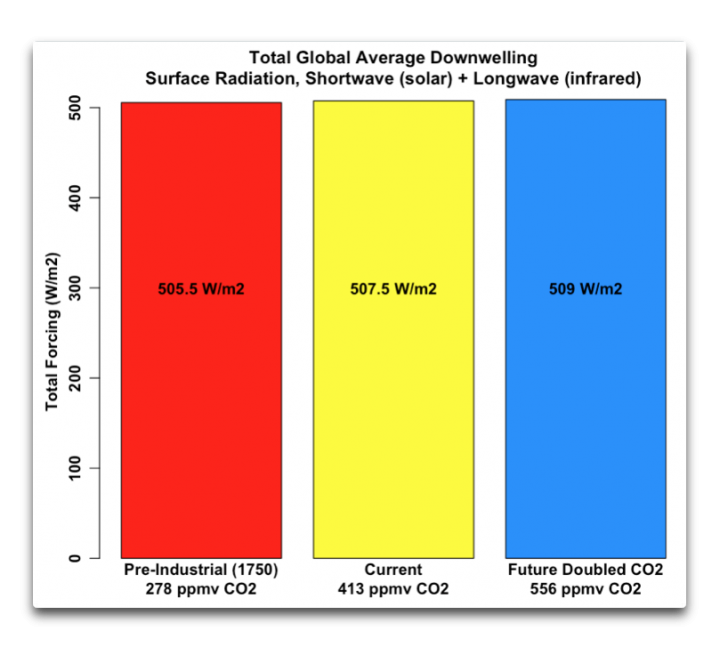
This indicator measures the “radiative forcing” or heating effect caused by greenhouse gases in the atmosphere.

www.epa.gov
I suggest you look up something known as a whoopee graph. And then you might wonder why Watts Up With That did not show what the resultant temperature differences to these changes might be.
Your stupidity never ceases to amuse me since I said SIX YEARS since the last El-Nino and posted the chart showing it you ignore it to post a chart starting from 1850 a warming trend I never disputed and told YOU so many times.
I think you are mentally ill since you constantly forget that I have many times stated in my postings that it has been warming since the mid 1800's since 1979 and heck even posted charts similar to yours showing the distinct warming trends in them even posted what Dr. Jones said about short warming trends since the 1800's.
You forgot this post I made about 25 times in the forum since 2018.
BBC
Q&A: Professor Phil Jones
Saturday, 13 February 2010
The BBC's environment analyst Roger Harrabin put questions to Professor Jones, including several gathered from climate sceptics. The questions were put to Professor Jones with the co-operation of UEA's press office.
Excerpt:
A - Do you agree that according to the global temperature record used by the IPCC, the rates of global warming from 1860-1880, 1910-1940 and 1975-1998 were identical?
An initial point to make is that in the responses to these questions I've assumed that when you talk about the global temperature record, you mean the record that combines the estimates from land regions with those from the marine regions of the world. CRU produces the land component, with the Met Office Hadley Centre producing the marine component.
Temperature data for the period 1860-1880 are more uncertain, because of sparser coverage, than for later periods in the 20th Century. The 1860-1880 period is also only 21 years in length. As for the two periods 1910-40 and 1975-1998 the warming rates are not statistically significantly different (see numbers below).
I have also included the trend over the period 1975 to 2009, which has a very similar trend to the period 1975-1998.
So, in answer to the question, the warming rates for all 4 periods are similar and not statistically significantly different from each other.
LINK
=====
I have agreed with his answer about warming trends since 2010.
You can't address the 6 year cooling trend and you know it which is why you ducked for your dumb 170 year chart that doesn't address my 6 year chart at all.
You clearly suffer from GOOK disease you should see a brain doctor to get rid of it.