LogikAndReazon
Gold Member
- Feb 21, 2012
- 5,351
- 669
- 190
Its estimated that 5000 trees will have to be planted to negate the fossil fuels burned to rescue those imbeciles.....precious
Follow along with the video below to see how to install our site as a web app on your home screen.
Note: This feature may not be available in some browsers.
Its estimated that 5000 trees will have to be planted to negate the fossil fuels burned to rescue those imbeciles.....precious


Its estimated that 5000 trees will have to be planted to negate the fossil fuels burned to rescue those imbeciles.....precious
now even the clueless of society thinks global warming is stoopid.
Its estimated that 5000 trees will have to be planted to negate the fossil fuels burned to rescue those imbeciles.....precious
Indeed........and go take a gander over to DRUDGE. All week, its been story after story of epic cold, frozen everything and references to cold similar to the surface of Mars.
The AGW mental cases sure have taken a stomp to the nut sack this past week.......now even the clueless of society thinks global warming is stoopid.
What a turnaround since 2006 for the climate crusader meatheads!!!
So, because Drudge ignores the epic warm there must be only epic cold in the world.
now even the clueless of society thinks global warming is stoopid.
Wouldn't they be expected even if global warming was the most obvious fact in the world? Clueless people aren't the people to aspire to.
Indeed, warmer temperatures cause more ice in the antarctic because the ice in the antarctic is not floating in the ocean but resting on top of land. Melting ice changes the salinity in the water, causing a change in the freezing temperature. This doesn't happen in the northern hemisphere because the ice is already in the water and is made up of salt water already.
Does it make sense to simply ignore the reduction in ice in the north and focus on a flawed understanding of how Antarctic conditions work.
Is the ice on Greenland not also sitting on dry land?
roflmao
Do you realize how small Greenland is, or are you forming your opinions based on a Mercator projection map? Most of the ice in the arctic is floating in the ocean. Go look at a map of the arctic circle before you embarrass yourself.
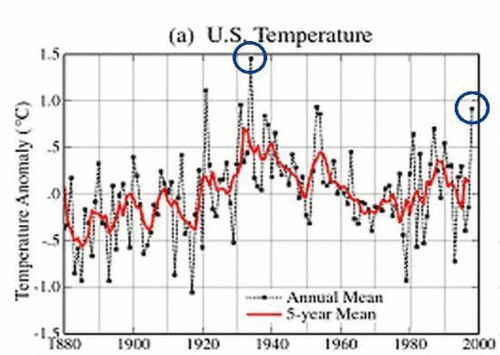
1. US weather is part of global weather and we should not be seeing record cold weather if the planet is still warming,
Says who, exactly? There is a difference between weather and climate, and local weather is not really a good determing factor of the state of the global climate.
which the New York Times and the London MET have all agreed has stopped for the last 17 years.
I was not aware that the New York Times or London MET were experts in climate change, and I'm not even sure this statement is true given what I read in the New York Times.
The rise in the surface temperature of earth has been markedly slower over the last 15 years than in the 20 years before that. And that lull in warming has occurred even as greenhouse gases have accumulated in the atmosphere at a record pace.
Q.1 “First, please confirm that they do indeed reveal no warming trend since 1997.”
The linear trend from August 1997 (in the middle of an exceptionally strong El Nino) to August 2012 (coming at the tail end of a double-dip La Nina) is about 0.03°C/decade, amounting to a temperature increase of 0.05°C over that period, ...
No, but warmer weather usually causes droughts and dry conditions, which contribute to forest fires.
3. Negative 20 degrees on the mid Atlantic coast is not slightly cold.
It's not the climate, either.
Your claim that the globe is still warming has been disproven; you simply refuse to accept it.
By who, exactly? The mainstream scientific community seems to disagree with this blatantly obvious falsehood.
In any case, if global warming skeptics are going to use their unusually cold local weather conditions as "evidence," you also have to accept unusually hot local weather conditions. You are picking and choosing your evidence to support your predetermined views.
Now, here is some actual proof that the CRU was deliberately tampering with their data. Unfortunately, for readability’s sake, this code was written in Interactive Data Language (IDL) and is a pain to go through.
NOTE: This is an actual snippet of code from the CRU contained in the source file: briffa_Sep98_d.pro
1;
2; Apply a VERY ARTIFICAL correction for decline!!
3;
4 yrloc=[1400,findgen(19)*5.+1904]
5 valadj=[0.,0.,0.,0.,0.,-0.1,-0.25,-0.3,0.,-0.1,0.3,0.8,1.2,1.7,2.5,2.6,2.6,2.6,2.6,2.6]*0.75 ; fudge factor
6 if n_elements(yrloc) ne n_elements(valadj) then message,'Oooops!'
7
8 yearlyadj=interpol(valadj,yrloc,timey)
")
Temperatures have not increased in the raw data for the last 17 years.Indeed........and go take a gander over to DRUDGE. All week, its been story after story of epic cold, frozen everything and references to cold similar to the surface of Mars.
The AGW mental cases sure have taken a stomp to the nut sack this past week.......now even the clueless of society thinks global warming is stoopid.
What a turnaround since 2006 for the climate crusader meatheads!!!
So, because Drudge ignores the epic warm there must be only epic cold in the world.
Temperatures have not increased in the raw data for the last 17 years.So, because Drudge ignores the epic warm there must be only epic cold in the world.
Global warming and cooling are a non issue. The earth has already done both naturally way before man started wrecking the ecosystem. It's a natural process the will be repeated over and over again. Humans are just all up in arms because it makes life for our specis difficult. Either we adapt or die, it's that simple, GW people need to get over it.
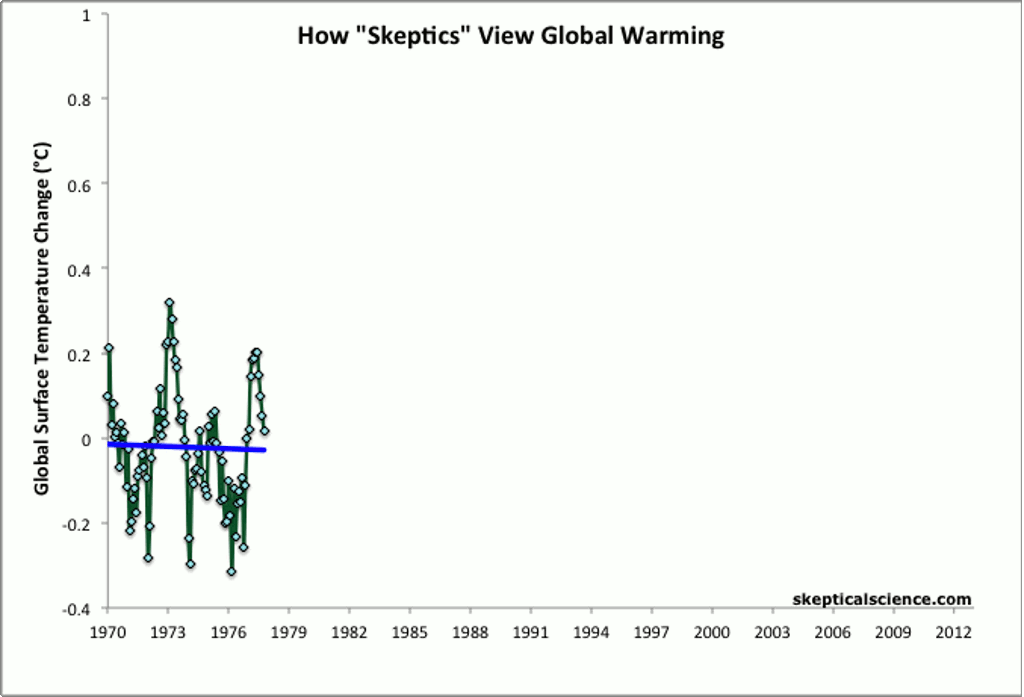
Temperatures have not increased in the raw data for the last 17 years.
Are you saying that chart is based on raw unadjusted numbers? If so then you are a pathetic liar.
Are you saying that chart is based on raw unadjusted numbers? If so then you are a pathetic liar.
My chart, which is the exact same chart the deniers use to claim there has been no warming for 17 years, is based on anomalies. Nobody uses raw unadjusted numbers, nobody with a working brain that is.
Are you saying that chart is based on raw unadjusted numbers? If so then you are a pathetic liar.
My chart, which is the exact same chart the deniers use to claim there has been no warming for 17 years, is based on anomalies. Nobody uses raw unadjusted numbers, nobody with a working brain that is.
Lol, so now science cant use raw data, they all have to cook it first?
roflmao
Yes, you dumbass liar, lots of scientists still use raw data.
lol, you just cant make this shit up!
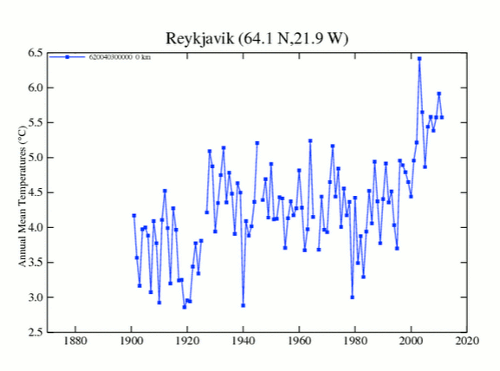
Yes, Greenland is the largest island on the planet, dude
and a subject of constant harping by Warmistas about how much of it is melting.